Chapter 19
Troubleshooting
So far you have read about various aspects of Configuration Manager 2012 R2, and in each chapter we have explained different aspects of the product and have assumed that every component will work correctly. However, everyone knows that situations may occur with the product that require troubleshooting, and every IT professional needs to know how to identify the problem and find a possible solution. There are many resources online that can assist you in this process; some of these places are Microsoft TechNet, Bing, and MVP blogs.
In this chapter, we will cover the basics of troubleshooting a ConfigMgr 2012 infrastructure and determining which log file you should look at first when a problem arises.
In this chapter, you will learn to
- Create a basic maintenance plan
- View log files using CMTrace
- Troubleshoot DRS replication
- Master the troubleshooting steps
Creating the Maintenance Plan
The best way to prevent issues from arising in Configuration Manager 2012 is to create and follow a standard maintenance plan. A well-executed maintenance plan allows administrators to be actively aware of their ConfigMgr 2012 hierarchy, offering a better chance of finding possible concerns before they become issues. Proactively watching the environment can reduce the number of major issues and thus keep your environment healthier.
ConfigMgr 2012 has some predefined site maintenance tasks that are enabled by default and some that need to be enabled. To view and modify the site maintenance tasks, take the following steps:
- Open the ConfigMgr console, and choose the Administration workspace.
- Expand Overview
 Site Configuration Sites, and select Site Name.
 - Right-click, browse to Site Maintenance, and click it to open the Site Maintenance window.
By default, Microsoft has 14 predefined tasks for the CAS server and 37 predefined tasks for primary sites. Secondary sites have only 4 predefined tasks. Some of these predefined tasks are enabled, while others are disabled by default.
- To enable a task, select its name and click Edit to display the task's Properties dialog box.
Figure 19.1 shows the Properties dialog box for the Backup Site Server task.
- Select Enable This Task.

SECONDARY SITES
You can back up a Central Administration Site and primary site, but there is no backup support for secondary sites or site system servers.
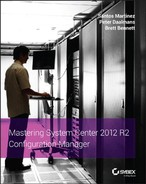
To ensure the proper health of the site, you should enable some of the predefined site maintenance tasks provided by Microsoft, and you'll need to modify the schedule of other tasks. Table 19.1 lists how the tasks should be configured in a typical maintenance plan; this might not be appropriate for all environments, but you can use the table as a guide.
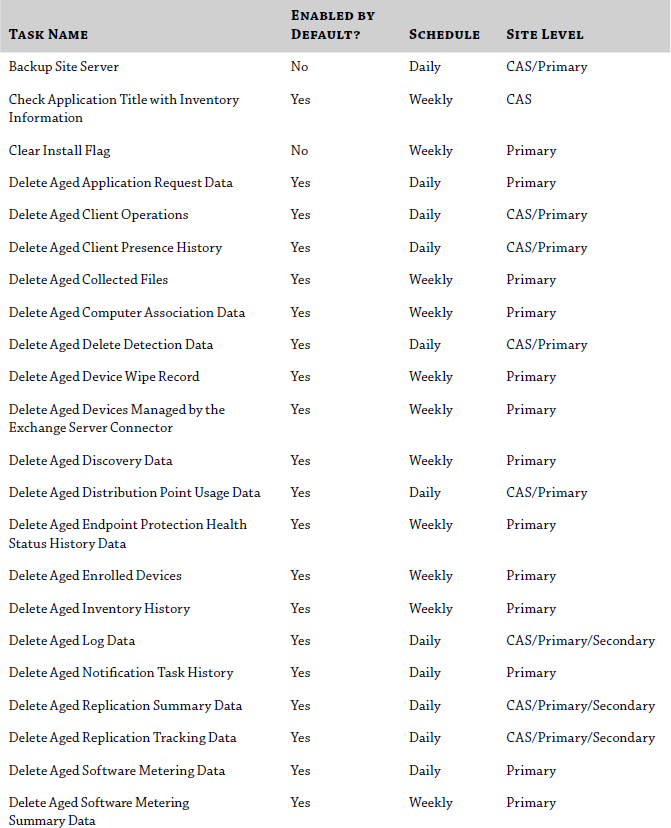
Some tasks do not need to be performed as frequently as others, but it's important to develop a maintenance plan for them to ensure the proper health of the site.
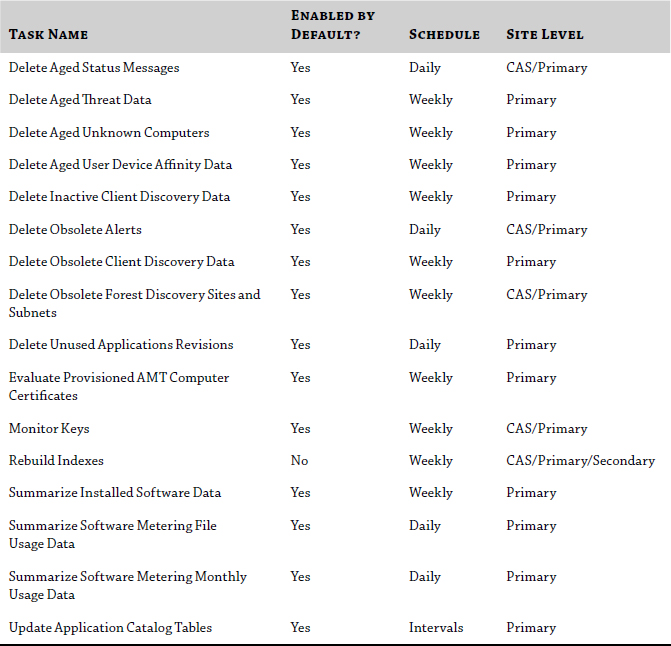
Table 19.2 summarizes what a typical maintenance plan should be for ConfigMgr 2012. Again, these recommendations might not be appropriate for organizations of all sizes; the table is meant to be used only as a guide.
Getting an approved maintenance plan for your hierarchy is your first step to developing a solid ConfigMgr infrastructure. The next step is to automate as many of the tasks as possible so they can be done in the most efficient manner without sacrificing the results. A maintenance plan is only as strong as the people implementing the plan.
Using Troubleshooting Tools
The most important troubleshooting tools are log files and status messages. Getting to know the most common log files for ConfigMgr is the first step in identifying a potential situation on your site servers; you can also use this proactively to monitor your site server activity and to know what is being processed in your environment. That being said, let's take a look at the most common log files.
Log Files
For the majority of troubleshooting, administrators will focus on the log (.log) files on either the client or the server and in some cases both. The client stores the log files in the folder C:Windowsccmlogs, while the site server stores the log files in the folder <installation Directory>Microsoft Configuration ManagerLogs. Table 19.3 lists site server log files, Table 19.4 lists management point log files, and Table 19.5 lists client log files.
The default location for the management point log files is Program FilesSMS_CCMLogs on the management point.
TABLE 19.3: Site server and site system server log files
TABLE 19.4: Management point log files
There are also log files outside ConfigMgr 2012 that you will need to be aware of when troubleshooting issues within Configuration Manager; Table 19.6 lists them.

There are many more log files for each ConfigMgr component. To learn more about the rest of the log files you can check out the ConfigMgr 2012 Library at http://technet.microsoft.com/en-us/library/hh427342.aspx. Here you can find details including the log file location and descriptions. Since ConfigMgr has many log files, we point out only the most common ones in this chapter.
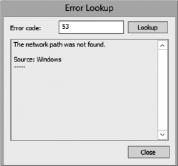
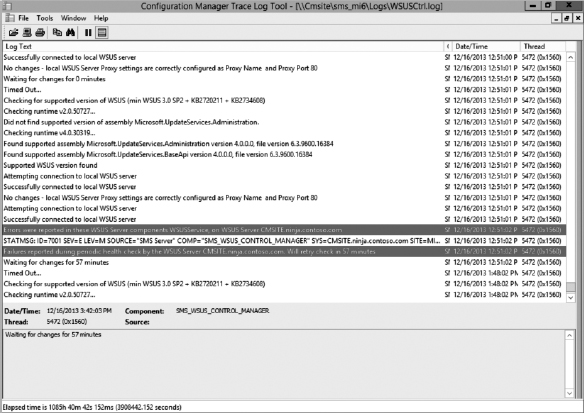
The best tool for reading log files we have seen is CMTrace, a log viewer that constantly monitors the opened file for updates. You can find CMTrace in the SMSSETUPTools folder on the ConfigMgr 2012 R2 source media. It provides real-time updates of any log file, allowing administrators to see exactly what is happening on a client or site system. If that isn't enough to win you over, CMTrace includes the capability to highlight and filter features to allow at-a-glance log viewing. Finally, the tool includes an error code dictionary, shown in Figure 19.2, so that you can quickly translate most of Microsoft's decimal error codes into useful information right within the tool. For example, entering 5 in the Error Lookup window returns “Access Denied.” This feature is available by selecting Tools ![]() Lookup in the CMTrace utility. CMTrace will highlight errors, as shown in Figure 19.3, so they stand out.
Lookup in the CMTrace utility. CMTrace will highlight errors, as shown in Figure 19.3, so they stand out.
The other tool you need is a reference to all the log files. We covered the log files and their locations earlier in this chapter, and this information is a great reference. So now you are well equipped to troubleshoot a ConfigMgr 2012 R2 site using the log files from the client or site systems, using the status messages in Configuration Manager, or using the web reporting feature of Configuration Manager.
Status Messages
Now that you have seen where the log files reside on both the client and servers, we will cover the troubleshooting components in the Configuration Manager 2012 R2 console. Microsoft has continued to provide status messages within the console.
LIMITATIONS OF STATUS MESSAGES
Status messages do have some limitations. The first limitation is that site systems must be able to communicate in order for status messages to be transferred back; if a site system component cannot report back because of a failed network connection, it might still be showing that it is available. Another limitation is that most client messages are transferred as low priority by default, and during high utilizations these messages might be delayed.
Although status messages have some limitations, they can still be vital weapons in the troubleshooting arsenal of a ConfigMgr administrator. They just shouldn't be the only source for troubleshooting, however.
Status messages reside in one location, which is why they provide some benefit when troubleshooting. They are arranged in one place so you can quickly see the health of the site at a glance. To view the site status, in the ConfigMgr console choose Monitoring ![]() Overview
Overview ![]() System Status
System Status ![]() Site Status.
Site Status.
The System Status dashboard is a summarized collection of the status of all the reported sites for easy viewing, and it has drill-down capability for each message. The System Status dashboard is organized into two categories, Component Status and Site Status, as shown in Figure 19.4.

To dig deeper into a Component Status message to see details about a problem, follow these steps:
- In the ConfigMgr console, choose Monitoring Overview System Status Component Status.
- Select the component you want to investigate. In this example, we will select the component SMS_DATABASE_NOTIFICATION_MONITOR.
- Right-click the component, and select Show Messages All, as shown in Figure 19.5.
This opens the Configuration Manager Status Message Viewer for <Site Code> <Site Name> window, as shown in Figure 19.6.
Note that you can filter the returned messages by selecting All, Info, Warning, or Error messages.
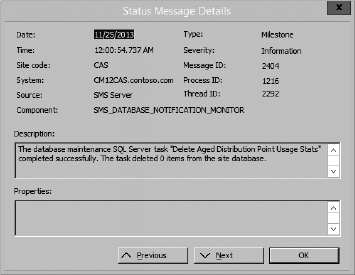
- Within the Configuration Manager Status Message Viewer window, double-click any of the messages to get a detailed view of the message, as shown in Figure 19.7.


USING WEB REPORTS TO VIEW STATUS MESSAGES
You can view status messages from the Web Reports tool within Configuration Manager 2012 R2. This is beneficial in case you are not able to access the ConfigMgr console or you have limited access to it. In either case, you can browse to your reporting point web console and view the status messages within a browser.
As discussed in Chapter 13, “Reporting,” web reports allow administrators to provide focused views of a ConfigMgr site database via a web browser and can be set up within a dashboard to give managers an at-a-glance overview of the hierarchy. Table 19.7 lists the reports available in the Status Messages category.
TABLE 19.7: Status Messages reports
| NAME | DESCRIPTION |
| All Messages for a Specific Message ID | Lists the messages with a single message ID |
| Clients Reporting Errors in the Last 12 Hours for a Specific Site | Lists the computers and components reporting errors in the last 12 hours and the number of errors reported |
| Component Messages for the Last 12 Hours | Lists the component messages for the last 12 hours for a specific site code, computer, and component |
| Component Messages for the Last Hour (for a Specific Site) | Lists the status messages created in the last hour by a specified component on a specified computer in a specified SMS site |
| Count Component Messages for the Last Hour for a Specific Site | Displays the number of status messages by component and severity reported in the last hour at a single specified site |
| Count Errors in the Last 12 Hours | Displays the number of server component error status messages in the last 12 hours |
| Fatal Errors (by Component) | Lists the computers reporting fatal errors by component |
| Fatal Errors (by Computer Name) | Lists the computers reporting fatal errors by computer name |
| Last 1000 Messages for a Specific Computer (Errors and Warnings) | Summarizes the last 1,000 error and warning component status messages for a single specified computer |
| Last 1000 Messages for a Specific Computer (Errors) | Summarizes the last 1,000 error server component status messages for a single specified computer |
| Last 1000 Messages for a Specific Computer (Errors, Warnings, and Information) | Summarizes the last 1,000 error, warning, and informational component status messages for a single specified computer |
| Last 1000 Messages for a Specific Server Component | Summarizes the most recent 1,000 status messages for a single specified server component |
As you can see, Microsoft has provided some nice reports out of the box for status messages. Of course, you can create your own report or modify any of the existing reports to fit your needs.
DEPLOYMENT STATUS
Configuration Manager offers deployment status via the Monitoring workspace in the ConfigMgr console; you can monitor the deployment of all software (software updates, compliance settings, applications, task sequences, packages, and programs). To view this section of the console, do the following.
- In the Configuration Manager console, choose the Monitoring workspace.
- In Overview, choose Deployments.
- To review general status information about an application deployment, select a deployment, and then choose the Summary tab of the Selected Deployment window.
- To review deployment details for a compliance state and the devices in that state, select a deployment, and then, at the bottom of the screen in the Compliance Statistics section, click View Status.
- To review information about the application's deployment type, select a deployment, and then click the Deployment Types tab of the Selected Deployment window.
Applications in Configuration Manager support state-based monitoring, which allows you to track the last application deployment state for users and devices. These state messages display information about individual devices. As you can see in Table 19.8, you can review the different states within the deployment.
TABLE 19.8: Application deployment state
| COLUMN NAME | DESCRIPTION |
| Success | The application deployment succeeded. |
| In Progress | The application deployment is in progress. |
| Unknown | The state of the application deployment could not be determined. |
| Requirements Not Met | The application was not deployed because it was not compliant with a dependency or a requirement rule. |
| Error | The application failed to deploy because of an error. |
You can view additional information for each compliance state, which includes subcategories within the compliance state and the number of users and devices in this category. For example, the Error compliance state contains three subcategories:
- Error Evaluating Policy
- Content Related Errors
- Installation Errors
When more than one compliance state applies for an application deployment to a user who has more than one device, you will see the aggregate state that represents the lowest compliance. For example, if a user logs into two devices, and the application is successfully installed on one device but fails to install on the second device, the aggregate deployment state of the application for that user is Error.
Use these subcategories to help you to quickly identify any important issues with an application deployment. You can also view additional information about which devices fall into a particular subcategory of a compliance state.
DISTRIBUTION STATUS
The Configuration Manager console provides improved content monitoring, including the status for all package types in relation to the associated distribution points, including the content validation status for the content in the package, the status of content assigned to a specific distribution point group, the state of content assigned to a distribution point, and the status of optional features for each distribution point.
The console provides a Content Status node in the Monitoring workspace (see Table 19.9). Inside this workspace you can review the information of the different packages and how many distribution points have been targeted. This is very similar to the old package status on Configuration Manager 2007. To monitor the content status and view the status, follow these steps:
- In the Configuration Manager console, choose Monitoring.
- In the Monitoring workspace, under Overview, expand Distribution Status, and then choose Content Status. The packages are displayed.
- Select the package for which you want detailed status information.
- At the bottom of the screen, in the Completion Statistics area, click View Status. Detailed status information for the package is displayed.
TABLE 19.9: Content status monitoring
| COLUMN NAME | DESCRIPTION |
| Software | Displays the name of the package |
| Type | Displays the type of content |
| Source Version | Displays the version number of the source files |
| Date Created | Displays the time and date the package was last changed |
| Targeted | Displays the total number of distribution points that have a copy of this package |
| Installed | Displays the total number of distribution points that have a copy of the current version |
| Pending | Displays the total number of distribution points that have had a failure in copying the package but have not exceeded the number of retries allowed and are currently retrying to copy the package or are in the state of removing the old package |
| Failed | Displays the total number of distribution points that have exceeded the number of retries and were unsuccessful at copying the package |
| Size | Displays the size of the package source folder |
| Source Site | Displays the site code of the site where the content was created |
| Package ID | Displays the package ID |
DISTRIBUTION POINT GROUP STATUS
This view can be found in the Monitoring workspace in the Configuration Manager console; here you can review information such as the distribution point group name, description, how many distribution points are members of the distribution point group, how many packages have been assigned to the group, distribution point group status, and compliance rate. You can also identify errors for the distribution point group, how many distributions are in progress, and how many have been successfully distributed. To perform this action, take the following steps:
- In the Configuration Manager console, choose Monitoring.
- In the Monitoring workspace, under the Overview, expand Distribution Status, and then choose Distribution Point Group Status. The distribution point groups are displayed.
- Select the distribution point group for which you want detailed status information.
- In the bottom section, in the Distribution Statistics area, click View Status.
Detailed status information for the distribution point group is displayed.
DISTRIBUTION POINT CONFIGURATION STATUS
On this node you can review what attributes are enabled for the distribution point, such as PXE, multicast, and content validation, as well as the distribution status for the distribution point. To view this information, perform the following steps.
- In the Configuration Manager console, choose Monitoring.
- In the Monitoring workspace, under the Overview, expand Distribution Status, and then choose Distribution Point Configuration Status. The distribution points are displayed.
- Select the distribution point for which you want distribution point status information.
- In the results pane, click the Details tab.
Status information for the distribution point is displayed.
SYSTEM STATUS
The System Status home page will highlight all the site systems within your Configuration Manager infrastructure and show a summary of the systems. Table 19.10 displays the information shown when you browse to the System Status home page by choosing the Monitoring workspace ![]() Overview
Overview ![]() System Status in the Configuration Manager console.
System Status in the Configuration Manager console.
Because of the comparatively slower replication speed of status messages, most ConfigMgr administrators will focus on the log files of the client, the server, and often a combination of both. Because there are so many log files, to keep track of which log file contains the information needed for troubleshooting every ConfigMgr administrator needs two tools:
CMTrace With this tool you can view the log file in real time.
Flowcharts These usually explain how each process works and its flow.
Troubleshooting Configuration Manager Deployment
If you experience issues deploying ConfigMgr 2012, you should first look into the following areas to see whether the issue is related to permissions, disk space, network connectivity, or timing:
Permissions Permissions are extremely important to ConfigMgr deployment. If ConfigMgr does not have appropriate rights to make the connection, then the operation will fail. Admins using the ConfigMgr console will need the appropriate permissions for WMI, for DCOM, for NTFS, and within ConfigMgr itself.
Disk Space Disk space is used to store the site database, packages, software updates, inventory, and collected files; all of these can use up a lot of disk space. How much space is used depends on your environment, but you should always verify that you have sufficient disk space to store all the data within Configuration Manager.
Network Connectivity Network connectivity is a key requirement of Configuration Manager. The site system must be able to communicate with other site systems and clients. As stated earlier, sometimes the network connectivity might be down but the status messages have not updated, so you need to ensure the clients and servers can connect to each other.
Timing Patience is not always a trait of ConfigMgr administrators, but it is an important one to develop. Some tasks within Configuration Manager, Active Directory, and Windows in general take some time to complete. That is why examining the log files is so important.
Troubleshooting Configuration Manager Database Replication
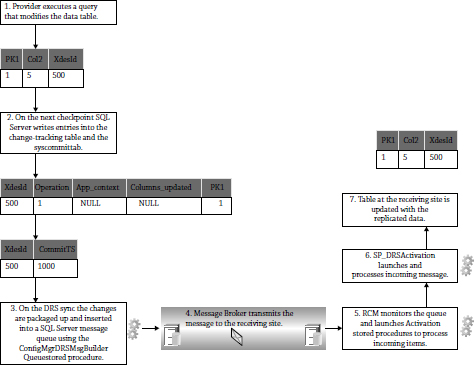
Database Replication in Configuration Manager 2012 R2 (shown in Figure 19.8) is based on the Data Replication Service (DRS). This depends on two SQL features: SQL Server Service Broker and Change Tracking; these have nothing to do with transactional replication. This replication is very important in ConfigMgr, and for this reason you need to ensure that this replication is working at all times. SQL Server Service Broker manages internal and external processes that can send and receive guaranteed async messages by using a data manipulation language. Messages can be sent to a queue in the same database as the sender, to another database in the same SQL instance, or to another SQL instance on a remote server. To better understand this concept you can visit the following site: http://technet.microsoft.com/en-us/library/gg712701.aspx#database_replication.

To look at the status of the current database replication, choose the Monitoring workspace ![]() Overview
Overview ![]() Database Replication.
Database Replication.
A SQL communication link is a logical entity that is used to reflect the overall status of SQL communication between two sites. The link reflects the overall status of global and site data being replicated between two sites.
Each global and site data replication link will have one of the following states:
Link Active This state implies that data is being replicated as per schedule.
Link Failed This state implies that data is not being replicated because of errors. This state can also be caused when communication does not occur for more than 25 minutes.
Link Degraded This state implies that no communication has occurred for approximately 15 minutes. Regular replication intervals are approximately every 2 minutes, so a 15-minute delay in communication could indicate a degraded link.
Link Error This state implies that the replication data has synced but with errors; these errors could be due to failed data validation or conflicts.
Data Types
There are various data types in Configuration Manager. Objects that will be replicated in Configuration Manager are based on these types.
The type of data generated at the Central Administration Site and primary sites and replicated across the hierarchy is called global data. Since this data is globally available, it can be modified or deleted from the Central Administration Site or any primary site, regardless of where it was created, provided proper Role-Based Access Control (RBAC) permissions are configured.
The following elements are part of global data:
- Collections
- Packages
- Programs
- Deployments
- Configuration items
- Software updates
- Task sequences
- OS images (boot images, driver packages, and the like)
- Site control file
- System resource list (site servers)
- Site security objects (roles, scopes, and so on)
- Client authentication
- Client discovery
Global data replication is built on the Service Broker infrastructure provided by SQL Server.
Primary sites generate site data; it is potentially replicated to the Central Administration Site but never replicated between primary sites. You can view this process in Figure 19.9. Since this data is visible only at the Central Administration Site and the primary site where the data originated, it cannot be modified or deleted from other primary sites. If the data needs to be modified, it can be modified only at the originating site.
The following elements are part of site data:
- Collection membership
- Alerts
- Hardware inventory
- Software inventory and metering
- Status messages
- General site data
- Asset Intelligence CAL track data
- Software distribution status details
- Software updates replicated site data
- Software updates non-replicated site data
- Status summary data
- Component and site status summarizers
- Client health data
- Client health history
- Wake On LAN
- Quarantine client restriction history

DRS Initialization
The process of DRS initialization is as follows:
- A receiving site sends an init request to the sending site for the required replication group.
- The sending site uses bcp (Bulk Copy Program) to export all the data from the tables in the replication group. During this phase, you can open the RCMCtrl.log file, as shown in Figure 19.10.
- Hierarchy replication copies the BCP files and sends a count of each row for each table to the receiving site inbox via the senders. To view the details about this process, see Figure 19.11.

By default ConfigMgr starts with the Replication Configuration Data group, which contains the data about other groups to be replicated.
To evaluate this process you can then open the RCMCtrl.log at the primary site or CAS (Figure 19.10).
You can also open SQL Server Management Studio and expand the Configuration Manager database ![]() Programmability and locate the spDiagDRS stored procedure. Executing this stored procedure will show the different statuses of the data types and the link status between sites.
Programmability and locate the spDiagDRS stored procedure. Executing this stored procedure will show the different statuses of the data types and the link status between sites.
TROUBLESHOOTING CONTOSO
In this scenario you have been asked to go onsite to troubleshoot a problem with a Contoso hierarchy. Contoso is a financial institution that has a Tier 3 Configuration Manager hierarchy. As an engineer, you will review Contoso's environment for potential issues.
THE SITUATION
The hierarchy is not replicating changes to a specific package.
TROUBLESHOOTING STEPS
The first thing you have to do is understand Contoso's issues and goals. It's important to follow a process to resolve the problem. I always use the following process—seven steps of problem solving:
- Define and identify the problem.
- Analyze the situation.
- Identify possible solutions.
- Select the best solution.
- Evaluate the solution.
- Develop an action plan.
- Implement the solution.
If you follow these steps, you will be able to resolve most Configuration Manager issues or any problems that may arise.
- Define and identify the problem.
One package is not replicating to a primary site.
- Analyze the situation.
Find this package on the Configuration Manager 2012 R2 console and note the Package ID. Then validate the current state of the database replication. In the Monitoring workspace you can validate the content by using Content Monitoring.
At this point you know the Package ID, the distribution points this package is currently deployed to, and the potential issues this package may have. But the problem is still not fixed because you have only identified potential issues.
- Identify possible solutions.
During the review of database replication you found out that the current state is Link Degraded. In this chapter you learned that this state indicates that SQL has not been able to communicate with the server in the past 15 minutes. To continue troubleshooting this issue you must open RCMCtrl.log using CMTrace.exe and find out the last time the package was replicated to this site. If the replication hasn't occurred in the past 15 minutes, you must try to resolve other potential issues related to communication.
- Select the best solution.
You have determined that the issue identified in step 3 is related to communication with the primary site. You contact the network administrator and explain the communication problems you are having on the site. The administrator promises to resolve the issue within a couple of hours. To solve the problem you decide you will reinitiate database replication, resend the package to the primary site, and review the log files for confirmation that the package has replicated.
- Evaluate the solution.
The solution provided in step 4 was to reinitiate database replication. You also need to review the replication process as described in Figure 19.11. If this solution is the one that makes the most sense to implement in this environment, then it is the one you will execute. It's very important to evaluate the solution in detail before implementing it.
- Develop an action plan.
To be able to accomplish this, you need to understand what you must do to solve this problem:
- You need to determine what people need to be involved and what tasks they need to perform.
- Since the solution provided is related to communication, you must explain your action plan to the network administrator, who will evaluate the communication.
- You will execute a new database replication on the Configuration Manager 2012 R2 environment; it's a good idea to have the database administrator involved just in case you need to back out your plan or have them help you understand the process involved in resolving the situation.
- Once all the tasks are outlined and everyone understands what is needed to solve the problem on the site, you can execute the plan on the environment.
You should always have a back-out plan just in case your solution doesn't solve the problem. If that happens, you'll need to go back to step 1.
- Implement the solution.
Now that you have all the tasks figured out, go ahead and execute the plan to solve this problem:
- Get the database replication in place again.
- Resend the package to the distribution point.
- Evaluate the log files to confirm the package was sent out to the distribution point.
- Validate that the content is on the primary site where you were having the problem.
After executing each task, the problem on the primary site should be solved and the package should be replicated. If the problem is still not fixed at this point, go back to steps 5 and 6, and make sure you understand the situation correctly.
Solving a problem can take from minutes to hours in a Configuration Manager environment; it will depend on the complexity of the hierarchy you are working on and the type of problem. This was a quick guide to resolving issues in a structured way. Always make sure you understand the problem correctly before attempting to solve it.
Understanding these processes is key to troubleshooting DRS replication in Configuration Manager. Be sure to review this process and learn how the DRS and stored procedures are executed in this process for a successful replication.
Additional Tools
One other set of tools available to you for troubleshooting is the System Center 2012 R2 Configuration Manager Toolkit, available at www.microsoft.com/en-us/download/details.aspx?id=36213. This toolkit contains 15 tools to help you manage and troubleshoot ConfigMgr 2012 R2. We cover the tools next, divided into server-based tools and client-based tools.
Server-Based Tools
DP Job Manager (DPJobManager) helps you troubleshoot and manage ongoing content distribution jobs to ConfigMgr distribution points, as shown in Figure 19.12.
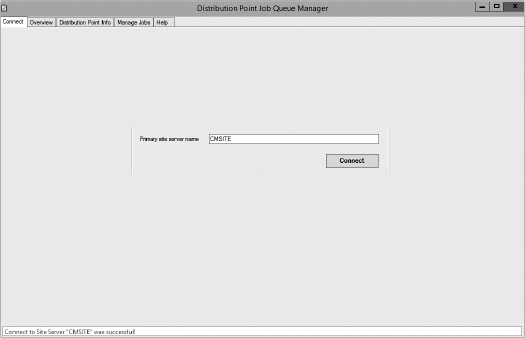
With DP Job Manager open, you enter the name of the primary site server where those distribution points are connected. You can then choose the Overview, Distribution Point Info, Manage Jobs, or Help tabs to get additional details about the queues.
Collection Evaluation Viewer (CEViewer) assists you in troubleshooting collection evaluation–related issues by viewing collection evaluation details, as shown in Figure 19.13.
Once you're connected to the primary site, you will be able to review the current collections. For example, as you can see in Figure 19.13, from the current collections that are performing a full evaluation in this list, you can determine the collection name, site id, run time, last evaluation time, next evaluation time, member changes, last member change time, and percent of members. All this information is useful when troubleshooting collections. Besides the full evaluation, there are other tabs that will help on this troubleshooting. Here are more details about each tab.
- Incremental Evaluation will show you all the collections that have been marked with the Use Incremental Updates For This Collection.
- All Queues gives you a dashboard of what is currently running on all the queues.
- Manual Queue is for collections that have been manually selected for evaluation from the administrative console UI.
- New Queue is for newly created collections.
- Full Queue is for collections due for full evaluation.
- Incremental Queue is for collections with incremental evaluation.

This is a very good tool that will help you address the question of why a collection has not updated.
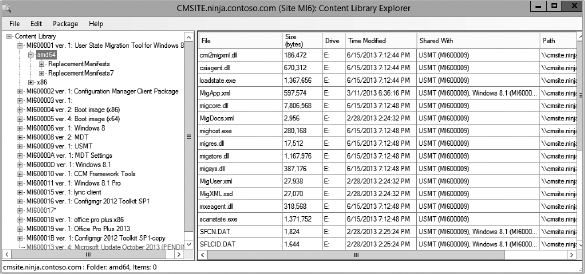
Content Library Explorer assists you in troubleshooting issues with and viewing the contents of the content library, as shown in Figure 19.14.
Once you open Content Library Explorer, it will ask you to connect to the distribution point by entering its FQDN. Once you're connected to the distribution point, you will be able to browse the content library and select the package ID you are trying to troubleshoot.
You can use the Security Configuration Wizard Template for System Center 2012 R2 ConfigMgr to help secure the site server. The wizard is an attack-surface reduction tool for the Microsoft Windows Server 2008 R2 operating system. Security Configuration Wizard determines the minimum functionality required for a server's role or roles and disables the functionality that is not required. An example of this is shown in Figure 19.15. With this file you can then use the Security Configuration Wizard (SCW) to apply the .xml file to the site server by running the following command line: scwcmd register /kbname:ConfigMgr /kbfile:c:program files (x86)ConfigMgr 2012 toolkitServerToolsConfigMgr2012SCW.xml

Content Library Transfer is a tool that transfers content from one disk drive to another, as you can see in Figure 19.16.
You can imagine a distribution point whose drive is filling up quickly, and you need to move the content from one drive to another but don't want to rebuild the distribution point. Instead, you can move the content from one drive to another by entering the following command: ContentLibraryTransfer.exe -SourceDrive X: -TargetDrive Y. Once the command finishes, the content library will be located on the new drive.

The Content Ownership Tool changes the ownership of orphaned packages (packages without an owner site server), as shown in Figure 19.17.

If you select Only Orphaned Packages, all orphaned packages will be displayed in the list. You can also choose All Packages to see all the package names. Once you find an orphaned package, you can click Change Site Ownership To and specify the new site; then click Apply.
The Role-Based Administration Modeling and Auditing Tool (RBA Viewer) helps administrators model and audit RBA configurations, as shown in Figure 19.18.
RBA Viewer is a great tool to use to model the security role; more importantly, you can audit a user by clicking the green play button at the top of the screen. Then all you need to do is enter the user information and click Check. This will display the current assignments and console view.
The Run Metering Summarization Tool (runmetersumm) runs the metering summarization task to analyze raw metering data, as shown in Figure 19.19.

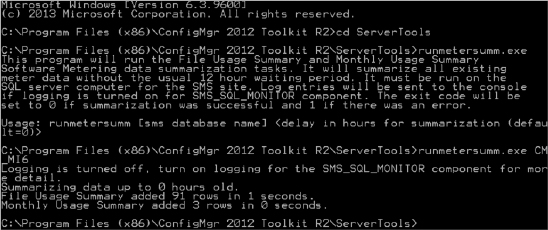
You can use this tool to update the software metering data. This needs to run at the primary site server where the data is going to be inserted. Once that's completed, you will be able to run the software metering reports with no problem.
Client-Based Tools
Client Troubleshooting Tool (CliSpy) is a tool that helps you troubleshoot issues related to software distribution, inventory, and software metering on ConfigMgr clients, as shown in Figure 19.20.

To use this tool, you must click Tools and connect to the client you are currently troubleshooting. Once you're connected, you will have the option to review each tab and identify the potential problem on the client.
Configuration Manager Trace Log Viewer is a tool used to view log files created by ConfigMgr components and agents. This tool was covered earlier in this chapter and is shown in Figure 19.3; it is the day-to-day tool of every ConfigMgr administrator.
The Deployment Monitoring Tool is a graphical user interface designed to help troubleshoot applications, updates, and baseline deployments on ConfigMgr clients, as shown in Figure 19.21.

Once open, it will connect by default to the current computer. To connect to another computer, you must click Actions and then click Connect To Remote Machine. Once you have chosen the computer to troubleshoot, you can click Client Properties to review the information of the client. You can click Deployments to validate what deployments have been completed on the machine or are optional to the machine. This will also include baselines deployments, as mentioned earlier. You can also click All Updates; this status will display all the current installed or missing.
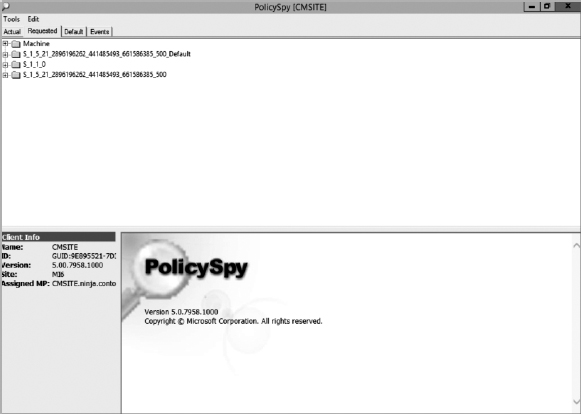
Policy Spy is a policy viewer that helps you review and troubleshoot the policy system on ConfigMgr clients, as shown in Figure 19.22.
You can use the Power Viewer Tool to view the status of the power-management feature on ConfigMgr clients, as shown in Figure 19.23.
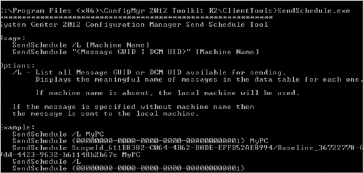
The Send Schedule Tool is used to trigger a schedule on a client or trigger the evaluation of a specified DCM baseline. You can trigger a schedule either locally or remotely, as shown in Figure 19.24.

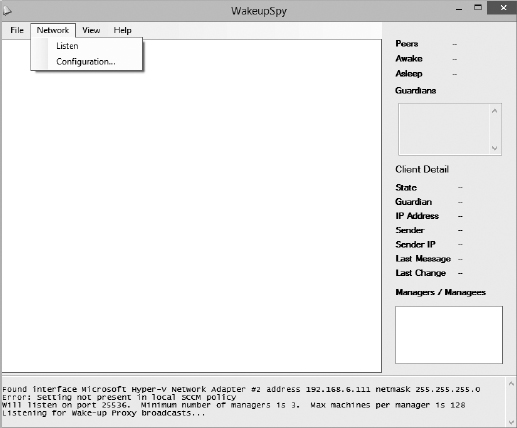
Wakeup Spy is a tool that provides a view of the power state of ConfigMgr client computers, as shown in Figure 19.25.
The Bottom Line
Create a basic maintenance plan. Setting up a basic maintenance plan is a vital step to ensure the proper health of your Configuration Manager 2012 R2 hierarchy.
Master It How do you create a basic maintenance plan?
View log files using CMTrace. Although using CMTrace is not a requirement for viewing log files, it is highly recommended because CMTrace constantly monitors the opened file for updates.
Master It Use CMTrace to view log files.
Troubleshoot DRS replication. To view the current status of the ConfigMgr DRS replication and to know the latest information about the changes being requested on the site, it's important to be familiar with the log file and the replication process.
Master It To view the latest changes on the replication process, what log file do you need to open to view this information?
Master the troubleshooting steps. It's important to outline the steps to identify a problem and solve it.
Master It How many steps were needed to troubleshoot Contoso?