Automating Analytics
Transformation without analytics is just digitization. Analytics makes it transformative.
David Sweenor, Alteryx
Your business changes. It is inevitable. Consumer trends shift, supply chains evolve, and technology advances. You rely on sales reports, market intelligence, and performance indicators to track the health of our business, but how do you keep track of it all? Do you have a method for seeing all the data flowing through your organization? Is it easy to use? Is it fast? Does it get to the right people and systems at the right time? How you get information and insights from all that data and how you do it quickly enough to make decisions that keep your business moving forward differentiates you from the competition. It is a constant struggle to keep up with the huge amounts of data flowing through and around your organization. Successful industries and organizations understand the need for prompt, reliable insights, and they realize that these insights are founded on fast, reliable analytics.
Creating insights is only part of the equation. How do you get those insights to the people who need them? Business information isn’t just for executives and leadership. What if your employees could identify bottlenecks in your manufacturing process by understanding insights hidden within your data? Could your marketing team use data to identify personas and trends in customer habits to better align their campaigns? Could your HR team rely on personnel data to identify hot spots for turnover or target new talent? Data is everywhere in your organization, and the insights within it can benefit the company at every level. So, the final question you have to ask yourself is this: “How can I get my employees the access, skills, knowledge, and tools they need to make data-driven decisions that will improve my organization’s business outcomes?”
One solution that many organizations and businesses rely on is analytics software combined with data and analytics experts to transform data into insights. While this may be a common solution, it creates a gap in the analytics workflow. In this scenario, data analysts and experts lack the deep domain knowledge of your business to create the insights your business may need. On the other hand, those who have the knowledge of the business usually lack the tools or analytics expertise to do their own analysis. This gap can result in analytic output that misses key business insights or arrives too late to be actionable, resulting in missed opportunities or revenue being left on the table.
Take a look at your own organization. Does data-driven insight flow smoothly through it? Can anyone on any team access the information necessary to make important decisions related to their job? How long does it take to get from your transactional systems to decision-making insights? How easy is it to update your analytic processes if your business changes? Does your leadership team have access to the transformative insights they need? Understanding the typical flow of data (which is ultimately transformed into actionable insights) through an organization will help illustrate the bottlenecks and pitfalls of legacy data and analytic processes, a topic we’ll dig into in the next section.
A more effective approach is to upskill your workforce so they’re able to pair their business domain expertise with reliable data analysis. The result is an organization with employees that are empowered to utilize and analyze data to accelerate and improve decision making. Giving nontechnical users access to information systems and allowing them the power to do analysis and develop insights on their own has been shown to result in unique and meaningful insights that drive the business forward.
But how do you do that? You provide a bridge to give the individuals running the business the capability to derive their own insights without the need of complex tools, code, or technical expertise. By delivering data and analytics capabilities to your workforce, you’re creating an environment of data and analytics democratization within your organization. This means less time is spent relying on outdated processes and waiting on experts to generate analysis results, and more time is spent finding insights across your business so you can achieve your strategic objectives. With these resources, domain experts have the ability to do data preparation, analysis, predictive analytics, and insight generation on their own.
What does this mean for your business? It means that decisions can be made faster and closer to the point where they can be most impactful. It means that your company saves time, money, and effort by empowering your employees with the tools they need to better understand how your business works and to act upon insights that will make it run more efficiently.
So how do you achieve data democratization and empower your employees? Fortunately, there are already platforms available that enable organizations to expand the scope of people benefiting from using analytics, effectively moving this expertise beyond data scientists to allow anyone within the organization to be able to transform data into insights. While no tool will completely eliminate the need for highly skilled data analysts and data scientists, there are several key things that can be done to improve the flow of data from transaction to insight within your business. These tools can also improve the efficiency and capabilities of your business analysts.
To this end, we’ll illuminate how analytics automation can improve or eliminate legacy data-process issues and enable the gains described above. Analytics automation focuses on a human-centered approach to data, analysis, and insights. In this article, we will see how it makes the data flow process easier to understand and work with, enabling data and analytics democratization. We’ll examine how data flow automation reduces labor-intensive tasks, saving time and effort. We’ll also uncover how analytics automation can provide continuous and easily maintained insights to employees and leadership. Through all of these transformational capabilities, we’ll see how analytics automation helps to create an agile organization that can better serve its customers and clients while improving financial success.
The Critical Role of Data in Modern Organizations
We all know that data is important, but why is data so important to your business? Properly analyzed data transforms into information and actionable insights, which can be used for more effective decision making. It can tell you how your business is performing. It can highlight patterns and hidden trends, identify positive and negative influences, give insights on what steps to take in the future, and optimize the best choice among competing decisions. It is the lifeblood of decision making, and without it, you are simply guessing or relying on intuition. A report in the Harvard Business Review cited an executive survey that indicated 70% of organizations with developed analytics reported improvements in productivity, financial performance, reduced risk, and better decision making.1
But if information is so important, why is it so difficult, expensive, and time-consuming to extract it from data? To understand this, we need to understand how data travels through an organization to be transformed into information and insights, ultimately to be used to make better business decisions.
After all, if your business is not reacting and changing as a result of analytics, what is the point in having them?
The first place to examine is the data collection. It might be simple enough to look at an organization and guess at where its data comes from. Stores generate sales data. Schools generate student data. Hospitals generate patient data. People and equipment generate data all the time with their connected devices. But this is just scratching the surface. Transactional systems within an organization do not and cannot operate alone. Let’s take a closer look at a manufacturing example.
A typical company producing a product or service has two major goals: meet customer demands and decrease costs. Meeting customer demand focuses on being able to create as many end products as possible for delivery without creating more than are needed. This means finding the appropriate number of machines, staff, and working hours to meet the demands of your customers while still maintaining a revenue stream higher than the cost. But to truly understand the interwoven complexities of your business, you have to examine all the variables. Some costs are tangible, while others are not. This is where analytic insights can help you quickly identify inefficiencies, allowing for data-driven decision making and improving performance within the business.
Let’s dive a bit deeper into this example. As a leader in a manufacturing company, you generate profit by selling your product to consumers or other businesses. You probably have several metrics on whom to sell to, for how much, and at what price. You may also have insights into how your product or service is being used. While analytics can always be improved in these aspects, let’s look at the other side of the coin—the costs. What is costing your company money? Are you spending too much on materials? Are the materials in or out of spec? Is there a better vendor to purchase from? Do you have the best employees in each position? Do they have the knowledge they need to improve performance in their jobs? There are many places where data can be accessed to improve the business, as noted in Figure 1. Let’s examine this further.

Figure 1. Examining how production data alone is not enough to fully evaluate a manufacturing firm
Imagine what would happen if your organization looked beyond just the manufacturing execution system (MES), enterprise resource planning (ERP), and customer relationship management (CRM) data related to creating your product. There are many places you could use data to reduce costs, optimize processes, and improve efficiency. Is your production line running through the night? How many extra employees and how much additional electricity and water are required to run during these off times? Should the manufacturing environment be adjusted based on weather conditions? Is this extra cost being covered by how much is produced? Is your equipment breaking down unexpectedly? To get these answers, you need to combine your financial data with HR, equipment, facility, and utility costs over time. You need to be able to compare production returns by the hour. Can your business do this now?
What about your supply chain? How do you keep current on resource vendor pricing and values? How much money can you save by switching vendors? The materials may cost less, but you may pay more for shipping. For sensitive materials, how do the specifications compare between suppliers? You need supplier data, materials data, and shipping information for all of your potential suppliers, and you need to be able to combine this data quickly and regularly to make a comparison. This data is valuable to you as a leader, but imagine what it could enable your front-line employees to do. Could your purchasing director utilize quick insights from these data sets? Imagine he or she is making critical and timely data-driven purchasing decisions. What if they could do that themselves without a data analyst or advanced analytics knowledge? How much might your company save? What about other parts of your company?
This idea doesn’t just apply to purchasing, of course, but to every functional area of your organization. Employees, finance, utilities, equipment, users, shipping, and much more all generate data, and that data is vital to making the business successful. To understand the business as a whole, the individual data silos cannot stand alone. The data from each functional area must be combined to give an overall picture of the entire business. The ability to tie transactional and unstructured data together, as well as with relevant external data, is invaluable. Most importantly, the faster this data translates into decision-making insights, the faster your company can react and improve performance. Let’s examine a typical data-to-insights workflow within an organization to help us better understand the challenges and impacts to business.
Challenges with Traditional Methods
So, what steps do you take to gather all of the data your organization creates and needs? How do you pull from transactional systems, record-keeping, external sources, and other places to get a complete and holistic view of your business? Is there data available and beneficial to your company that is not being used? In most organizations, a process called “extract, transform, and load,” or ETL, is used. In general, an ETL system will gather data from production systems on a scheduled basis. It will then take that data and transform it to be easier to read and use. Finally, it will store the data to a central repository, such as a data warehouse, where it can be used by other systems—including reporting and dashboard tools. ETL is an effective way to combine disparate data sources in a centralized area, but what are some of the pitfalls and drawbacks to using it?
Businesses collect huge amounts of data from multiple sources, as depicted in the transactional system segments on the left side of Figure 2. Generally speaking, an ETL tool will not be able to collect all of your data. There are simply too many sources in too many places for those maintaining the data to keep up with. So an organization will typically gather the key functional data sets and rely on other methods, such as data prep, analytics, or reporting software, to blend in additional data. This leaves the data warehouse potentially lacking in data that may be vital to the success of the business. This is especially true of data unrelated to the business process but relevant for analytics, such as geospatial, demographic, firmographic, and reference data.

Figure 2. An example of data flowing through a typical organization from transactional systems to reporting and insight generation
It’s not just missing data that can be a potential issue with a traditional process. Existing data and analytics software require specialized, trained employees familiar with the programming language involved. The process of pulling and transforming data can be complicated and time-consuming. There are obstacles to overcome, such as writing SQL code to access the data, complex calculations to prepare and clean the data, and a knowledge of statistics and predictive analytics to transform the data into insights. This is usually time-consuming, and the code is often rigid and hard to change. The code generated to pull the data is written specifically for the needs at that time, but data can change. As processes evolve or new software or methodology is introduced into a business, the tables, fields, and data will change with them. It takes continuous work from the subject-matter experts, data architects, report writers, and more to keep the analytic pipeline accurate and reliable.
Data standards and governance are also of vital importance. Imagine a company that sells electronics. There is likely data on sales and profit, of course, but there is also data on inventory management, shipping, returns, and more. Now, the software used in each of these areas can be (and most likely is) different. Names of products may differ between the systems. One system, like shipping, may aggregate data on a pallet level where another may track items piece by piece. Getting these systems to talk to one another and use common data definitions is often a huge challenge. The large amount in combination with the complexity of data being generated in business today is quickly outpacing the original infrastructure used to analyze it.
We’ve examined the typical methodologies of retrieving data within an organization, highlighting inefficiencies in the process. We need to find a solution that accesses and prepares data while providing the flexibility, speed, and ease of use to connect to other potential data sources, dynamically adjust to ever-changing business requirements, and promote data democratization within the organization. This is where analytics automation comes into play.
How Analytics Automation Improves Business Outcomes
What is analytics automation, and how is it different from what you’re currently using? Just like typical ETL processes, analytics automation software can connect to multiple sources and types of data, then perform blends, joins, filters, sorts, cleansing, aggregations, and more. ETL stops at this level, whereas analytics automation continues to build on this functionality with analysis, reporting, forecasting, predictive analytics, and more. In fact, analytics automation provides a single platform that can connect to, prepare, blend, enrich, analyze, and transform data into insights with data science and machine learning, as shown in Figure 3.
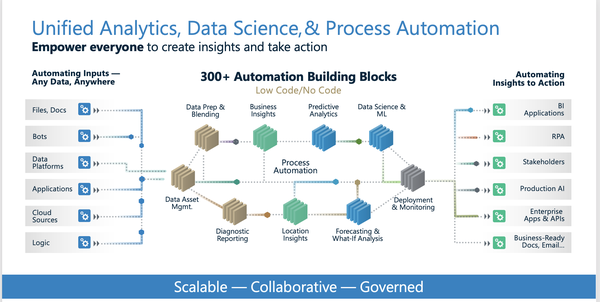
Figure 3. Alteryx-provided model of the steps and capabilities built into an analytics automation platform
Reusable Workflows Unlock the Information Value of Insights
Many data and analytic processes are code-based, but analytics automation doesn’t work this way. In fact, it is the human-centered approach that underlies the benefit of analytics automation. Unlike other software, analytics automation relies on analytic workflows, which are a series of steps that transform data into insights. Once a workflow is built, the results can be fed into other workflows. This creates a reusable, repeatable set of analytic processes allowing for organizations to accelerate their analytic initiatives by avoiding time-consuming rebuilds of existing analytic processes.
The primary steps needed to get the correct data together can be performed by business experts, and capabilities such as data prep, analytics, and predictive analytics can be made available for others to manipulate the generated results. This ensures that the data being investigated is accurate while allowing flexibility for deeper analysis. Executives can now ask questions, and the employees closest to the data can use or build upon existing workflows to get a quick and accurate answer. Better still, workflows can be shared and made available to everyone throughout the organization once they are vetted. This means that accurate insights can be accessed by anyone on demand with little training, while ensuring that the organization’s best practices are being followed. This shortened path from data to analytic insights improves decision making by increasing data accessibility, specificity, flexibility, and speed.
Data collected by a company lacks intrinsic business value. It is not until the data is translated, organized, and manipulated into actionable information that business decisions can be made. The impact of delays is represented in Figure 4. A delay in insights, however small, could be the difference between making money and losing it.

Figure 4. Information value of insights decays over time
Automation decreases time lost, allowing leaders to make effective decisions sooner after the data is created. This nimbleness enables companies to quickly adjust to sudden fluctuations in processes or performance, as seen in Figure 5. It allows a company to adapt the business and shift resources accordingly to things that are working well and respond to those that are failing. It also pivots the company toward predictive insights rather than reactive ones.2

Figure 5. Value captured by reducing business event to action cycle
Speed is twofold in analytics automation platforms. To start with, analytics automation cuts down on the number of tools and the amount of expertise needed to get from source data to insights. A typical data worker will, on average, connect to six different data sources, pull and process forty million rows of data, and produce seven unique outputs when performing one single analytic or data science activity.3 In addition, they will incorporate four to seven different tools to accomplish these tasks. Analytics automation simplifies these actions by providing the ability to connect to multiple sources, the ability to pull and process millions of rows of data in an easily managed and repeatable manner, and the ability to generate multiple types of results. It does all these things in a single end-to-end platform, simplifying the learning curve and reducing the need for additional tool-specific training.
Next, analytics automation is automated. While the initial build of any data or analytic process requires time, analytics automation is designed with reusable building-block capabilities. It allows end users to build on existing validated workflows to generate new insights, and modifying existing workflows can be done without searching through lines and lines of code. A single tool eliminates the friction between the data workflow steps. Automated processes can be built to search, prepare, and analyze data, saving large amounts of valuable expert time. A 2019 survey by IDC indicated that these types of tasks cost analysts around 16 hours a week.4 That’s 40% of a week that could otherwise be used to provide valuable insights on how to improve your business.
Analytics automation doesn’t need to supplant your existing software. It is the perfect complement to existing software tools. It can access data from ETL-generated data warehouses and produce analytic-ready data sets that can be used by reporting and other applications.
Any centralized system will only go so far to address your specific business need. You have a problem to solve now and cannot wait for IT. Analytics automation is often thought of as the last mile of analytics.
When you start utilizing analytics automation in your business, work with it along with existing technology and methodologies. As time passes, evaluate where you can employ analytics automation to improve existing processes. Integrate it into your work and analytic processes. Where can it speed up insight production? Where can it answer questions quickly that currently take a long time? In time, the value of analytics automation will become apparent through time-saving, automation, and ease of use.
Empower Business Users with Code-Free Visual Workflows
Analytics automation translates the steps of the data-to-insight process into a visual workflow with icons on a canvas, with each step further modifying the resulting data set. This graphical user interface is incredibly beneficial to your business. First, it is easier to understand and decipher than code. This means that any leader or employee can interface with data without a background in coding languages. Access to data analysis means that the decision making can move to the users closest to the business, empowering them with the insights to work more efficiently and effectively. This ease of use also makes it simpler to adopt and distribute analytics automation throughout your organization.
The experts in the data also benefit from analytics automation. They can generate workflows that perform business-specific tasks such as sales and use tax compliance, demand forecasting, fraud detection, capital budgeting, and auditing—and then save them for others to use. This ensures that best practices are built-in when future analysis is done. It also enables business domain experts to interact with the data and explore on their own. Your data experts can also easily visualize the data preparation process and make quick changes, something that could take hours or days to do in a traditional code-based system. An example of a graphical user interface is shown in Figure 6.
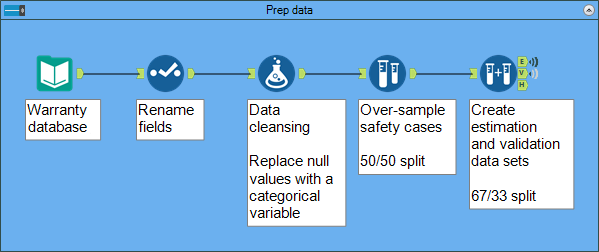
Figure 6. Example of an analytics automation interface—Alteryx
Once an analytics automation process is built, the pipeline can be scheduled to run on demand or automated to run at a specific date, time, and frequency. The graphical user interface has dozens of building blocks that allow you to:
Access and blend multiple types of data—both structured and unstructured
Prepare data by imputing missing values, removing outliers, and removing redundant variables
Enrich data by combining it with other data sets both internal and external to your organization
Blend your data together regardless of the file type or database structure in which it resides
Structure the data for analytics
Once the data is ready, you can then:
Apply descriptive analytics to understand what happened
Perform diagnostic analytics to identify trends and patterns and why something happened
Use predictive analytics to look ahead, plan for future changes, and understand what is likely to happen
Apply prescriptive analytics to recommend a specific course of action
Analytics automation also provides opportunities to look beyond the functional data of your company to allow for:
Geospatial analysis—building maps, graphs, and statistics on geo-referenced data to make complex spatial relationships understandable
Text analytics—exploring written data to discern themes and sentiment
Data science—applying statistics and algorithms to extract insights from noisy, structured, and unstructured data
Machine learning and AI—using machine algorithms to comb through data to identify patterns that might otherwise be missed
Optimization and simulation—using your own data to improve the business and business processes through examination of “what if” scenarios
The step-by-step process creation allows users to view the analysis output at each step, enabling them to easily visualize how the data is being transformed and analyzed by the process. The workflow can update, clean, and combine the data, correcting errors and adjusting data types. Take, for example, a CSV data source. By default, the values in a CSV file are all strings. You can quickly review the data in an analytics automation building block and change the data type accordingly, making dates into dates, numbers into numbers, and so on. Like many tools, the underlying data sources are not modified, only the resulting output of the analytics pipeline. This means that a process can be automated to run again and again against several data sources—on premises and in the cloud. If something in the source system changes, you can quickly adjust the workflow to account for the change. This is a significant time-and-effort improvement versus asking IT to update their ETL flow and waiting six to nine months for it to happen!
As mentioned, the visual interface eliminates the need to understand code, democratizing access and analysis. This is also beneficial to your company in two other ways. First, it decreases the need for employees who specialize in understanding specific programming techniques. While developers will always be needed to maintain data structures within an organization, the ability to analyze data without knowing how to write code gives the power of analytics to everyone throughout the organization. Second, the ease of use of a graphical interface saves time. Developers no longer have to spend hours or days refining context, joins, and filters, nor do they need to know how to create predictive analytic and ML (machine learning) algorithms. Instead, they can focus on utilizing the analytics automation building blocks to piece together a workflow that solves specific business problems—like predictive maintenance. Analytics automation employs techniques from common data analytic tools as well. By implementing techniques found in other common data and analytic tools, an analytics automation platform can provide resources that are familiar and easy to use. For example, users can use common spreadsheet methods for manipulating data.
The main feature of analytics automation is giving the ability to analyze data to those without programming knowledge. Macromill Inc. took advantage of this usability in its work.5 Prior to the implementation of an analytics automation platform, analysts were required to load survey data into statistical software. The resulting output was then transitioned into a reporting tool where report writers generated the visualizations. This setup relied heavily on the technical expertise of analysts to correctly interpret and process the data through the statistical tools. The complexity of the survey data and the slowness of the statistical software often created delays in the analysis, resulting in slow turnaround time for Macromill’s customers.
The company development group manager decided to try implementing an analytics automation process. He hoped that translating the existing data process into an analytics automation workflow would improve performance and reduce employee training needs. The implementation was very successful. Macromill no longer needed separate tools to clean up and analyze the data. Instead, workflows were developed that did the steps automatically. If a customer changed requirements, the workflow could easily be modified and run again. More importantly, the application the company chose was easy to use and reduced the need for employee training. Now there were more users available to analyze survey data and generate results. The faster turnaround time for analysis led to more time for data visualization, faster results for the customer, and repeatable processes for analysis.
Analyzing Data No Matter Where It’s Stored
Ease of use is only one benefit of the analytic process. The ability to connect to disparate data sources across multiple IT environments in a single interface is also key. Normally, an organization would need separate applications to combine and blend data into new sets. Analytics automation building blocks do this through the visual drag-and-drop interface. They can connect to local files such as Excel, CSV, or Access. They can also connect to hosted data sets such as MySQL, Oracle, PostgreSQL, or Salesforce, as well as cloud sources within Amazon, Microsoft, and Snowflake. An analytics automation application can access and analyze data on premises, in the cloud, and in hybrid environments. The ability to combine different data types opens up possibilities to examine how parts of your company interact and impact each other. This is best illustrated in an example.
A quick-service café franchise well known for its smoothies wanted to dig deeper than just its sales data.6 It wanted to know what things impacted sales, asking questions such as “Is weather related to sales?”, “Do certain flavors have better success in one region over another?”, and “Which marketing plan is most successful during down times?” These types of questions relied on point-of-sale data, of course, but they also needed weather, location, traffic, calendar dates, and promotion data. They even brought in information about their menu layouts! It was suspected that these external factors played a role in the success of the business, and the company wanted a way to analyze and compare this external data to its sales to look for patterns.
Imagine the amount of work and effort that would be required to tie all these data sets together using another platform. Analytics automation, combined with Amazon Web Services and Tableau, made it simple. Analytics automation allowed the company to connect to multiple data sources, identify relationships, and build workflows to answer its critical business questions. The company brought in over three years of historical data and used analytics automation to transform it. The workflows were then automated to run on new data coming in each day. The company was able to establish rules for the six hundred new data sets it receives at the end of each day, tailoring the data flow to only run once 95% of the results are available.
In the end, the company used the results of 15 different workflows together to generate a super workflow. This super workflow generates and updates the data sources needed to populate local self-service reporting tools and company-wide dashboards. It is a central source of truth for all insights related to the company and a complete solution with minimal IT infrastructure. The super workflow also gave the company insights on market trends, identified business inefficiencies, and provided a start toward establishing a data-driven culture.
Another example of combining multiple data sources was demonstrated by Coca-Cola, which used analytics automation building blocks to combine data sets across the organization, making them more accessible.7 In an example from Coca-Cola’s senior business analytics manager, data from multiple, separate bottling data sets was combined and processed in just a few hours. Prior to implementing an analytics automation platform, the analysis was nearly impossible, as the size of the data sets prohibited the use of traditional tools. It is also worth noting that this analysis was done without writing any code and without any experience in the analytics automation platform.
It’s important to know that data doesn’t have to be sourced from files or databases with analytics automation. The building blocks allow you to manually enter data into tables for use in the cleanup process. This may sound like it opens a door for potential errors or data manipulation; however, there are several beneficial uses. First, it can be used to clean up data that has typos or errors (although fixing the issue at the source is a better idea!). Second, it allows you to create bridge tables, small tables of data that can be used to connect or clarify other data sets brought into the workflow. Third, it provides a method to validate a workflow process by allowing you to create a smaller data set to test with as opposed to running a data set of millions of rows.
The ability to connect to and blend together a plethora of data sources gives analytics automation flexibility that is not available in a conventional data flow. The diversity of data types and formats it can connect to gives your company the ability to reach beyond your standard data sets and explore how other factors influence your success. It brings these data sets together in an easy-to-use interface with a multitude of options to clean, prepare, and dissect them. This is not the limit of analytics automation, however. Once the data is collected, it must be analyzed to derive the insights your company needs to be successful.
Accelerating Insights with Automation
The ability to quickly transform data into insights is a key element within analytics automation and a huge benefit to your company. As with data preparation, analytics moves through analytics automation as part of a visual workflow. The analytic steps can home in on key performance indicators within the organization, allowing your business to identify patterns, trends, and outliers quickly. It can perform analytic processes independently or in cooperation with other analytic tools, making it powerful and flexible at the same time. Most importantly, the insight-generating workflows can be saved and repeated as often as needed to provide data-driven monitoring and insights on demand. It also allows workflows to be shared, reused, and governed by the organization to ensure that best practices are adhered to.
Analytics automation also improves the speed of analysis in other ways. The ability to sample data through multiple techniques enables your organization to quickly examine trends and patterns without processing an entire data set. The building-block structure of the software allows you to stop at any point in a workflow, giving you the ability to assess the functionality of the workflow as you go. As mentioned earlier, one workflow can become the basis of other workflows, ensuring that the analysis is done on accurate, governed, reliable data.
At the same time, analytics automation contains the ability to future-proof itself. As your business grows or your software changes, the analytic workflow adapts to include additional columns of information. This means less work rebuilding and reconfiguring your data processes and more time investigating the new field’s impact on your data. This can significantly reduce time spent on development and waiting on coders. This option can usually be enabled or disabled, depending on the analysis and the data set.
All of these processing steps are visible in how the Salvation Army used analytics automation to consolidate, deduplicate, and organize its HR information for Australia.8 Its test lead was tasked with collecting multiple different data sets from Excel to hard copy and combining them into a single source of truth to load into a new software application. Using the features of the analytics automation platform, he was able to join, deduplicate, and clean up multiple data sets. He used repeatable automated data migrations through the analytics automation platform to combine over ten thousand worker records, saving thousands of hours of manual labor.
It is very likely that the Salvation Army analytics team relied on sorted data to validate its workflows. Even though analytics automation output does not necessarily need to be sorted, doing so will arrange the preview results in order, which helps with examining the data, validation, and workflow testing. Some analytics automation platforms can ignore special characters and values as well, allowing you to sort by the value in the fields and ignoring spaces, quotation marks, and punctuation.
After the data has been transformed with the workflow, it needs a place to go. Analytics automation includes options for easy ways to export data. These options typically include delimited text files, spreadsheets, other systems, bots, RPA (robotics process automation) platforms, databases, and many other target systems.
Workflow output is not limited to flat files, either. Analytics automation can be integrated into existing tools and reporting capabilities. By delivering workflow output to other systems, organizations can leverage automation to deliver monitoring systems, regular updated reports, and dynamic processes based on data. In simpler terms, workflows can be designed to alert you when thresholds are met or crossed, provide a regular data source for business processes, generate updated reports to decision makers, and many other automated tasks. In the end, an analytics automation platform enables you to separate the signal from the noise so your business can focus on the relevant insights in a timely manner.
Precision Analytics Group relied on this ability to ingest updated data as part of its processes to publish real-time data on COVID-19.9 It was tasked with providing insights on the pandemic and its impact on hunger, health, education, and housing. These insights would prove to be invaluable to aid organizations struggling to identify areas that needed support. While the US Census Bureau provided large amounts of data to analyze, it was usually hosted in separate files, contained disparate information and areas with missing and caveated data, and was changed on a regular basis. Precision Analytics needed a tool to automate the data retrieval without having to manually manipulate it with each request.
The company turned toward analytics automation for help, using the tool’s ability to combine data, clean data, and break it down into usable chunks. Once all the data was collected and organized, the resulting output was fed back into another workflow. This workflow combined the data with that from previous weeks and enabled the organization to present results based on numerous demographics. More importantly, logic was added to the workflows that allowed the team to break down the data provided by the Census Bureau based on the filenames on the hosted site.
As illustrated in Figure 7, this is an extreme example of an analytics automation workflow, but it highlights the capabilities of the software. This company took disparate data sources that had changing names and used an analytics automation workflow to account for the changes. This example also illustrates how something that would have taken hours or days to do manually can run repeatedly in an extremely short period of time using analytics automation. Repeatability and ease of use combined with complex data handling can take a massively complex task and break it down to a series of simple, easy-to-understand steps. Equally important is that the software lets you review the data after each step to quickly visualize the impact of the change.

Figure 7. Example workflow from Precision Analytics Group, detailing its methods for extracting data from diverse, regularly updated Census Bureau data sets
Democratizing Insight Generation
Making something available to everyone is often referred to as democratization, and democratizing data is incredibly valuable to a business. Having data in the hands of your employees empowers them to analyze their specific tasks and performance. It brings the data from a distant report to something much closer to those doing the actual work. It provides flexibility, repeatability, knowledge sharing, and data literacy to your business. Let’s take a look at how analytics automation differs from a typical workflow and examine how it improves the data to insight process for a business.
Limited Data Access Equals Limited Results
To understand why democratization is important, we need to first understand what issues arise from our employees being unable to access data and insights about their jobs. It is estimated that 44% of data workers’ time is wasted on searching, preparing, and analyzing data.10 Furthermore, five hundred thousand days of managers’ time every year are wasted on ineffective decision making at a typical Fortune 500 company.11 We need to examine a typical analytic workflow and see where the data comes from, who has access to it, and what constraints might exist with deploying that data broadly. Let’s return to our earlier example of an electronics company.
Let’s assume that the organization uses traditional ETL processing methodology. Data is ingested from the areas most vital to the company, such as sales, shipping, and maybe HR. There are several developers devoted to writing code that accesses this transactional data, modifies it, and stores it in a data warehouse. The company is adept with data best practices and provides data dictionaries, standards, and definitions to apply. It also employs a core team of data analysts to ingest the data and generate reports for the company. So what’s the problem with this?
To start, let’s look at access. While the data analysts and the developers may be excellent at their jobs, their entire focus is on the flow of data. The developers are heads-down buried in code and code changes and likely have limited knowledge about how the company operates. Likewise, the analysts probably have some basic knowledge of business methodologies, but their expertise lies in using report building tools to generate visualizations for the company to digest. They rely on the subject-matter expertise within the business to determine which data tables and fields are important and what needs to be reported on.
Access to the data is likely limited to the report writers and a few key stakeholders in each specific area. The report writers focus on generating reports for the leadership, showing the performance of the company, while the area-specific experts use the small subsection of data available to them to make decisions on how their portion of the company performs. The problem with this limited access is twofold. First, employees who are making the company run—from sales to stock to inventory management—likely do not have access to the data the company generates. Second, many of those who do have access to the data lack the subject-matter expertise or the analytic tool expertise to properly analyze it.
In addition to access, speed is an issue in a traditional data workflow. If leadership has a question about the business, or if the environment around the business is changing, they need to see the impacts as quickly as possible; however, the traditional method is full of delay. First, the question being asked may or may not be answerable with the data available from the transactional systems. If necessary data points are missing, this may require updates and changes to the ETL—a process that could take several days to complete. Next, the report writers need time to ingest the data, analyze it, and develop visualizations that provide the answers to the questions being posed. They also need time to communicate with subject-matter experts to validate and confirm the data. In short, from when the question is asked to when it can be answered could be many days apart! Is the answer even valuable anymore once that much time has passed?
The typical data flow process only provides data to small sections of employees:
Those with deep knowledge of the business but limited knowledge of analytic tools
Those with strong skills in analytics and analytic tool usage but only limited knowledge on how the business works
Additionally, the typical data flow is filled with delays and inefficiencies, providing unhelpful and even detrimental insights to leadership at all levels of the organization. How do we improve this access, and what benefits might appear by distributing data beyond just those with the expertise? How do we bridge the gap between subject-matter expertise and data analytic capabilities? The answer to these two questions is what makes analytics automation so powerful.
Upskill Employees to Accelerate Insights
Analytics automation improves access to data, but why would you want to do this? What about the security and privacy of your company’s data? It’s not as scary as it sounds. Empowering your employees to utilize data is a beneficial step in making your business analytically driven. It takes the guesswork out of running the business at the lowest level and provides the subject-matter experts and frontline workers the tools they need to make decisions where and when they need to be made. This simple shift could save your company time and money by eliminating issues before they have a chance to take hold.
Perhaps the best way to understand how data democratization positively influences a business is to look at an example of where it has been successful. When you think about analytics automation and data in manufacturing, you probably think about reducing supplier costs, increasing efficiency, and reducing expenses. Polaris used it in an entirely different way.12 Instead of focusing on increasing the performance and innovation of its products, Polaris wanted to understand what things it could do to improve the safety of its products for its customers.
Polaris, which manufactures snowmobiles and off-road vehicles, wanted to know what types of safety problems its customers were experiencing and how it could improve product quality to avoid these issues. Typically, this sort of troubleshooting falls on a technical services team, but Polaris wanted to use data, specifically, warranty claims. The idea was that warranty claims would contain large amounts of quantitative and qualitative data, which could be examined to identify potential trends and problems.
Polaris turned to its data and post-sales surveillance teams for help. Together, the teams utilized analytics automation to analyze the data. They pored through warranty claim data, tying it to predictive models and dealer-updated information. Using analytics automation to process the data and analytic modules to run predictive models, the teams were able to create an algorithm that would flag warranty claims for potential defect or safety issues that needed to be addressed. They then automated the process and tied it to the company’s email system. Now, each warranty claim that comes in is processed through the workflow and analyzed for patterns. If one is found, an email goes to the safety team within the organization to further examines. The end result was an increase in safety-related claims being quickly identified and addressed by the manufacturer.
Take a moment to think about this Polaris example. The company was successful by tying data together and delivering it to the employees who had the ability to interpret, analyze, and act on the results. In a traditional system, this would likely have been impossible. Their post-sales surveillance team would have needed to manually comb through large quantities of email for patterns and trends. That alone could have taken days or weeks to complete and, all the while, additional claims would continue to pour in. By implementing analytics automation technology, the team can now dynamically ingest these claims and quickly provide preemptive solutions. The company not only improved the safety and reliability of its product, but by giving data to the right employees, it saved hours and hours of manual time and effort.
Let’s look at another example of providing data manipulation skills to employees to solve problems. The Hong Kong Polytechnic University Institutional Research and Planning Office needed a way to analyze all portions of the university without the technical background in coding.13 The university is filled with data following HR, students, finances, and more. How could it examine all these layers of data without the technical know-how? More importantly, once a method was found, how could the planning office ensure that the processes developed using this method would be translatable to new employees and easily modifiable if university processes changed?
Two of the office’s research analysts took the task head on. Their goal was to provide data and insights to university leadership around all aspects of the university to aid in decision making. Until recently, they relied on error-prone manual processes to gather, examine, and analyze the data. The data was mostly housed in Excel and Access files that numbered in the hundreds. The method was slow, tedious, and time-consuming. They turned to analytics automation for assistance.
Analytics automation provided several key advantages to the team. First, it was easy to use. They didn’t need a computer science or data science background to extract the necessary data and collect it for analysis. Second, it provided a streamlined method to organize and aggregate the extensive list of files containing student, HR, and financial data. Third, it was repeatable and traceable. The workflows enabled the research analysts to not only break down their analytic process into digestible modules but also provide transparency on the processes they performed. This made it easy to identify and correct issues when they occurred. Analytics automation also provided the ability to create and run predictive analytics on their data, giving them the capability to provide projections and insights on incoming applications, admissions, and matriculations.
The end results were workflows designed to handle the process of providing analytically fueled insights on a regular basis to university leadership covering all aspects of university operations. The jobs could be run easily and quickly and were simple enough to understand and hand off as new employees joined the team. The time saved by switching to automated processes can now be put to use doing additional analysis, and, since the process is repeatable, the team is much more confident of its results.
We’ve seen a couple of examples of how employees at the transactional level can utilize data to improve their companies, but let’s take a generalized look at the possible benefits you might see in your own company. What benefits might a data-driven workforce provide? How can you upskill your employees to utilize data? Let’s return to our computer parts sales organization and see how it might benefit from this aspect of analytics automation.
As mentioned before, the analytics automation platform is a low-code/no-code user interface, where users can easily drag and drop tools from the palette to the canvas. This means that the manipulation of data within the organization is done in a workflow-based set of building blocks. How does this help your employees? Well, first, it takes some of the complex code-based methodology and turns it into an icon. A user with some basic knowledge of the data can easily drag a filter building block into a workflow to limit data in a data set. There is no need to understand SQL code or how to write algorithms (e.g., regressions, decision trees, neural networks) that can extract insight from data. Second, the ability of employees to build their own analysis eliminates dependence on your technical analysts’ time and availability. Subject-matter experts can make a pull when and where they need it. Third, it provides the ability to save workflows and create reusable templates, which allows employees to share data manipulation techniques and results with colleagues.
Analytics automation also opens up the ability to tie into systems that might otherwise not have data exposed. Suppose our imaginary company has a transactional system for tracking visits to the store against purchases made. This system may be store-specific and not have data pulled for company-wide use. With analytics automation, the manager or employees at the store level can tie that visit data into the sales data for the store. It helps them pull information on how many people might be coming in to do something other than make a purchase (such as price comparison or making a return).
We mentioned a real-life example of this earlier with the quick-service café franchise well known for its smoothies. That company incorporated regional data such as weather and location information to understand how it impacted the sales. This data isn’t integrated into a company-wide database, but rather is specific to the store or stores in a specific region. This enables data insights and decisions to be made at a local level to improve sales and doesn’t involve waiting on data analysts, ETL code-based processes, or central reporting to complete.
This example as well as many others illustrates the benefits of delivering data to a more granular level of your organization. But delivering data is only part of the process. Data needs to be analyzed and interpreted to become an insight. Let’s next look at data reporting to see how traditional methods and analytics automation compare.
AI and Analytics for Business
Data needs to be transformed into information and insights. How does this happen? How do we turn millions or billions of rows and thousands of columns of data into something that is easy to understand and interpret—something where the insights jump out at you?
Traditional Analytics and Reporting
Report writers have the monumental task of sorting through all of our data—and transforming it into something that is easily understandable. They need to be able to identify the data that is relevant to them, and this is not an easy task. As mentioned before, report writers and analysts lack the in-depth knowledge of the business while the business experts lack the resources and skills to do analysis and report generation. This creates a delay in the production of meaningful insights for the business. Additionally, questions related to the data change based on the time, person, or team asking them. In other words, it’s contextual.
Let’s look at your own business as an example. Your business probably needs to report headcounts. Your HR department wants each person only counted once, and counts distinct employee IDs, regardless of where they work. Another area of your business (such as IT) may focus on physical resource allocation and realize that some employees work in two different jobs. They count and split the individuals evenly between departments, depending on where the employee needs computers and equipment. Your finance department may be interested in the impact each employee has on costs, and it counts employees based on their effort in each department.
All three departments may be correct in how they count employees for their task, but the end result is three different headcount reports. The point is, one report is usually not sufficient, as it is not contextualized to the user who needs the information. How do you take the collected data and make it available and beneficial to the needs of each of these departments? How long would it take each department to develop the reports it needs to accomplish its tasks? Many companies face similar challenges, which can be further complicated if the organization has multiple locations, multiple products or services, or multiple levels of reporting requirements.
This leads us to the next question: how do I find insights if I don’t know where to look? This has long been a struggle for analysts, especially as the volume and variety of data has grown. To fill this void, many organizations turn to data scientists. These data experts apply extensive statistical and computer science knowledge to identify patterns, trends, and outliers in data, then combine these elements with probability to determine what might impact the company in the future. They employ predictive analytic and ML techniques to perform the analysis and generate insights and predictions; however, this process is complicated and time-consuming.
Data scientists use statistical coding languages, such as R, Python, and Julia, to tackle the complexity and depth of their work and enable them to analyze data more quickly and thoroughly; however, the analysis still requires them to understand the data and how the business works to identify the appropriate insights. Stop for a moment and think of your own organization. Imagine how much data you generate in everyday business. Now think of how long it would take the average analyst, with even basic knowledge of your business, to dissect and extract insights from all that data. It’s nearly impossible.
Even with specialized software tools, human input is needed to identify the patterns and insights most relevant to the business. This is especially important when identifying the key performance indicators and patterns relevant to the business. The human aspect involves weeding out information that may be irrelevant or insignificant. While an insight may be valid and identified correctly in the data, the user needs to understand that some outliers and patterns are important, and some are not.
Like many of the tools mentioned above, there are issues with these types of software. For one, not many of these tools incorporate all the processes involved in analytics, which is not just another tool, but rather a collection of software titles that requires funding, technical expertise and support, deployment, and maintenance. It requires some level of human interaction with understanding of business-related processes and standards. These software programs are also potentially another place where data is stored and must be maintained. This requires data security, accessibility, and integrity. If the data is not maintained in this additional system, the value of the tool begins to wane.
Improving Insights with End-to-End Capability
We’ve established that analytics automation improves workflows by democratizing insights through ease of use and upskilling. The ultimate goal is to get the insights needed from any process and make decisions based on the results. The best person to correctly analyze a process is one that is directly involved with how that process functions. That is, you want your subject-matter experts analyzing the data, as they are the most familiar with how that particular process functions. The question is how do you get that data and ability to analyze into the hands of a user who is trained in your business process, not data analytics?
Simplifying the analytic and insight generation process requires building blocks that are able to recreate the functionality of specialized software without the need for specialized code. Analytics automation needs to be able to take on the process tasks that report writers and analysts perform, but it needs to be simple enough for anyone to use. These are the functions that an analytics automation application needs to be able to perform:
- Artificial intelligence
-
Utilize iterative processes and intelligent algorithms to dig through large amounts of data to identify patterns or outliers that might otherwise go unnoticed.
- Data access
-
Access dozens of different types of data sources, allowing users to pull and connect information from multiple places.
- Data preparation
-
Provide options for managing missing values and formatting issues while also handling special characters, white space, and capitalization irregularities.
- Data exploration
-
Include option to quickly view output to better understand the data content, quality, and results.
- Data enrichment
-
Combine data from your company with common public data sets, such as census data and geospatial data, to provide insights beyond your company into things such as demographics, buying habits, and transportation efficiency.
- Data cataloging
-
Provide a centralized repository that combines data sets and analytic workflows, which can be searched to quickly find data relevant to your business, making it easier to track your data assets and establish governance and standards to unify your organization.
- Reporting
-
Provide multiple methods for returning results, both visually and in crosstabs, and the ability to generate dynamic reports at any point within a workflow.
- Data science and machine learning
-
Allow for simple model building and deep analysis of data to ensure that the predictive models generated by all of your data workers (not just data scientists) will be easy to interpret and reliable.
- Other tools
-
Other abilities, from machine learning to text mining, in an easy-to-use format that allows anyone in your organization to perform their own data analysis.
Analytics automation simplifies the process for insight generation. By providing an intuitive, easy-to-use, graphical user interface, it provides a method for business users to transform data into insights. It also provides methods for analysts to develop workflows and building blocks that can be used by others to automate business processes. Your employees don’t need to understand the methodology for pulling, cleaning, and joining data in the tool if your analysts tackle that part of the process for them. Instead, your employees can focus on using the tool to ingest data or build insights relevant to their specific needs. To clarify this point, let’s look at an example.
Coca-Cola used analytics automation to handle the complexity of multiple vendors with multiple needs while also developing reports on a company-wide level.14 As with many businesses and organizations, it had been relying on software that was developed several years earlier. This was an older, Excel-based solution that provided individual location data for each of the subgroups underneath the main umbrella organization. Unfortunately, the system was starting to get overburdened and hadn’t been updated in several years. The company needed a way to gather all of the data from multiple retail locations and consolidate the format and content for centralized reporting. It also needed a way to break down this data to provide location-specific reporting to the store owners.
The analytics manager needed to organize the structure the data in such a way that he could use Tableau to create fast-responding visualizations. He turned to analytics automation for help, using the cleansing and consolidating tools to gather both company-based and customer-based data into one workflow. The support team from analytics automation provider Alteryx helped to develop and evolve the workflow to generate his data set. The end result was exported into a Tableau hyper file, from which he could generate easy-to-use, interactive, dynamic reports.
In the end, the use of analytics automation spread from his team to the organization’s finance, operations, and marketing teams. He highlighted some of the benefits of analytics automation as part of a presentation he did on his success:
It eliminated reliance on third-party vendors and consultants to gather and analyze data.
It reduced the lead time for reporting by over a month and is able to produce reports quarterly instead of semi-annually.
It removed memory-intensive Excel files from the process and replaced them with a fluid, responsive, dynamic dashboard.
It eliminated the need for the manager to upload and print reports; he could instead refresh a Tableau extract in a matter of seconds.
The implementation saved the company an estimated 60% on the reporting process.
This highlights an additional benefit of analytics automation: it does not have to function independently from other data tools. As mentioned when discussing data pulls, analytics automation software has the ability to connect to a wide variety of data sources; however, it also has the ability to work symbiotically with reporting and analytic tools. As mentioned in the Coca-Cola example, analytics automation tools are able to digest data and return it in reporting friendly formats such as Tableau’s hyper file. This means that while analytics automation is capable of doing many things related to data, it does not have to function independently, and it will integrate well with existing reporting platforms.
HCA Healthcare had a similar problem that it solved with analytics automation.15 HCA is an organization of 185 hospitals across 19 states with over 30 million patient encounters each year. The strategic analytics team wanted to provide operational and financial reporting to its leadership, but with such a huge organization with leadership at varying levels, it was challenging to deliver reports at the right level. Leadership at the highest level wanted overarching analysis of the entire organization, while functional managers were focused on the specific areas they maintained. Additionally, the strategic analytics team wanted to provide local analytics teams with tools to validate and improve local reporting.
As with many of our previous examples, the biggest challenge was the multitude of platforms and systems providing data. The data was in several forms, from Oracle to Salesforce to Teradata, and HCA needed to find a way to bring this data together. Again, analytics automation was the solution to the multitude of data sets, the large volumes of data, and the levels of reporting the team needed to provide. The team was able to create workflows that functionally tied the data together and aggregated it to the level of reporting: one workflow for upper management, one for functional managers, and one for local analytics teams.
The end result for HCA Healthcare was the ability to automatically deliver data insights to all three levels in the organization. HCA’s associate vice president of analytics identified the ease of use and format as being critical to reaching all three audiences. Some recipients of the data wanted to see the numbers and nothing more, while others yearned to click into the details. The analytics automation software was able to generate results at a level where both needs could be met. The need to bring insights to management on all levels with varying levels of expertise and technical abilities was accomplished using the workflows of analytics automation.
The examples provided above highlight how analytics automation can be used in different ways. Both organizations utilized analytics automation to accomplish their goals, resulting in a better understanding of how their organization was run through data-driven insights and repeatable processes within analytics automation. The insights provided are inspiring other areas within each organization to consider the power of analytics automation as well. This grassroots spread of data usage throughout their organizations is common in many stories of analytics automation implementation and an excellent way to test the functionality and capabilities of a data automation process. Analytics automation also helped them quickly identify relevant information for their business to help them make effective decisions.
Bringing Analytics to Everyone
Imagine a retail store looking toward the future. If the store can analyze historical data of successes and failures to uncover patterns within the data, it can effectively determine the right dates to offer promotions, what to price its products at, and whom to market to. Predictive analytics gives leaders and employees the knowledge they need to make the best decisions based on known data.
Analytics automation takes all of the complicated processes of analysis and makes them accessible. The built-in capabilities of analytics automation allow a business user to not only quickly grab data but also analyze it by connecting different building blocks together using a drag-and-drop interface. Since the interface is visual and not code-based, users no longer need the extensive knowledge of specialized software or coding to run analysis.
Utilizing historical data and analysis can provide insight on additional dimensions to analyze, key performance indicators to track, and methods to improve business success. Analytics automation takes this analytic process and transfers it from data analysts to any end user. Combined with the algorithms of machine learning, insights can be focused on key indicators and built upon.
Take, for example, agriculture. If the machine learning software recognizes there is a correlation between the fertilizers used and the crops planted, it may remember that and offer it as a potential insight in the future when others query the data. It may also take that correlation and compare it to other dimensions of the data such as the crop, weather, location, and temperature to search for additional relationships. By utilizing this automated investigation, farmers gain insights on when to plant, what to plant, and where to plant it to get the best yields. It can also control equipment and fertilizer spread to optimize plant growth and health.16 The farmer does not need to understand statistics or know how to write code. Analytics automation provides an easier interface to unlocking these insights.
Analytics automation also encompasses text analytics and natural language processing. As mentioned above, the data coming out of the transactional systems and being reported on is process specific. Natural language processing translates that data into something that sounds more like regular conversation than a query. Instead of searching for a sum of profit divided by a sum of sales, the end user can just ask the question “What is my profit ratio?” Most of these tools can both generate natural language and respond to a natural language query. That is, they can use other data source options to generate synonyms for keywords and catalog the variations of words. They can then dissect written questions into the key components needed to produce an answer.
Stratasys, a manufacturer of three-dimensional printers and production systems, utilized analytics automation to communicate with its corporate partners.17 In recent years, the demand for three-dimensionally printed products has grown exponentially and so have the number of providers. Stratasys needed a way to dig through volumes of data from various sources and platforms to gain insights on the performance of the company as a whole. Until they discovered analytics automation, analysts were forced to pull from Salesforce, Excel files, and Oracle to gather all the information from pre- and post-sales transactional data. They manually combined the data and analyzed it in a final Excel file or PowerPoint presentation. The process took days to run and required additional time to address issues with regional and partner data.
The self-service and multiple-source capabilities of analytics automation caught the attention of the Stratasys analysts. The tool had the ability to not only combine the multitude of data sets but also account for regional vendors, address data errors, and process results automatically. The team could use its capabilities to dissect the data from pre- and post-sales, corporate partners, and other sources to create a cohesive source of information from which to build reports. They tied the results in to Tableau, which they used to generate information and insights for their leadership. As a result, a report that used to require 5 hours to run, now took only 30 minutes.
The benefits of analytics automation didn’t end with simplifying the data workflow for the analytics team. Since its implementation, Stratasys has been able to make several gains in efficiency and communications by generating granular reports and insights for its corporate partners. The company has also used analytics automation to provide data to marketing and resellers to improve campaign success. Process mapping and documentation have also improved, as the process is now point and click instead of complex, multi-level Excel file maintenance.
Analytics automation is also having an impact on health care. The impact of data and insights in the medical world cannot be overstated: the correct use of data can mean the difference between life and death. As much of the health care system has been around a long time, data and analytics within the industry have aged with it, with many places relying on antiquated systems and methodologies. Let’s see how one organization used analytics automation to bring data, analytics, and reporting to the next level.
Two large health care systems came together under an umbrella organization called SCL Health. With an influx of new clinics, patients, physicians, and staff, new challenges arose surrounding not only the people but also the stock and vendor management needed to keep valuable medical supplies on the shelf. In the next year, a team was created with the sole purpose of answering important questions about supplying the new organization, with a focus on inventory management and vendor relationships.18
Initially, the organization relied heavily on Excel spreadsheets. It generated large sets of data and simple visualizations into a single sheet, which was then emailed to the supply team leadership. This was incredibly ineffective and inefficient. The insights were not useful or interesting, and the time required to generate the reports was prohibitive. SCL needed another solution—a way to bring the data to the users who needed it and give them the ability to dig down to the granular level needed for their specific unit. In short, it needed to bring the data to the people.
The team was introduced to analytics automation during its introductory meeting and went to work developing workflows to meet the needs of the organization. The first step was to consolidate the data sources, combining inventory, purchasing, contracts, and more. From there, the team developed additional workflows to correct errors and update data with dynamic pricing for the items they used. Once the data was stabilized, they used the output to generate Tableau dashboards with multiple levels of interactivity, enabling end users to dig into the data and compare invoices to purchase orders.
The end results speak for themselves. The organization was able to eliminate unnecessary software subscriptions, reduce incorrect vendor usage, and reduce discrepancies. In total, it has cut hundreds of thousands of dollars in waste annually. The ability of analytics automation to bring data to the people has provided the organization a resource for cost cutting and cost savings. In addition, the success of the software has expanded its scope. The company now uses the tool for prime medical and surgical distribution conversion, backorder management, and product recall management.
Faster Analytics and Better Decisions
As we’ve seen, analytics automation is being used to overcome the technical challenges of wide-ranging and large volume sets of data. It simplifies analysis, reporting, and insight delivery through automation. These changes save time, effort, and money. More importantly, the ease of use and automation also makes it possible for many of these companies to allow more people within the organization to transform data into insights.
The analytic building blocks are also extremely deep in functionality. They include capabilities like data parsing, grouping, modeling, and forecasting. More importantly, with the ability to connect to multiple data types and incorporate integrated data resources, users can examine the business spatially and tie it to common data sets like census data. Let’s look at how some organizations are using these capabilities.
A management consulting firm specializing in the life sciences industry provides consulting to other companies, and in this example, it utilized analytics automation to examine and analyze health care distribution.19 The firm wanted to understand health care distribution across regions within the US to optimize productivity based on workload and potential sales. In short, it wanted to take health care and drug utilization data and tie it to geography to determine how to best allocate staff. This example is unique, because the underlying data being used is not generated by the company itself but instead is a combination of spatial data and drug utilization data provided by the government. It consists of data from about 12 billion health care claims tied together with geographic and demographic population data.
So what did the firm do, and how did it use this data to generate insights? The analytics automation user combined two workflows to make their system effective. The first combined the data mentioned above and was run a few times a year to keep up to date. The second workflow took Excel-based input containing information on drug types, health care services, and workforce and workload desires from a user and processed it using the statistical language R to create regional optimization for workload (see Figure 8). The complete analysis ran in a day as opposed to months. It also saved the organization money by eliminating the need for a third-party vendor to complete the analysis.
Another company, Altab Solutions, actually consults in using analytics automation. It provides training, implementation, proofs of concept, and more. Altab has used Alteryx to help its clients in a way similar to the life sciences management consulting firm mentioned above, but instead of analyzing where to distribute staff and resources, Altab Solutions’ client wanted help deciding where to place a health care center. What areas have a demand for services, and what type of services did they need?

Figure 8. Example healthcare data analysis represented by map output from a management consulting firm specializing in the life sciences industry
Because Altab Solutions focused on assisting with health care facility placement, it needed to know not only the demand for certain health care services in the area, but also what types of services were actually required. It focused on allergy and orthopedics in one area to begin with, but the scope quickly grew to a multitude of health care specialties in a large number of areas. Data was in many places, covering existing patient visits, population demographics, and spatial analysis. The company needed to combine it all together to get the insights it desired, and analytics automation provided those capabilities.
As the scope grew, Altab needed to design workflows that were fluid and dynamic. End users needed to be able to choose areas on a map using a graphical interface or address, and then be able to quickly determine if the medical need or needs selected were in demand in the area. They also needed to align demographic populations to the area around the location. Rural health centers would need to cover a larger area to incorporate the same number of patients as a smaller area in an urban setting. Altab Solutions incorporated several plugin spatial tools with analytics automation, such as Guzzler Drivetime Methodology, to provide an endpoint solution that allowed its client to quickly gather insights on locations, demand for health care services, and opportunities for new growth.
While these two examples are similar to the previous one, it is easy to extrapolate how these techniques could apply to other services such as fire services, police, and even commercial business placement. What areas are at higher risk for crime or fires? What exists currently for these services? Or what businesses exist in the area that provide a service similar to the one I hope to open? What will my competition be, and how much demand is there for the service or product I provide within this area? It’s easy to see how a data-driven approach could assist many types of businesses and industries.
Predictive Analytics and Data Enrichment
The power of analytics is not in reporting how things went, but rather using the results combined with probability to predict how things might go. Analytics also does not need to be limited to the data generated by the organization. External data can be added to provide additional insights related to geography, demographics, and population. Analytics automation takes this a step further with the workflow diagram. Since the process is embedded in a visual workflow, analysts make modifications throughout the flow to understand what variables impact the business. They can then identify key factors in business success and what steps to take to avoid pitfalls.
Our examples until now have only focused on how companies use analytics automation to dig into data specific to their organization; however, analytics automation also includes data sets that can be used to enrich a company’s internal data and are beneficial to analysis. These are things like geospatial, firmographic, demographic, and census data. The possibilities available to a business expand as more data is brought in to combine with the functional data of the company. Let’s look at how a couple of businesses have used these capabilities to make business decisions.
Close Brothers used the predictive capabilities of analytics automation to identify potential client loss. Close Brothers is a banking group in the UK, focusing primarily on lending, saving, and wealth management support.20 Its goal wasn’t a broad marketing campaign to draw in users from outside the business, but rather a campaign targeted more at existing users who exhibit a potential to leave the bank. The bank wanted to identify these users and take additional steps to encourage their loyalty.
The first step was to identify which clients were most likely to leave and why. To do this, the bank created a set of marketing campaigns offering multiple levels of offers to appeal to existing customers. Data from the campaign was gathered and compared against the customer list to see who had not taken advantage of one of the offers and had a current deal due to expire. The bank didn’t want to hit all its users like this, but only those that met certain criteria, so all the campaign data was combined with information on the clients, covering over 30 different variables. Analytics automation provided the tools needed to not only combine the data sets but also to run predictive analytics on the results to find the probability of a customer departing.
After developing a workflow and generating results, the team had created a tool that could identify potential client loss with 80–90% accuracy. The team identified several key victories from the analysis, including improved conversion rates and higher deal amounts. With regards to analytics automation, they identified the ease of use and simplicity of updating as key in the reusability of the tool.
MeshPower, a nonprofit organization in Rwanda that worked in cooperation with Javelin Group and Alteryx for Good.21 The challenge was to provide power to Rwanda’s rural population not covered by the country’s existing power grid. To do this, MeshPower would install solar cells and batteries in central locations in the smaller villages, powering homes, schools, businesses, and clinics. The question was which village should they start in, and where in the village should they place the panels and battery?
The groups worked together to identify answers to several key questions around the number of new households, businesses, and infrastructure buildings receiving power as a result of an installation. In the end, they determined the best way to gather data about where to install nodes was to do a trial. They installed in numerous locations across Rwanda and combined the data from these locations with existing census metrics and the spatial capabilities of analytics automation.
The result was a baseline and predictive model that MeshPower could use to quickly identify potential installation locations that would be most beneficial. It was tied with an application design that allows the organization to quickly test parameters against the results. The output was a report detailing the prospective grid, the impact, and the distance covered. This illustrates the flexibility and ease of use of analytics automation in an application based on improving life for those in need.
Process Monitoring and Immediate Insights
The speed and ability of analytics automation software to connect to many types of data has already been illustrated, but there is a nested benefit, too: the ability to monitor systems close to real time. How many processes in your organization run every day under the eyes of your employees? Do they have tools or systems designed to help them monitor these systems? What happens if something goes wrong? Providing employees with the necessary resources to monitor and engage in your business process is vital in avoiding potential financial loss or downtime. Analytics automation’s fast speed and usability is beneficial in providing data-driven monitoring to your employees.
Analytic flows can be organized to track data in production systems to watch for negative patterns or trends. The monitoring tools run workflows against the transactional systems on a regular basis. If the result of the workflow meets certain criteria, an alert message is sent. Near-real-time monitoring can prevent disasters or catch opportunities for a business. Let’s see some examples of where this has been put into practice.
Caisse d’Epargne bank used analytics automation in entirely different ways. It is a French bank offering traditional savings and checking accounts to its customers.22 Due to the age of the bank, at one time there were over two hundred companies and subsidiaries under the umbrella of the central bank name. In time, these smaller subsidiaries merged into larger ones, consolidating to just 15 smaller groups under the overall whole. This merging caused a great deal of turmoil as largely separate groups with different methodologies and tools were suddenly thrust together and challenged to unify their systems.
One of the biggest challenges facing some of these newly merged groups was how to incentivize their employees. How do you reward employees that acquire a large number of new accounts without punishing those that lose a customer? Additionally, some of the employees worked in regular bank operations, while others worked in the private banking sector. In total, they had 35 different job titles with 90 different indicators to analyze! All of these variables and possibilities made developing a fair incentive system challenging.
The team responsible for the new system needed a way to look at large amounts of data around customer retention tied to employee performance and involvement. They turned to analytics automation. At first, the team attempted to develop one massive workflow to determine the incentive plan that best suited each employee, but it quickly realized that the massive workflow suffered from the butterfly effect. A tiny change early in the process could create massive differences in the end results. The team realized it needed to break the workflow into smaller parts. Analytics automation made this simple to do.
Within analytics automation, workflows can be fed into other workflows. This capability enabled the team to focus on smaller chunks of data and cleanup instead of trying to do everything at once. In the end, the gigantic workflow became several smaller workflows:
One to clean up the incentive data and narrow down the huge data sets to a single data set with only job, objective, and indicator
One to reduce the list of employees provided from the HR department down to just a line per employee per job per place
One to pull data from the transactional data marts to analyze the performance of employees against key performance indicators
One to combine the steps of the previous three
One to clean up the end results and validate
One final workflow to regroup the split data
The end result was a series of workflows that quickly and accurately analyzed employee performance to provide an appropriate incentive level. The team utilized analytics automation to develop a methodology that opened communications with HR and streamlined processes. The multiple small parts made it easy to not only identify errors or issues with the data, but also to quickly find, repair, or adjust a workflow to address them. Additionally, the workflows were easily repeatable and simplified an otherwise complex process, saving the bank time, money, and effort.
Caisse d’Epargne needed the power of analytics automation for another project as well.23 This time, the use case revolved around employee placement rather than performance. Simply put, the bank needed a way to align employee proximity and job experience to populate branch offices with the appropriate people. Could it find employees with the right skills who lived close enough to fill all the necessary positions at a branch location? Let’s see how the data project manager approached the issue.
To understand how analytics automation helped the success of the project, we need to step back and examine what the process was before. To begin with, HR used Google maps together with Excel spreadsheets of information on employees to determine the best place to assign each person. This was not only time-consuming but filled with errors. They needed something that could combine the data sets with spatial analysis and easily navigate the data to find the right person for the appropriate position.
Analytics automation helped make this task much simpler. The analysts used the geospatial abilities built into the analytics platform to map out not only the position of the branches but also the addresses of the employees. When combined, these two pieces of data could analyze drive time for employees based on the branch they needed to go to. Next, they determined the available employees within a given distance capable of filling a position opened within a specific branch. Finally, the analytics team coded a user interface in the analytics automation reporting tools that allowed HR to designate a location and a skillset, and then return a map and data about all nearby employees capable of filling that role. An example of this output is available in Figure 9, which shows bank locations and the employee most qualified and most closely located to fill the associated role.

Figure 9. Example output used by Caisse d’Epargne to help HR identify nearby employees capable of filling open roles within a branch
The end result was the relocation of 350 employees in only six months! Transferred employees were matched to the job and positioned closer to their residence, reducing their commute time and increasing employee satisfaction. The new method saved time internally as well, reducing the time to relocate one person from 3 hours to only 10 minutes. This saved the bank 1,700 hours of labor per year!
The city of Tallahassee used the monitoring capabilities of analytics automation to monitor for water leaks within the homes of its customers.24 This didn’t mean that the city installed a pressure monitoring system or technology within each home; it simply used data. Each month, data is returned on the amount of water consumed by each customer. Prior to the implementation of analytics automation, the analysts for the city relied on six-hundred-page tables of data generated in PDF. They had to manually scour the pages looking for variations in usage each month.
With analytics automation, they were able to automate the process. First, the city utilized analytics automation to improve the assessment of water mains and hydrants in an area prior to scheduled road resurfacing. By examining the work orders for an area, they could quickly determine the state of the water infrastructure and repair it while the road was being repaired. Second, the city increased awareness of grant offerings and opportunities through the its redevelopment agency. Tallahassee approached the challenge by developing maps in other spatial tools such as Tableau and ArcGIS, but eventually settled on analytics automation due to its ability to provide flexibility, ease of use, and dynamic results. Now, instead of humans searching through the data, thresholds were applied to the usage. If a customer exceeds the threshold, an email alert is automatically generated and sent to the customer to schedule an inspection for a possible leak!
Benefits of an Analytics Automation Strategy
What is the benefit of getting insights into your subject-matter experts’ hands? Let’s look at an example from a service desk. In this case, the analytics automation company relied on its own tool to better support its help desk staff.25 Alteryx is a software company specializing in an analytics automation platform. Like most IT organizations, it struggled with getting fast and accurate resolutions to its end users. The reason was that existing solutions were buried in knowledge-based and community-based articles. Help desk staff were forced to search through several locations to acquire the necessary information. What could be done to improve response time and accuracy?
In the end, Alteryx turned to its own tool. A workflow was developed in the analytics automation software to gather information about the ticket and use that information to search resources for potential solutions, as seen in Figure 10. This data could then be quickly dissected and combined with information from the caller, providing not only an accurate diagnosis of the issue but also a selected set of proposed solutions for the technician. This significantly improved help desk performance and response times. Support tickets that usually took hours to complete now took only a couple of minutes. It also provided the technician a method to analyze customers’ environments without burdening callers with collecting information themselves.

Figure 10. Simplified workflow diagram from Alteryx help desk example
Another form of speed is time saving. Think of how many data-related processes exist in your organization. How many of them are repeated exactly the same way each week, month, quarter, or year? This is where the automation inherent in analytics automation comes into play. If the tasks for generating regular reports rarely shift, workflows can be developed to run the task automatically. This is beneficial in several ways. First, instead of remembering the process, recoding the process, and rerunning the process, analysts simply have to open the old workflow and run it again. Also, because the process is saved in a workflow, if someone leaves the company or the regular owner of the report is unavailable, another person can run it. There is no need to worry whether the correct steps are being performed, as the steps should be part of an existing workflow. The task can be run repeatedly by different users without worrying about missing a step or accidentally changing the result.
Beyond speed, analytics automation can provide ways to improve revenue within a business. We’ve already looked at the cost savings of using a single tool over multiple job-specific platforms, but let’s look at saving costs as part of a business process. Analytics automation enables you not only to create reports, but also to produce predictive and augmented analytics. The ability to process trends and outliers dynamically gives quick insights on the direction a company is taking and the likely outcome. Multiple data sources can be combined to improve accuracy and reliability.
Predictive analytics save money by predicting what is likely to happen in the future. Take OnePlus Systems, for example.26 Its business is providing resources to retailers, manufacturers, hospitals, and hotels to better manage operating efficiency. The success of OnePlus Systems is entirely dependent on maintaining a strong returning customer base. There is a ton of effort and time involved in recruiting new customers; however, it’s not nearly as much work to keep the ones you have. So how did OnePlus utilize analytics automation to do predictive analysis, and how did it save the company money?
When you look at a company’s customer base, you will find loyal, die-hard customers, and you will find some who may not be as interested in keeping the company as their service provider. OnePlus Systems realized this and developed a solution that evaluated its work process from deployment to business understanding. The company took this, as well as data from its historical successes and failures, and ran predictive analysis against it. The analytics automation software enabled the company to develop multiple scenarios and models against the data. The results of the scenarios were compared against existing data to determine which predictive model best represented OnePlus’s clients.
In the end, OnePlus was able to determine which of its customers were a flight risk and which were loyal. Those that were loyal received minimal communications, such as an email; however, those that were more likely to leave were identified and reached out to on a personal level, such as with a phone call. The ability to separate the two groups of customers allowed OnePlus Systems to customize its approach and reduce costs by shifting resources based on the predictive model’s outcome. Additionally, this model is now saved and available again during the next renewal period. Even if changes occur, the analysts only need to update the steps in the data flow versus rewriting the whole procedure.
Analytics automation can also cut down on employee resources. Since a collection of tools is integrated into a single platform with a common interface, you only need to train experts in one or two applications. You don’t need multiple experts in each of the fields of data extraction, preparation, reporting, statistical analysis, etc. This creates an environment where users can perform multiple steps of a workflow and combine workflows to create customized outcomes. There will still need to be technical expertise to create specialized workflows and processes, but if built correctly, the workflows will provide a basis from which anyone can access the data.
Another example of how analytics automation can make data accessible to anyone comes from one of the world’s largest accounting and consulting firms. This company is an organization of audit, tax, and advisory firms, which deals with huge amounts of data from all types of systems such as SAP, Oracle, and Excel. It’s challenge was finding a tool that anyone in the organization could use to do analysis. Employees needed to have the skill sets required to analyze large amounts of data quickly and accurately. In short, the company needed its employees to be accountants, not IT specialists in data software.
To solve the problem, the company turned to analytics automation. The software created opportunities for streamlining the processes and simplifying the analysis. First, the company developed workflows to combine, cleanse, structure, and aggregate data for use in its specific tax software. The workflows are easily adjustable and usable by anyone in the company as well as usable with any of the potential data set types they may encounter. As a result, the analysts are spending their time focusing on doing analysis and finding insights for clients instead of connecting to, copying, cleaning, and combining data from their customers.
Accessible, Reusable, and Repeatable Insights
Data democratization is simpler in analytics automation applications as well. By using analytic workflows, processing information can be broken down into smaller segments, which can then be combined and shared in various ways. These building blocks, built by subject-matter experts and analysts, lock down the nuances and focus the data into targeted, accurate results. Once the results are verified, they can be shared and used with built-in filters, sorts, and more to grant basic end users the ability to view the data and get insights specific to their roles.
Additionally, analytics automation systems can be used closer to transactional systems. This means that data is being analyzed closer to real time. This not only gives a wealth of information to the teams doing the business but also allows for bot-based monitoring. Analytics automation systems can include logic to run workflows and generate results or alerts based on certain criteria being met. If a system approaches a critical point of failure, the analytics automation system can identify the potential issue and warn the business before there are negative consequences. More importantly, as businesses grow and requirements change, these monitoring data flows can be quickly adapted to the change.
Cargill uses this proximity of insight to transactional systems in tracking downtime within its manufacturing plants.27 Prior to analytics automation implementation, Cargill relied on an analyst to copy data from each of its separate servers in each of its plant locations. The data analyst would log in to each server, copy the downtime data, and append it to an Excel spreadsheet. The company has 19 plants in operation, and this task took 80-plus hours a month to complete!
With the implementation of analytics automation, things changed dramatically. The analyst wrote an automated workflow to access each of the servers and gather the data. From there, it is saved as an analytics automation file that can then be fed into a number of other workflows. These workflows are translated into Power BI reports that are accessible to the individual plants. Most importantly, insights delivered to the plants are refreshed on an ongoing basis, in contrast to the monthly reports they used to receive. This benefits the plant end users, who rely on the data to identify issues and improve performance.
Analytics automation simplifies the technological process for getting data to insights. By replacing multiple lengthy steps in the data migration process, it takes data from a transaction resource, transforms it, and generates an outcome. These data flows can be large or small, complex or simple. They can take data from specific data sources inside the company or outside the company, or they can incorporate built-in resources. The goal is to take otherwise complex, dirty, and incomplete data and transform it into a complete set of thoughts and information from which to make decisions. What options are available in analytics automation once data has been cleaned up and configured? Outside of the workflow building tool, what resources are available for delivering data as a story?
Analytics automation platforms, like Alteryx, manipulate the data and organize it via small chunks of steps. These workflows take away the need for complex coding knowledge, instead replacing it with a graphical interface that analysts and others can use to gain insights. The workflows can also be collected, combined, and/or shared to give other users access to data they might otherwise be unaware of. Workflows don’t have to be entirely about analyzing the data, though. A large portion of what makes an analytics tool successful is the ability to display that analysis in a clean, easy-to-understand output, and these displays can be integrated into the workflow as well.
There are two parts to making data analysis results usable for others. The first is making a strong, cohesive result that can be quickly interpreted and understood in only a couple of minutes. For this, analytics automation software has steps that can be added to a workflow to transform the resulting data into a chart, an easy-to-read crosstab, or some other graphical representation. These steps are usually used in conjunction with an existing workflow that cleans and prepares the data. Once the process of preparation is done, the report designing steps get run. These generate the outputs of the workflow into several small pieces, which can then be combined into an overall dashboard.
Analysts can use these building blocks to generate dynamic reports and dashboards. They can use them to establish a dashboard of combined charts, telling a thorough story of what exists in the data, which can be shared with the community, leadership, or other stakeholders. By making the design process part of the workflow, the data gets pulled in and refreshed each time the flow is run, and with each flow run, the dashboard is updated as well.
The second part of making data analysis results usable is clearly defining the steps taken to generate the presented results. Analytics automation provides what many reporting tools lack in this respect. The end result of a workflow is a clear diagram indicating what steps were taken to get the data to the insights in their current state. An analyst need only click on each portion of the workflow to clearly see the steps taken and the resulting impact on the pulled data. This eases concerns over what processes the data went through and provides reassurance to end users that the steps taken accurately represent the business process being reported.
Let’s look at another example. The Hong Kong University of Science and Technology first discovered analytics automation through a trial license used by a systems analyst in its information systems office.28 He was looking for a way to simplify an expense allocation model built across 20–30 different Excel files containing over one million complex formulas. These files took expense reports from each department and manipulated them to create an output needed to meet the requirements of the University Grants Committee of Hong Kong. This was no small task and took up to 16 hours a month to run successfully.
The systems analyst discovered Alteryx and spent several days using the online training tools to learn the software. He then turned his attention to the complex web of Excel files to see if he could simplify the process. He took data from multiple sources, joining and unioning it in the tool. He then went about replicating the calculations and processes embedded in the Excel files. Through the course of a year, he slowly worked through the Excel files, using summary tools, appends, unions, and more. In the end, he was left with a complex workflow that cut 16 hours of work down to 1. He also had a tool with visual task outlines that was easy enough to understand that he was able to hand the entire workflow to his financial department. Without complex SQL or VBA scripting, the end user was now knowledgeable enough to make changes on the fly, and the systems analyst no longer needed to lose 16 hours a month generating the results.
This illustrates how something huge, complex, and time-consuming can be reduced to something fast and understandable even to end users. The process is repeatable and easily adjustable by business domain experts and nontechnical users. This is complemented by the fact that a huge complex system is broken down into smaller, more easily digestible parts. This is only the technical side of analytics automation, though. It shows how analytics automation generates time- and effort-saving results, but these results impact the business as whole.
A Community Devoted to Upskilling
Analytics automation platforms have a large and growing community of users drawn from all areas of business, education, government, health care, and other industries. By encouraging and fostering communities of support, software companies are changing the traditional model of technical support.
Traditionally, software support took a linear path. You would encounter a problem, submit a support ticket, wait some time, and then the company would respond with a solution. Sometimes this worked, but often you would need to send more information, or the provided solution didn’t work. The end result was a lengthy stretch of time going back and forth with the software company, trying to find an answer. Development of new features also came at a snail’s pace. Without insight into how or why users were using their products, it was often difficult for companies to determine which aspects of the software were working and which required additional features. On many occasions, support tickets were submitted for items that were not related to how to use the software but rather to how to solve specific business problems with the software. In other words, users had educational needs rather than issues with the software!
To help with education, the new model of support has arisen that relies on a community of peers. Instead of reaching out directly to the company for support, users can instead turn to a community chock full of insights and how-to resources. Forums have been developed where users can ask other users about problems and the steps needed to work around or solve them. Users can network with like-minded individuals on how to approach solving specific business problems. Within these online communities, there are realms of conversations, problems, and solutions generated in a searchable tag-based format. Often, that problem you are encountering has also been encountered by others. Now, there is an online location where you can reach out to these other users to find a solution.
These communities not only benefit users. Software companies can use these them to generate new ideas to improve and update their software. If enough users ask for a particular work-around or solution, a fix can be developed as part of the release cycle. Big software companies have started hosting gatherings where users can network with others in the same field to share ideas and connect. This support model has also opened up opportunities to provide training, showcase features, and advertise potentially synergistic software solutions.
Some communities, like that of Alteryx, have significant user bases with over 250,000 active members. A quarter of a million people! The Alteryx user community offers learning pathways by subject matter, such as predictive, geospatial, and advanced analytics; weekly challenges designed to increase skill levels for particular topics; snackable how-to videos; and certification courses. Depending on your learning preference, there is something for everyone. As you progress with your skill level, you can become an Alteryx ACE, which “recognizes analytics experts for their ongoing meaningful contributions to our global community.” These ACEs are celebrities within the Alteryx community.
The Costs and ROI
While analytics automation may not contain all the granular capabilities of a task-devoted software, it still provides a comprehensive location to perform many of the tasks these other vendors provide. As a result, organizations may look to analytics automation to replace or supplement existing data workflow software in an effort to save money or fund the analytics automation implementation. They may want to consider some other benefits of an analytics automation implementation as well. Let’s look at a few possible ways analytics automation could reduce costs and increase revenue for your organization.
One of the major players in the analytics automation arena is Alteryx. Using Alteryx, designers can develop workflows that pull in data from multiple sources and data types, manipulate the results, and translate the final data set into something useful, such as an exported data file or a visualization. While the costs of Alteryx are variable depending on the installation, the cost can be considerably lower when compared to other software needed to achieve similar capabilities.
Think about the suite of tools your company uses for processing data. Each of these tools is specifically designed for one or two data processing tasks. This specificity makes the tools leaders in what they do, but also increases the skill and training required to use them. Implementing and maintaining each of these tools requires experts, and these experts need to be familiar not only with the tools but with the data being run through them. Even then, process steps such as ETL maintenance can take hours of intensive focus and work. Look at Table 1 and think about the traditional tools your organization employs. Are there any you could replace or supplement with an analytics automation platform?
| Analytics automation | Traditional software tools needed to match capabilities |
|---|---|
|
|
We’ve been focusing on eliminating other software in your organization to make room for analytics automation, but it should be mentioned again that analytics automation doesn’t need to stand alone. If you already have an ETL tool, a data warehouse, or a reporting platform, analytics automation can be integrated to work with it. Take, for example, an organization that already has an ETL tool pulling data from transactional systems to a data warehouse. That works great with analytics automation, which can pull the data from the data warehouse and combine it with other data sets. As another example, the reporting software Tableau regularly hosts Alteryx at its conferences, highlighting the ability to combine and prepare data from multiple sources before reporting on it in Tableau.
There are several great examples of companies using analytics automation with other tools. The Salvation Army did this to generate clean data to populate HR data in Workday. PASHA Holding used analytics automation to streamline its reporting process for management and financial purposes. The output was translated into Tableau as well as a separate data warehouse.29 Adidas even used analytics automation to generate updates for its PowerPoint presentations to keep data up to date and accurate.30
But the cost of software is not the only place where your business might benefit. Analytics automation also provides savings from a human perspective. This is not because you can eliminate analysts or specialists by implementing the platform. Instead, you are taking the capabilities of all these other tools and making them accessible to everyone. Your HR team can analyze hiring, and your sales team can combine data from multiple stores. Your advertising team can predict the best sales to run and when. In short, you’re providing a transformation within your organization, which will empower all your employees by providing them an easy-to-use, accessible, and understandable resource for data collection, analysis, and insight gathering.
Your analysts will also benefit from using fewer tools and improved interfaces and performance. The efficiencies provided by analytics automation can cut the amount of resource time needed by your business analyst team to perform basic analytic tasks. IDC analyzed the benefits to business analysts when implementing analytics automation, and the results are staggering. Analytics automation cuts the average amount of time business analysts spend on labor-intensive tasks by a half to two-thirds, as shown in Table 2. Imagine what your own analyst team could do with this extra time.
| Tasks | Non-analytics automation effort required | Analytics automation effort required | Analytics automation efficiency return |
|---|---|---|---|
| Collecting and preparing data | 1,575 FTE | 870 FTE | 1.8x |
| Data analysis and reporting data | 2,420 FTE | 1,685 FTE | 1.4x |
| Operationalizing data | 1,119 FTE | 926 FTE | 1.2x |
a IDC - The Business Value of the Alteryx Analytic Process Automation Platform | |||
Your business might also see cost savings as part of normal operations. By taking advantage of the automation and ease of use of analytics automation, businesses can shift their perspectives from responsive to predictive. This gives decision makers valuable insights based on trends and patterns so they can make proactive decisions, rather than waiting to respond when things go wrong. By being agile and responsive to change, your company can leap at opportunities and dodge potential pitfalls.
In summary, there are many ways an analytics automation implementation can pay for itself. Task-specific software comes together to gather, analyze, and report on data, but it requires expertise, time, and additional effort to run data through to insights. Analytics automation collects these capabilities into a single, easy-to-use platform with automation capabilities. It makes data accessible and easy for end users to manipulate, empowering everyone in the organization to analyze and gather insights. Improved speed in generating insights means that decisions can be predictive rather than responsive. This not only keeps your company streamlined and agile but also enables you to better provide for your customers, employees, and company as a whole.
No-Risk Assessment of Analytics Automation
The first step is to try analytics automation out. Many companies offer a limited trial of their software. In many cases, the best step is to have some of your technical and subject-matter experts use the software and compare it to the processes currently in place. In addition, provide analytics automation software to your business experts. Can your analysts develop workflows that more quickly translate data into usable resources? Does the speed of your business improve, or can you find insights that otherwise might have been missed? Can your less technical employees use the drag-and-drop interface and interact with your data easily? Most importantly, does the software help bridge the gap between technical and business knowledge?
Once you have experimented with the trial, take a look at existing processes and determine where an analytics automation platform might fit. Does it allow end users to bring in additional data and generate insights? What about analytics? In some cases, you might find that an analytics automation platform provides a platform for generating data to be used in other tools. Maybe instead of researching a data processing tool in your reporting software, you can use analytics automation to do the work for you. Look at all the aspects of data processing that are key to your business and its success, such as ease of use, speed, and power. Where does analytics automation fit in that scheme?
There are multiple steps in a typical data path that analytics automation can support. Refer back to Table 1 and think about your business. It is likely that you are using several different tools to accomplish the tasks in this flow. In addition, you likely rely on technical experts to run many of these processes. What if you could shift that knowledge and give the power to the people closest to the data? How much time would you save? How much would the insights derived from analysis improve? Data analysts and technology experts are always going to be needed to support the software tools we use, but analytics automation makes it possible to eliminate some of that technical need.
Summary and Conclusions
We’ve examined the power of analytics automation through the lenses of technology, business, and real-world examples. We’ve seen how it can be used to tackle complex problems, increase productivity, and improve efficiency. But what does all of this mean to you in your business? What can you extrapolate from the descriptions, considerations, and examples that might be of use to you? Let’s take a moment and summarize what we have learned thus far.
Analytics Automaton Platforms Are Approachable
The interface to an analytics automation platform is graphical. Outside of calculations or macros, there is no coding needed. A simple interface draws out the step-by-step nature of each building block, allowing you to visualize and examine the impacts of transformations on the data. These building blocks make data easier to parse, easier to clean, and easier to examine. To see if a filter left the results you expected, you simply interact with the flow at that point to see how the data was altered as a result of that step. This means that another user can go into a workflow and quickly see and dissect the steps taken to reach the end result.
This also means that any user can access data, not just trained analysts. A graphical interface is intuitive and requires little training. What took years for analysts to learn how to code can now be taught in minutes to an average user via the interface. This means that data can now be delivered to the people that need it the most: the leadership, the local managers, and the employees doing the work. It removes a critical gap between the subject-matter experts and analytics technology professionals.
In addition to improving the analytic skills of your employees, improving governance, standards, security, performance, and accessibility of data also remain key. Your insights are only as good as the data and analysis they are built upon. Data governance and standards will help enforce data quality by employing common terminology and definitions, while speed will improve the ability to get insights quickly. Accessibility means that data will be open to everyone and not locked into the silo where it was created. This means safely sharing data between teams and understanding the impact each group in your organization has on the others.
Analytics automation also provides tools for analysts to build custom interfaces and methods of interactions for their customers. By providing an option for inputs and parameters, the analyst can customize the workflow for specific users or groups. This increases the value of the platform by bringing the layer of analysis closer to the topic area. HR can easily focus on personnel, while finance can examine the data from a monetary perspective.
Analytic workflows can also be used to automate business processes. Instead of relying on analysts to sift through pages of data, a workflow can be developed to monitor data values being generated by the business. Thresholds can be placed that trigger alerts if certain criteria are not met. The process can be simple, adaptable, and, most importantly, repeatable, either run on demand or on a schedule. This monitoring method relies on hard data and system integration to remove the need for manual tracking and processes, providing more time for employees to focus effort on higher-priority tasks.
Changing “That’s How We’ve Always Done It” Mentality
One of the largest challenges for any organization trying to introduce a new process is breaking the mentality of “that’s how we’ve always done it.” Employees get used to doing their jobs in certain ways, and any deviation from that methodology breaks their routine. Introducing new processes impacts their ability to do their work quickly and accurately, as it forces them to learn new techniques while maintaining their current work. So how do you convince people to change? How do you convince them that a tool could potentially improve their work, their performance, and their success?
The quickest method to increase adoption is from the ground up. A grassroots movement simply gives a few choice individuals access to the software. These people should be your tech-savvy users—those who love to play, experiment with technology, and try new things. If they can get a trial of the software and uncover the capabilities that apply to your business, they will become your advocates. The more they advocate, the more users will see the advantages and want to experiment with the tool themselves.
From there, leadership buy-in is the next step. Leaders are looking for value in a software purchase. It needs to improve employee performance or business performance or reduce costs. To be successful and interesting, the software must do something that existing tools in your organization don’t do, and it must do so in such a way that the cost of the product and its implementation is outweighed by the benefit it provides. Again, the best way to demonstrate this impact is to use the tool to redefine processes already existing in your organization. Show your leadership that even they can run data flows and discover insights on their own.
Once a few people start using analytics automation and discover its capabilities, word will spread. Analytics automation is not topic specific but can be used in any division within the organization. So, if your HR team starts using analytics automation building blocks to create accessible workflows and work-related insights, you can bet that word will spread to finance, production, management, and every other part of the organization. Demonstrating the value the tool provides is the best method for encouraging adoption from colleagues and leadership.
Analytics Automation Tackles Complex, Diverse Data
A common theme in many of our examples is the need to handle complex data, not just that generated within the organization, but external data as well. Analytics automation has the ability to combine data from multiple locations and multiple types into a single workflow. Organizations are no longer limited to the basic data they generate but instead have access to census, spatial, and other relevant data sets. This opens a world of new opportunities to examine the impacts of both external and internal factors on the success of the business.
This is tied together with the ability to handle large volumes of data. What took hours or days in Excel can be reduced to only minutes in analytics automation. The multiple features of the software enable a user to prepare and analyze data in a visual step-by-step manner. This reduces the chance for errors that often appear during manual data analysis processes. What’s more, the workflows developed to improve processes are repeatable. Once a process is developed, it can be shared and reused throughout the organization.
Workflows can also be concurrent, with each doing a separate process on the data. When a workflow gets too complicated or memory intensive, it can easily be split into smaller parts and joined together later. This increases the ease of data validation, error checking, and updating when required. When compared to traditional processes, analytics automation takes less time and effort to design and maintain while also being easier to partition, troubleshoot, and reuse. Less code and more reusability also mean fewer chances for mistakes and pitfalls to interrupt the flow of data in your organization.
In addition to data sets inside and outside an organization, analytics automation software includes integrated data sets. Detailed data sets for spatial analysis like cities, countries, states, and zip codes are available for use within the software. Analytics automation also supports add-ons and plugins designed to access other specific data sets and provide unique insights. These make analysis within analytics automation less complicated by providing easy-to-use integrated tools specific to your data challenge.
Analytics Automation Integrates with Existing Tools
Existing software platforms don’t need to be removed for an analytics automation implementation to be successful. Analytics automation interfaces with many different types of databases and flat files to bring multiple levels of analysis into a workflow. If your business has existing data sources, such as a cloud data warehouse or transactional data mart, analytics automation platforms are able to read from them. Unlike other data tools, the data from these individual systems can easily be combined, enabling analysts and end users to pull insights in ways they might not otherwise.
On the other side, workflows can combine, clean, and prepare data for use in other reporting tools. Many of the examples discussed above mention the use of analytics automation to generate data for Tableau. The software works together synergistically to create insights through rapid, repeatable data preparation and quality data visualization capabilities. While analytics automation has built-in visualization capabilities, it is also flexible enough to work with tools your company’s analysts are familiar with. This reduces training costs and provides styled visualization outcomes that others have seen before, know, and trust.
Data management isn’t all that works with analytics automation. Programming languages such as R and Python can be used as part of—or the recipient of—a data workflow. This integration allows for predictive analysis, statistical modeling, and forecasting with combinations of data sets throughout your organization. Imagine running analysis on sales numbers or production outcomes to monitor trending, plan for incidents, or establish a baseline for your business. Predictive analysis enables companies to strategize and plan in ways simple reporting cannot, taking multiple variables and influences into account while predicting likely outcomes.
Analytics Automation Is an Investment with Return Value
With every software purchase, there is an opportunity cost. What else could you have bought with the money you just spent on that software. The goal of good businesses is reducing that cost or eliminating it entirely. If there is no opportunity cost for the purchase of your software, then you can expect that you made the right decision. The opportunity cost of analytics automation is easy to dissect.
First, the cost of analytics automation software is comparable to most data tools on the market. However, what happens when you compare it to the cost of purchasing enough software to match the capabilities of analytics automation? Suddenly it’s easy to see how each separate tool in a traditional data flow quickly surpasses analytics automation in cost. As explained before, the cost of the platform is quickly recovered when compared to the cost of owning individual tools to do the same work. To add to this, it can be integrated into existing systems easily, allowing organizations to maintain existing business processes while determining the value of an analytics automation implementation.
Next, you have to reexamine the costs of doing business with an analytics automation implementation. Even if you are able to only integrate one workflow, how much work did that one workflow save? How many fewer hours are required because the workflow can easily be repeated? How much more time do your analysts have to spend on other higher-priority tasks? What about expertise? How much does your company pay workers who are skilled in SQL, analytic, or data science tools? By implementing analytics automation, that knowledge can be shifted to other more important things.
Again, you need to consider what your company gains from faster, more reliable insights. Does the cost of your supplier parts go down? Can you increase revenue by changing marketing or targeting specific buyers? Where else can your company improve through data analysis, automation, and employee data empowerment? To truly understand the cost of the software, you need to understand the savings it provides. Data analysis will help you make decisions to improve your business, but you have to decide the best way to do your data analysis. Figure 11 highlights examples of benefits achieved by different companies employing analytic process automation.

Figure 11. Benefits of analytics automation31
Variety of Capabilities, Cost of a Single Platform
Since analytics automation covers the entire spectrum of data, from analysis to insights, it is capable of many, many things. Regardless of the tools and techniques currently used in your business, analytics automation provides a comprehensive collection of all the steps of a data workflow in a user-friendly interface. This means that regardless of what is happening with data in your organization, analytics automation can be used to improve the flow. It can be integrated at any part of the data workflow and utilized in many different ways.
It provides an effective end-to-end platform that pulls data from one or many sources. It can then clean, filter, and transform the data to be used for analytics and data science. It can automate processes, reducing the time needed for complex analysis and workloads from hours or days to just minutes. With reporting, it can generate detailed visualizations or provide data sources specific to your reporting needs. It can run predictive analysis and machine learning on your data, providing reliable, data-driven insights to trends and patterns within your organization. All of these capabilities illustrate that the platform is flexible enough to provide impact regardless of what may be already in place.
Anywhere there is data, there is opportunity to improve by reducing costs, increasing income, or enhancing efficiency. We’ve examined how analytics automation can influence multiple types of industries as well as the divisions within them. It doesn’t matter what type of organization you run; data exists, and analytics automation is capable of digesting that data into insights and decisions.
It doesn’t matter what your data is about. What matters is the ability to dive into that data and pull out the insights that will give your company a leg up on others in the same market. It matters that your employees are happier because incentive plans are customized to them or job positions are closer to home, giving them more time with their families. It matters that villages have electrical power to improve the lives of their inhabitants and that crop yield will be better because seeds were planted in the right place with the right water and fertilizer levels. It matters because, without a tool that can quickly and accurately pull, analyze, and report results, data is only numbers. Analytics automation provides the missing piece to drive those numbers into decision-making and potentially life-changing insights.
1 Harvard Business Review, The Evolution of Decision Making: How Leading Organizations Are Adopting a Data-Driven Culture, 2012, https://hbr.org/resources/pdfs/tools/17568_HBR_SAS%20Report_webview.pdf.
2 Images drawn from Scott Burk, David Sweenor, and Gary Miner, It’s All Analytics, Part II: Designing an Integrated AI, Analytics, and Data Science Architecture for Your Organization (Boca Raton, FL: Routledge, 2022).
3 Chandal Gopal, Stewart Bond, Matthew Mardem, “IDC Data Preparation, Analytics and Science Survey Commissioned by Alteryx,” February 2019, https://www.alteryx.com/resources/report/idc-state-of-data-science-and-analytics.
4 Gopal, Bond, Mardem, “IDC Survey”.
5 Ryota Mori, “Macromill Accelerates Reporting with Alteryx,” Alteryx, January 14, 2020, https://community.alteryx.com/t5/Alteryx-Use-Cases/Macromill-Accelerates-Reporting-with-Alteryx/ta-p/513811.
6 Nelson Davis, “Transforming 4 Billion Rows of Data into Insights with Alteryx, AWS, and Tableau,” Alteryx, May 11, 2018, https://community.alteryx.com/t5/Alteryx-Use-Cases/Transforming-4-Billion-Rows-of-Data-into-Insights-with-Alteryx/ta-p/161798.
7 “Taste the Feeling: Coca-Cola + Alteryx,” Alteryx, accessed September 19, 2021, https://www.alteryx.com/customer-center/taste-the-feeling-coca-cola-alteryx.
8 “The Salvation Army Improves Data Migration Process by 5x with Alteryx,” Alteryx, accessed September 19, 2021, https://www.alteryx.com/customer-story/salvation-army-improves-data-migration-process-by-5x-with-alteryx.
9 David Gump, “Automatic Charting of Weekly Covid-19 Hunger Data from the Census Bureau,” Alteryx, July 29, 2020, https://community.alteryx.com/t5/Alteryx-Use-Cases/Automatic-Charting-of-Weekly-Covid-19-Hunger-Data-from-the/ta-p/609986.
10 Gopal, Bond, Mardem, “IDC Survey.”
11 Aaron De Smet, Gregor Jost, and Leigh Weiss, “Three Keys to Faster, Better Decisions,” McKinsey Quarterly, May 1, 2019, https://www.mckinsey.com/business-functions/organization/our-insights/three-keys-to-faster-better-decisions.
12 Jason Lahr, “Building the Safety Culture at Polaris,” Alteryx, April 30, 2019, https://community.alteryx.com/t5/Alteryx-Use-Cases/Building-the-Safety-Culture-at-Polaris/ta-p/408544.
13 Anson Wun and Amanda Li, “Solving Student Number Projections Work in 2 Minutes Using Alteryx,” Alteryx, December 2, 2019, https://community.alteryx.com/t5/Alteryx-Use-Cases/Solving-Student-Number-Projections-Work-in-2-Minutes-Using/ta-p/497570.
14 Jay Caplan, “Coca-Cola Reduces 60% Cost Using Alteryx to Build a Store Dashboard,” Alteryx, July 25, 2019, https://community.alteryx.com/t5/Alteryx-Use-Cases/Coca-Cola-Reduces-60-Cost-Using-Alteryx-to-Build-a-Store/ta-p/443300.
15 Ryan Richardson, “Connecting with your Audience on their Terms with Alteryx,” Alteryx, July 26, 2019, https://community.alteryx.com/t5/Alteryx-Use-Cases/Connecting-with-your-Audience-on-their-Terms-with-Alteryx/ta-p/444348
16 “Precision Ag,” North Dakota State University, accessed September 19, 2021, https://www.ndsu.edu/agriculture/ag-hub/ag-topics/ag-technology/precision-ag.
17 Stratasys Hong Kong, “Stratasys Generates Big-time Savings by Using Alteryx to Run a Report in 30 Minutes Instead of 5 Hours,” Alteryx, September 18, 2019, https://community.alteryx.com/t5/Alteryx-Use-Cases/Stratasys-Generates-Big-time-Savings-by-Using-Alteryx-to-Run-a/ta-p/466088.
18 Kris Walker, “SCL Health Uses Alteryx to Create a Data Infrastructure,” Alteryx, July 23, 2019, https://community.alteryx.com/t5/Alteryx-Use-Cases/SCL-Health-Uses-Alteryx-to-Create-a-Data-Infrastructure/ta-p/442451.
19 DanielleR, “Using Healthcare Data and Spatial Analytics to Optimize Salesforce Territory Alignment,” Alteryx, July 31, 2018, https://community.alteryx.com/t5/Alteryx-Use-Cases/Using-Healthcare-Data-and-Spatial-Analytics-to-Optimize/ta-p/182887.
20 Rossella Melchiotti and Viktor Kazinec, “Predicting Defectors with Alteryx Designer,” Alteryx, April 17, 2019, https://community.alteryx.com/t5/Alteryx-Use-Cases/Predicting-Defectors-with-Alteryx-Designer/ta-p/403992.
21 Andy Uttley and Kirian Dadhley, “Off the Grid: Using Location Intelligence to Place Solar Panels in Rwanda,” Alteryx, November 8, 2019, https://community.alteryx.com/t5/Alteryx-Use-Cases/Off-the-Grid-Using-Location-Intelligence-to-Place-Solar-Panels/ta-p/486967.
22 Arthur Ladwein, “Building an Individual Incentive Plan for Over 3,000 Employees,” Alteryx, August 30, 2019, https://community.alteryx.com/t5/Alteryx-Use-Cases/Building-an-Individual-Incentive-Plan-for-Over-3-000-Employees/ta-p/458155.
23 Arthur Ladwein, “Smart Relocation: How HR Saved 1,700 Hours,” Alteryx, December 5, 2019, https://community.alteryx.com/t5/Alteryx-Use-Cases/Smart-Relocation-How-HR-Saved-1-700-hours/ta-p/498903.
24 Caprice Walker, Brian Scott, and David Carnes, “City of Tallahassee: en Route to Become a Smart City,” Alteryx, August 15, 2019, https://community.alteryx.com/t5/Alteryx-Use-Cases/City-of-Tallahassee-en-Route-to-Become-a-Smart-City/ta-p/452552.
25 Austin Smith, “Decreasing Time to Resolution in Customer Support,” Alteryx, September 10, 2019, https://community.alteryx.com/t5/Alteryx-Use-Cases/Decreasing-Time-to-Resolution-in-Customer-Support/ta-p/461463.
26 For details on how OnePlus Systems utilized analytics automation to predict potential customer loss, see Eric Okunevich, “Turning Up the Predictive Process,” Alteryx, August 15, 2019, https://community.alteryx.com/t5/Alteryx-Use-Cases/Turning-Up-the-Predictive-Process/ta-p/452504.
27 Haumana Johannsen, Dave Teece, and Jenny Schoohs, “Cargill Saves 844 Hours Per Month with 3 Alteryx Users,” Alteryx, October 26, 2020, https://community.alteryx.com/t5/Alteryx-Use-Cases/Cargill-Saves-844-Hours-Per-Month-with-3-Alteryx-Users/ta-p/453028.
28 Scorpio Wong, “HKUST Saves 15 Hours/Month with Code Free Expense Allocation Model,” Alteryx, July 7, 2020, https://community.alteryx.com/t5/Alteryx-Use-Cases/Hkust-Saves-15-Hours-Month-with-Code-Free-Expense-Allocation/ta-p/599103.
29 For details on PASHA Holding’s utilization of analytics automation to generate automated reports, see Rashad Asadov, “PASHA Holding Enhances Reporting with Alteryx,” Alteryx, March 25, 2021, https://community.alteryx.com/t5/Alteryx-Use-Cases/PASHA-Holding-Enhances-Reporting-with-Alteryx/ta-p/734793.
30 Luisa Bez, “Adidas Automates PowerPoint Presentations to Save Time and Cut Errors,” Alteryx, October 19, 2020, https://community.alteryx.com/t5/Alteryx-Use-Cases/Adidas-Automates-PowerPoint-Presentations-to-Save-Time-and-Cut/ta-p/652483.
31 “Investor Presentation: Q2 2021,” Alteryx, accessed September 19, 2021, https://investor.alteryx.com/news-and-events/presentations/default.aspx.