A truth that many JavaScript books won’t tell you is that JavaScript is a tough language to get right the first time.
By now you should have a fairly solid feel for JavaScript as a language, and how to use things like event listeners and the DOM API to enrich the web sites you build. But if you’ve actually tried to write an original script of your own, chances are that you came away feeling humbled, and maybe even a little angry.
That frustration’s probably due, in part at least, to the fact that JavaScript, like all languages that run in the browser, is designed to fail silently by default. When things go wrong in the code you write, there’s no point in shouting about it to your hapless visitors, so browsers just quietly set aside broken scripts and ignore them. The instructions in this chapter will show you how to get the browser to speak up, so you can find out about JavaScript errors as they happen.
However, even once you can see the error messages, you’ll likely find that most JavaScript errors aren’t all that helpful—especially if you’re new to the language. Most of them are written in “programmer-ese,” or complain about a perfectly good part of the code when the problem is actually elsewhere. So we’ll spend some time in this chapter deciphering the most common error messages you’re likely to encounter, and what they really mean.
With those tools tucked in your belt, you should be able track down problems that the browser can detect for you. But you might still have occasion to wonder why on earth your carefully scripted code (which is perfectly fine, as far as the browser is concerned) is behaving the way it is. With the right tools, you can track a problem in your code to its source, even stepping through your JavaScript code a line at a time if necessary.
It isn’t very encouraging to spend two hours piecing together the ultimate script full of whizz-bang effects only to fire up your browser and have nothing happen; but when you’re first writing a new script, that’s usually your first hint that something has gone wrong—nothing happens.
The good news is that, if you’ve done your job right, the fact that the JavaScript fails silently means that your plain HTML/CSS can work on its own, and a user need never know that your code isn’t working right. See? The browser’s just looking after your reputation! This isn’t much help when you’re trying to find out why the script isn’t working, though.
When you’re working on your JavaScript code, then, you should configure your browser of choice to let you know about JavaScript errors when they happen. Depending on which browser you’re dealing with (and of course, you will eventually need to test as many as possible), the procedure is different.
Firefox has a very nice error console that you can access by selecting > . This opens the window shown in Figure 7.1. The console displays not only JavaScript errors, but errors in your CSS code, and even so-called chrome errors generated internally by the browser (usually after you’ve installed a buggy browser extension).
As you can see, the Firefox error console displays more than just errors:
- Errors
-
problems with your code that prevented the browser from continuing to run the script
- Warnings
-
problems with your code that the browser was able to work around, but which may indicate that the script isn’t doing what you expect it to
- Messages
-
notes from your code that tell you what it’s doing, usually only used as a debugging tool by browser extension developers—you won’t see many of these
For each entry in the console, the specific file and line number that generated the notification will be displayed. Depending on the nature of the entry, the error console may even show you the line in question, with a little arrow pointing to the exact code that generated the entry.
When you’re trying to track down a problem in your code, you’ll usually start by opening the error console and clicking the button to empty out the backlog of entries that may be displayed. Then you can reload the page in your main browser window and note the notifications that appear in the error console. If there are a lot of notifications, you might start by clicking the button to see only the most severe errors, and concentrate on fixing them first, before returning to the view to fix the less serious issues.
Opera’s error console, shown in Figure 7.2, works very much like Firefox’s. You can get to it by clicking > > .

The two drop-down menus at the bottom of this window are the key to seeing just the notifications that interest you. The first controls the source of the notifications that will be displayed, and you can choose from this menu if you want to filter out things like HTML and CSS errors while working on a script. The second drop-down works much like the notification filtering buttons in Firefox’s error console, enabling you to set the severity of the entries that are displayed in the console. The default selection, , will allow messages, warnings, and errors to be displayed.
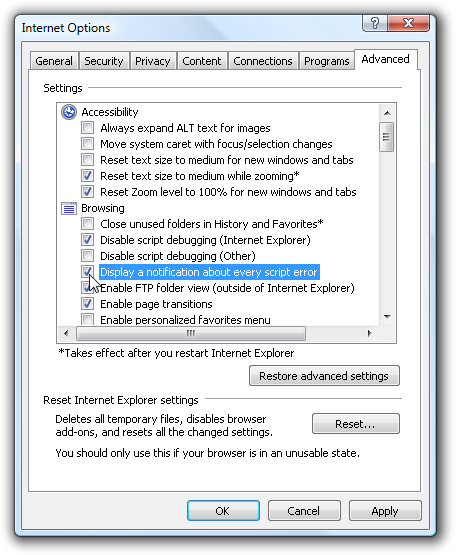
Useful error messages are harder to find in Internet Explorer. To see them, you need to open the Internet Options window ( > ), then, on the Advanced tab, look for the Display a notification about every script error option, under Browsing. Make sure it’s checked, as shown in Figure 7.3.
Once this option is set, you’ll be notified the moment a JavaScript error has occurred, with a remarkably unhelpful message box similar to that shown in Figure 7.4.
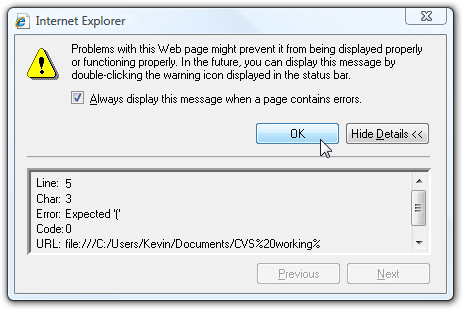
The only part of this window that you should really pay attention to is the line that begins with Error:. All the other information in this dialog (including the line and character numbers) is usually wrong. Heck, as of Internet Explorer 7, even the message at the top of this window was wrong! If you uncheck the Always display this message when a page contains errors checkbox, the warning icon in the status bar that it mentions will not actually be displayed.
As you can see, finding and fixing JavaScript errors in Internet Explorer is not easy. There are tools that can make it a little easier, but because most JavaScript problems will affect all browsers, you’re usually better off doing your JavaScript development in a different browser, and using Internet Explorer’s JavaScript error reporting as a last resort for problems specific to that browser.
To access Safari’s error console, you need to enable a hidden feature of that browser. Open a Terminal window and type:
defaults write com.apple.Safari IncludeDebugMenu 1Press Enter, then quit the Terminal application. When you next launch Safari, you’ll see a new menu next to the menu. Make sure the option is checked in the menu, as shown in Figure 7.5, then click to bring up the error console shown in Figure 7.6.
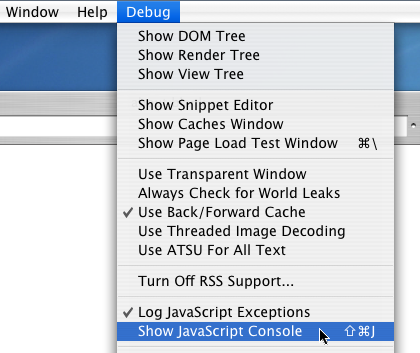
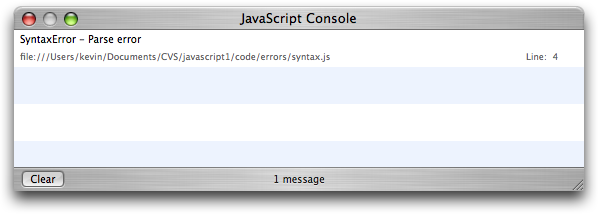
You’ll note that, of the four browsers we’ve discussed in this section, Safari provides the tersest and least helpful error messages. It generally gets the file name and line number right, at least.
Now that you can see JavaScript error messages, you need to learn how to interpret them.
Every browser has its own particular dialect for JavaScript error messages. Almost invariably, Firefox produces the most sensible and helpful messages of current browsers, so your best bet when faced with a confusing message is to open your page in Firefox to see what its error console says.
Three kinds of errors can occur in JavaScript:
-
syntax errors
-
runtime errors
-
logic errors
Only the first two produce error messages.
A syntax error is caused when your code violates the fundamental rules (or syntax) of the JavaScript language. It’s the browser’s way of saying, “Whatchoo talkin’ ’bout, Willis?” Of the errors that the browser will tell you about, syntax errors are the easiest to fix, but the hardest to spot in your code.
Here’s a simple script that contains a number of syntax errors:
 1 // This script contains four syntax errors
 2 var MyScript = {
 3   init: function
 4   {
 5     MyScript.doSomething();
 6   }
 7   doSomething: function()
 8   {
 9     alert("Hold onto your "hat"!");
10     \ something happens
11   }
12 };
13
14 Core.start(MyScript);
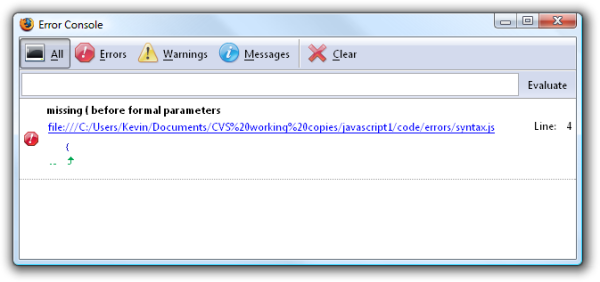
If you load a page that links to this script (like syntax.html in the code archive) in Firefox, the error console will display the error message shown in Figure 7.7.
Because the browser gives up on trying to make sense of your
script when it runs into a syntax error, you’ll only ever be notified
about the first syntax error in a given script. As you can see, the
error message in this case is “missing ( before formal parameters,” and
the browser ran into this error when it hit the opening brace
({) on line four of syntax.js.
Looking back at the script, it may not be immediately obvious to
you what the problem is. The brace is certainly in the right place, and
is required to mark the start of the init
method’s body, so why is the browser complaining about it? And what are
“formal parameters” anyway?
The real problem here occurs on the previous line: the parentheses
that must follow the function keyword were left out! These
parentheses enclose the list of arguments for the function (also known
as formal parameters), and are required. Here’s what the corrected code looks
like:
 3   init: function()
 4   {
 5     MyScript.doSomething();
It turns out that most syntax errors occur when the browser was
expecting one thing, but ran into something else instead. In this case,
it was expecting an opening parenthesis ((), and
encountered an opening brace ({) instead. That’s why the
error message points to the innocent-looking brace.
Usually, the error message will tell you what the browser expected
to find instead (in this case, it complains about the “missing
(”), but if the message doesn’t make sense to you, a good
tactic is to look at what immediately precedes the place in your code
where the error occurred, and try to identify what you might’ve left
out.
If you fix this error and reload the page, you’ll have an excellent opportunity to try out this technique when you see the error message shown in Figure 7.8.

Can you find the problem? Again, the browser is complaining about
a missing character—in this case a closing brace (})—but if
you look at the line before the error, there’s a closing brace there
already!
Why is the browser complaining about a missing closing brace? Well, because it thinks you need another closing brace. Now why would it think something like that?
The error message says “missing } after property list” because
what we’re doing at this point in our code is building an object
(MyScript) by providing a list of its properties and
methods. At the end of that list, we’d normally end the object
declaration with a closing brace, but judging by the error message,
JavaScript thinks we meant the object to end right here, on line
seven.
Looking at the code in this light, you can probably spot what’s
wrong: because the first method (init) isn’t
followed by a comma (,), the browser doesn’t know that we
want to declare a second, and falsely assumes that this is the end of
the object declaration. To fix this error, we must add the missing
comma:
 6   },
 7   doSomething: function()
This case highlights the fact that error messages are often just the browser’s best guess at what you meant to say with your code. In an ideal world, the message would have said something like “missing } after property list, unless you’re declaring another property, in which case you’re missing a comma,” but unfortunately browsers just aren’t that smart (yet). It’s up to you to notice when an error message is based on a false assumption on the browser’s part, and act accordingly.
If you fix this error and reload the page, you’ll see another example error, as depicted in Figure 7.9. This is an easy one, so see if you can figure it out before reading on.

From the error message, when the browser reached the “h” in “hat,”
it actually expected a closing parenthesis ()), because it
thought it had reached the end of the argument list for the
alert function call. Why would it think that in the
middle of an argument?
Again, look at the code that immediately precedes the error for an
explanation. Just before the “h” is a double quote ("),
which the browser interprets as the end of the string "Hold
onto your "—the first argument in your
alert function call. After this argument, it
expects either a comma (,) followed by the next argument,
or a closing parenthesis to complete the list of arguments. The error
message assumes you meant to choose the latter option.
Of course, in this case, you meant neither—you don’t actually want that double quote to signal the end of the first argument! To fix this, escape the double quotes in the string with backslashes:
9 alert("Hold onto your "hat"!");
Figure 7.10 shows the final error that the browser will trip over in this script.

Okay, I threw you a bone with this one. Just to show you that it does happen now and then, this error message says exactly what it means. The backslash at the start of the line is termed an illegal character, which is a fancy way of saying “Get a grip—you’re not even allowed to type a backslash here!”
The problem, of course, is that comments must be preceded by a double slash, not a double backslash:
10 // something happens
As you can see, once you’ve figured out where you went wrong, syntax errors are easy to fix, but the error messages that the browser displays can often be misleading. Usually it comes down to a forgotten character or two, or accidentally using one type of bracket when you meant to use another.
The good news is that the more JavaScript you write, the more familiar you’ll become with the nitty-gritty details of the language, and the fewer syntax errors you’ll be likely to run into.
Runtime errors occur when a perfectly valid piece of JavaScript code tries to do something that it’s not allowed to do, or that is flat out impossible. These errors are so named because they occur while the script is actually running. Unlike syntax error messages, the messages produced by runtime errors tend to be right on the money. The trick is figuring out why the error occurred.
This script contains a number of runtime errors:
 1 // This script contains three runtime errors
 2 var MyScript = {
 3   init: function()
 4   {
 5     var example = document.getElementsById("example");
 6
 7     for (var i = 0; i < example.length; i++)
 8     {
 9       Core.addEventListener(example[i], "click", doSomething);
10     }
11
12     var links = documents.getElementsByTagName("a");
13     var firstLink = links[0];
14
15     if (firstLink && firstLink.className == "")
16     {
17       alert("The first link has no class assigned to it!");
18     }
19   },
20   doSomething: function(event)
21   {
22     alert("Hold onto your "hat"!");
23   }
24 };
25
26 Core.start(MyScript);
Once again, fire up Firefox and load the corresponding HTML file (runtime.html) to see the first error produced by this script—it’s shown in Figure 7.11.

As you can see, runtime errors look just like syntax errors, except that the error console doesn’t show the line of code that caused a runtime error.
An “is not a function” error usually indicates that you’ve misspelled the name of the function or method that you’re trying to call, or that the function or method that you’re trying to call simply doesn’t exist.
As a newcomer to JavaScript, you’ll probably see this message a
lot—especially if you aren’t used to the case-sensitive nature of
JavaScript. Attempting to call Alert instead of
alert, for example, will produce this error
message. But it can happen in more subtle cases too, like calling a
string method like toLowerCase on a text node
(which isn’t a string), rather than the nodeValue of the text node (which is).
In this example, the cause is far simpler: the developer has tried
to call a method called getElementsById when there is no such method. The method the
developer was probably thinking of is
getElementById (without the “s”). Since you can
only have one element with a given ID in a document, it wouldn’t make
sense for there to be a method called
getElementsById.
The fix in this case is trivial:
5 var example = document.getElementById("example");
But it turns out that fixing this problem actually causes another runtime error, shown in Figure 7.12.
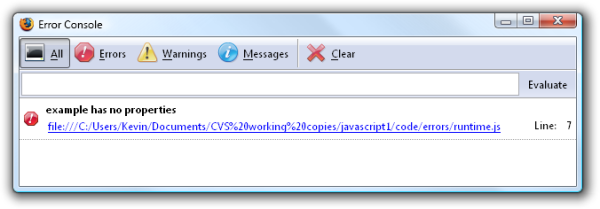
A “has no properties” error means that you’re trying to treat something that isn’t an object as if it were an object, by trying to access a property or method on something that has neither.
The most common cause of this error is a method that normally
returns an object (like getElementById)
returning null, JavaScript’s special “no object”
value. If your code assumes that an object would be returned and treats
the returned value as such, you’ll end up with an error like
this.
In this case, the error is being caused by the following line of code:
If you check runtime.html, you’ll see that
there isn’t actually an element with ID example, so the
getElementById call we just fixed above returns
null, and when this for loop tries to
read the length property of that
null value, it produces the error message we’re
looking at now.
Apparently, whoever wrote this script assumed that the fictitious
getElementsById method would return an empty array if it didn’t find any
elements with the specified ID. Since
getElementById returns either a single element
node or null, we need to replace the for
loop with an if statement:
 3   init: function()
 4   {
 5     var example = document.getElementsById("example");
 6
 7     if (example)
 8     {
 9       Core.addEventListener(example, "click", doSomething);
10     }
With that fixed, Figure 7.13 shows the last runtime error in this script.

An “is not defined” error is about as easy an error to fix as there is. Like the “is not a function” error we saw earlier, it usually results from a simple typing mistake, but rather than a misspelled function or method name, “is not defined” indicates you’ve tried to use a variable or property that doesn’t exist.
In this case, the error is really straightforward:
As you can see, the developer has simply misspelled
document as documents.
Fix this error, and the script will successfully display the alert message, “The first link has no class assigned to it!”
Logic errors aren’t so much errors as they are bugs in your script. The code runs fine as it was written—it just doesn’t behave the way you expected it to when you wrote it. These kinds of errors can be devilishly difficult to find because as far as the browser’s concerned the script is working just fine, so you never see an error message.
Since every logic error is different, each one presents a new challenge. Just in case you’re not entirely clear what a logic error is, here’s a script with a few logic errors in it:
 1 // This script contains three logic errors
 2 var MyScript = {
 3   init: function()
 4   {
 5     var links = document.getElementsByTagName("a");
 6     var exampleLinks = [];
 7     for (var i = 0; i < links.length; i++)
 8     {
 9       if (links[i].className = "Example")
10       {
11         Core.addEventListener(
12             links[i], "click", MyScript.doSomething);
13         exampleLinks[exampleLinks.length] = links[i];
14         i--;
15       }
16     }
17   },
18   doSomething: function(event)
19   {
20     alert("Hold onto your "hat"!");
21   }
22 };
23
24 Core.start(MyScript);
This script is supposed to find and build an
array that contains all links in the document that have a class attribute of example, and assign to each one the
doSomething method as a
click event listener.
Due to what could be described as a perfect storm of logic errors,
this script actually attempts to set the class attribute of
every link in the document to Example, but only gets as far as setting the
first one in the document before going into an infinite loop that hangs
the browser. Nice, huh?
If it’s any consolation, you’d have to be pretty unlucky to innocently produce a script with so serious a combination of logic errors as this. However, taken in isolation, each of the logic errors in this script is a reasonably common bug of the type you may run into when writing your own scripts.
The most serious problem in the script is the infinite loop, which is just about as bad a problem as you’ll ever create with a logic error. Older browsers would become completely unresponsive, and would have to be forcibly terminated by the user in the event of an infinite loop. These days, browsers will detect when a script has been running for a long time, and will display a message like the one shown in Figure 7.14, which offers to stop the script and return control to the user.

Let’s start by fixing this problem. Here’s the code responsible for the infinite loop:
When the script has discovered a link that it wants to add to the
exampleLinks array, it does so with the first of
these two statements. Unfortunately, the developer seems to have
suffered a brain fart, and assumed that adding a reference to the link
to the end of the exampleLinks array would remove it
from the node list stored in links. In an effort to
compensate for this imagined loss of an item from
links, the developer has decremented the counter
variable with the second statement (i--;).
In fact, the link remains in the links node
list, and all the decrementing i achieves is to cause
the for loop to process the same link over and over
again—our infinite loop.
We can avoid the infinite loop simply by removing the second statement:
 7     for (var i = 0; i != links.length; i++)
 8     {
 9       if (links[i].className = "Example")
10       {
11         Core.addEventListener(
12             links[i], "click", MyScript.doSomething);
13         exampleLinks[exampleLinks.length] = links[i];
14       }
15     }
Run this corrected code, and the next thing you’ll discover is
that the click event listener is assigned to
every link in the document. Behind the scenes, the
exampleLinks array is also filled with all the links
in the page. What’s causing this issue?
The source of this bug is an extremely common mistake made by
JavaScript beginners, who will often confuse the assignment
operator (=) with the equality operator (==). See it now?
The condition in this if statement is supposed to be
checking if the className property has a value
equal to "Example", but the
developer has mistakenly used the assignment operator (=)
here, causing this code to set the value of
className to "Example". An
assignment statement used as a condition like this evaluates to the
assigned value ("Example"), and since any non-empty
string is considered “true,” the if statement will execute
for every link it processes. The solution, of course, is to use the
correct operator:
9 if (links[i].className == "Example")
Run this modified code, however, and you’ll suddenly find that the event listener isn’t assigned to any of the links in the page—not even the first one in this paragraph:
    <p>This is an <a href="http://www.example.com/"
          class="example">example</a>, but this
      <a href="http://www.sitepoint.com/">is not</a>.</p>
This one’s pretty obvious. The if statement is
looking for a className of
"Example" (capital “E”), but the class attribute of the link is example (lowercase “e”). Class names are
case-sensitive, so we need to make sure the script matches the actual
class value in the document:
9 if (links[i].className == "example")
Now be honest: how many of those errors could you have spotted without my help, based only on the behavior of the browser? And if you thought spotting logic errors in someone else’s code was difficult, just wait till you’re sitting in front of your own code armed only with the absolute conviction that your code is perfect in every way!
In the absence of error messages, you need a specialized tool to help you track down logic errors like the ones we’ve just seen.
In the past, the most common approach to resolving logic
errors in JavaScript code was liberal use of the
alert function. If you’re expecting a for loop to run five
times, you can stick an alert on the first line
inside the loop and see if the browser displays five alert boxes when you
load the page. If it does, you move the alert call
somewhere else, to test another theory about why your script might be
misbehaving.
Sound tedious? It is.
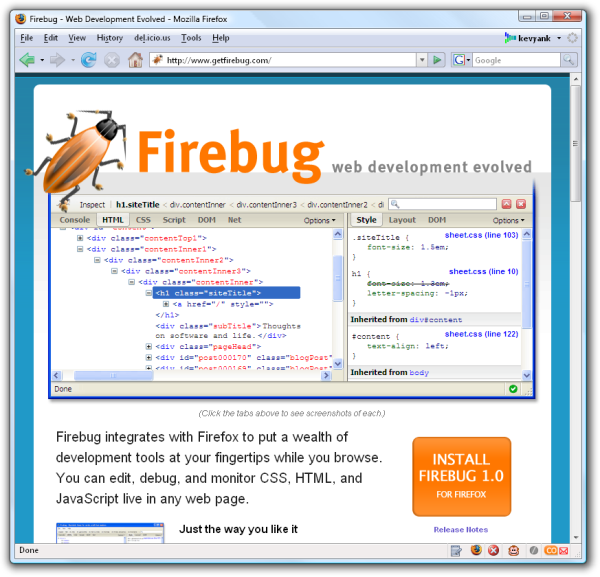
At the time of writing, a much more powerful (not to mention sane) approach is to use a JavaScript debugger, and by far the best debugger around is Firebug. Firebug is a free extension for Firefox that adds to the browser a panel containing a rich set of tools for diagnosing problems with your HTML, CSS, and JavaScript. You can download and install it from the Firebug web site, shown in Figure 7.15.
Let me show you how to use Firebug to track down the infinite loop that we fixed in the previous section:
-
Open the page in your browser, and wait for the “Unresponsive Script” warning. Click .
-
Hit F12, or click the new Firebug status icon at the bottom of the browser window to open the Firebug panel, shown in Figure 7.16, at the bottom of your browser.
-
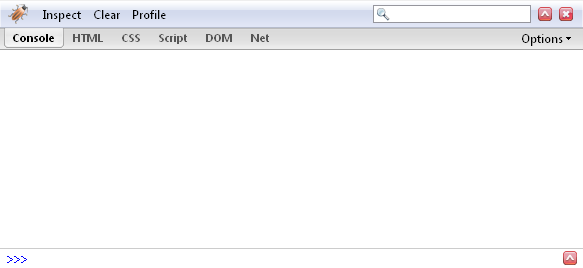
Since Firebug slows your browser’s performance, it’s disabled by default. Click either of the Enable Firebug links to enable Firebug. The first thing you’ll see is the Console tab pictured in Figure 7.17.
Like Firefox’s error console, Firebug’s Console tab will display JavaScript and CSS errors. It will also display useful information about Ajax requests, which you’ll learn about in the next chapter, if you select on the menu. You can type any JavaScript statement or expression into the command line at the bottom of the tab, and Firebug will execute it in the currently displayed page and display the result in the console.
-
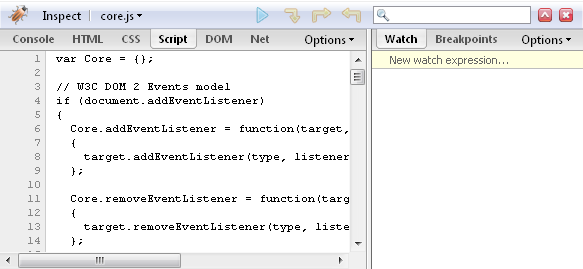
To fix the infinite loop in this page, however, we need something more powerful than the Console tab. Click the Script tab to see Firebug’s JavaScript debugger, which is depicted in Figure 7.18.
-
The debugger lets you pause the execution of your scripts and step through them one line at a time, observing the values of variables and the structure of the DOM as you go. Since the problem is likely to be in the logic.js file, start by selecting it from the drop-down menu at the top of the Firebug tab, as shown in Figure 7.19.
-
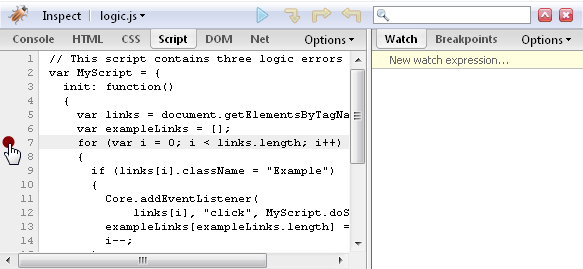
Firebug now displays the code of the logic.js file. We can tell by the way the browser is hanging that we’re dealing with an infinite loop, and the only loop in the code is the
forloop on line 7, so click in the gutter next to that line number, as shown in Figure 7.20. This sets a breakpoint, represented by a red circle, which tells the debugger to pause the execution of your script when it reaches that line. -
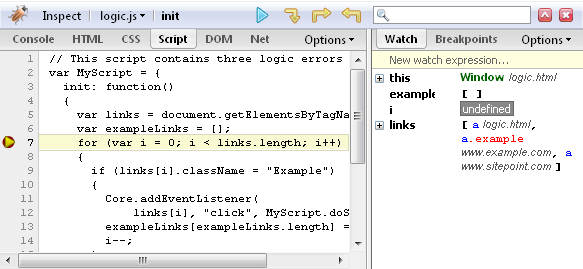
With your breakpoint in place, reload the page. As Figure 7.21 indicates, a yellow arrow will appear on top of the breakpoint to indicate that execution of the script has been paused at that line. The Watch tab in the debugger’s right-hand pane will also show the local variables that exist on that line, and their current values.
While the debugger is paused, you can click one of the four buttons at the top of the Firebug panel to control the execution of your script. The blue arrow resumes normal execution of the script, which will continue until it reaches the next breakpoint, if any. The three gold arrows let you step through your script one statement at a time. The first, , simply executes the current statement and pauses execution again on the next line of the current code listing. The second, works just like , except when the current statement contains a function or method call. In such cases, the debugger will step into the call, pausing execution on the first line inside the function/method. The third arrow, , allows the script to finish executing the current function, and pauses execution on the next line of the code that called it.
-
Click once to move to the first line inside the
forloop. -
Now, it would be nice to know about the current link being processed by the
forloop,links[i]. You can eyeball it by looking at the value ofiin the Watch pane, then expanding thelinksvariable in that pane to find the corresponding element of the array. Alternatively, you can click the area labeled New watch expression…, typelinks[i], and press Enter to add the expression to the list of local variables in the Watch pane, as shown in Figure 7.22.So we can tell that the first time through the loop,
links[i]is pointing to the hyperlink tologic.html. -
Click the yellow arrow in the gutter to set another breakpoint, this time on line 9.
-
Click the blue arrow to resume execution of the script. The
forloop finishes its first iteration and starts its second. Execution pauses at the new breakpoint on line 9. Already, as shown in Figure 7.23, you can spot a number of clues about what’s going wrong:-
istill has a value of0, even though we’re in the second iteration of the loop. -
links[i]still refers to the link tologic.html, except that it now has a class ofExample. -
The
linksnode list still contains all three of the links in our document.
-


At this point, a perceptive developer would be looking very hard at
that if statement and the i--; inside it. If you
needed more to go on, you could step through the body of the
for loop line by line to see exactly what’s going
on.
Firebug has tons of other cool stuff in it. Spend some time reading the Firebug web site to learn about the other features that it offers to aid you in your quest for the answer to the eternal question, “Why is the browser doing that?” And if you like what you see, think about donating a few bucks to the development of this incredible tool—I have.
That’s it! You can go out and brag to your friends that you know JavaScript now. From here on in, we’ll look at extra browser features and other software that can make JavaScript do more.
In the next chapter, we’ll delve into the mysteries of Ajax, whose sheer buzzword power may well be the reason you bought this book. If so, you’ll be pleased to know that the long wait is over. Turn the page, and bask in the buzz.