
Characterisation of cells on biomaterial surfaces and tissue-engineered constructs using microscopy techniques
S.I. Anderson, University of Nottingham School of Medicine, UK
Abstract:
Tissue engineering research can benefit enormously from the use of microscopy techniques, in particular, confocal laser scanning microscopy (CLSM). CLSM allows information on the cellular colonisation of a sample and the health and productivity of cells within and surrounding a scaffold. Many of the difficulties in processing and sectioning tissue-engineered cell-material constructs for conventional microscopy can be overcome using CLSM, sensible experimental design and appropriate sample preparation. This chapter is aimed as a practical guide to successful microscopy of cell-material constructs using live or fixed-cell CLSM.
Key words
microscopy; confocal microscopy; live cell imaging fluorescent dyes; reflectance microscopy
6.1 Introduction
The field of tissue engineering delivers a distinct set of samples to the microscopist. These challenging samples consist of biomaterial samples (polymers, metals, ceramics) as a two or three-dimensional structure, with or without the addition of biological material (cells and extracellular matrix (ECM) components) around and within the material scaffold. This composite structure is challenging as, although microscopy is used as a tool to examine both biological and material samples independently, the typical protocols utilised are generally different. For example, the chemicals used to process tissue for histology or electron microscopy may dissolve some polymers, or the force required to section engineered scaffolds may shred the delicate cell-matrix layers attached to their surfaces. It is therefore necessary to adapt techniques and alter experimental design to address the unique challenge these samples pose.
This chapter is principally concerned with a practical approach to microscopy of biomaterial samples and tissue engineering constructs. A key issue, crucial to the efficiency and success of a cell experiment in tissue engineering is experimental design and the general considerations here will be described so that the appropriate technique can be chosen on the basis of what is optimal for the samples and also what is available in the imaging laboratory. Other chapters in this book are concerned with histology and both transmission and scanning electron microscopy (TEM and SEM) so will only be briefly dealt with here. A core topic will be the use of confocal laser scanning microscopy (CLSM) to image cells in 3D scaffolds and the different options available within this technique. This section will also contain a guide to live cell imaging using vital dyes and a section on combining CLSM with other techniques to maximise the amount of information gained from a given experiment.
6.2 General considerations and experimental design
In the most common experiments where cultured cells are to be imaged microscopically, cells are seeded on glass coverslips or Thermanox plastic coverslips (Nunc) in a well plate format. This allows easy monitoring of the cell’s growth, allowing the experimenter to visually confirm the state of health and the stage of confluence/maturity of the cells prior to fixation, staining and viewing. Biomaterial surfaces do not conform to this ideal. They are often opaque and can have rough or even irregular surfaces, they may be of different sizes and they may be porous. These factors all cause problems both for cell seeding and in monitoring the cell’s progress.
It is therefore essential to design an experiment that will compensate for these factors. Generally more samples are required per experiment than for a straightforward cell culture experiment because it is not possible to monitor the level of confluence/maturity of cells seeded on an opaque surface and therefore extra time points may be needed to ensure that the appropriate level of cell confluence or maturity is reached. A possible strategy for this is to include an extra set of samples such that one or two can be removed from tissue culture at various time points and evaluated. In my laboratory we achieve this by fixing the samples in 4% parafornaldehyde and staining the cells with 1% toluidine blue in phosphate buffered saline (PBS). This allows the cells to be visusalised under a dissecting or stereo-microscope. This confirms confluence/or multilayering of cells and allows time points to be tailored to the needs of the experiment. A further option is to stain the cells with either propidium iodide or 4′,6-diamidino-2-phenylindole (DAPI) and to visualise the samples via fluorescence microscopy, which will provide the same information.
Due to the non-standard nature of many of the samples, more replicates may be required to reduce the effect of different sizes and potentially seeding densities. We use a minimum of n = 6 and usually include a 24 h time point. This facilitates a check that cells are growing as expected on the surface as outlined above. It also allows an assay to be performed at this stage (such as MTT/Alamar Blue or a DNA assay) to confirm that any subsequent differences in staining/labelling are not due to original seeding problems.
It is important to consider the format of the experiment when designing the individual surfaces for microscopy studies. If the materials are cast so that they fit neatly into a standard well plate format, for example, the subsequent seeding of the biomaterial surface will be much easier and the experimental data more reliable. Polymeric or composite materials can be cast in syringes and cut to a workable thickness using a scalpel blade or microtome so that they almost fill the well. Leaving more space around a sample than is needed to facilitate easy removal of the sample from the culture plate is not desirable as cells will preferentially attach to tissue culture plastic over most biomaterial samples. On the other hand, it is not advisable to cast polymer samples directly into tissue culture plates for two main reasons. Firstly, the samples are difficult to remove from the plate for imaging. Secondly, most materials cast in this manner will have a concave surface, leading to problems with cells accumulating in the centre of the surface. The concave central part of the sample will be difficult to bring into focus as the distance between the coverslip and the surface at this point may exceed the working distance of the lens at higher magnifications. Many polymer and ceramic samples float in tissue culture medium and a suitable means of weighing them down is necessary such as sterile plastic or rubber ‘O’ rings. These are easy and cheap to obtain and can be sterilised by UV or ethanol prior to use. They can be reused with adequate cleaning and sterilisation. Biomaterial samples should be of a similar size, thickness and surface area where possible.
6.2.1 Cell seeding
If material samples are ill-fitting in the culture space, many of the cells may adhere to the base of the tissue culture plate in preference to the scaffold/surface. It is important to ensure that cells adhere to the material rather that the surrounding tissue culture plastic, which is optimised for their attachment. In formats where there is space around the sample, these should be monitored by phase contrast microscopy in the tissue culture lab to ensure that a large number of cells have not adhered to the base of the well in preference to the sample of interest. If 3D scaffolds are to be investigated, or biomaterial samples cannot be manufactured to fit into a well-plate format, a thin layer of 4–10% agarose gel can be used to fill in the space around the sample. Once set around the sample, the plate can be sterilised under UV light before cell culture experiments. An alternative means to avoid colonisation on the uncovered base of the well is to seed cells in a small volume of medium on the sample surface for 90 min, to give the cells time to attach to the surface, before carefully adding the remaining amount of medium. Whatever strategy is adopted to minimise cell attachment to tissue culture plastic, rather than the biomaterial or scaffold of interest, it is advisable to remove the samples to a new plate prior to carrying out any biochemical assays. In this way, cells that are not attached to the material of interest are excluded from the analysis.
It is important to ensure that materials are of a regular thickness so that all cell colonies are exposed to an equal volume of culture medium. If enough space does not remain in the well, after addition of samples, to add a sufficient volume of medium, cells will suffer nutrient deficiency as the colony expands. For this reason, we tend to avoid the 96-well plate format, as the volume remaining for medium in these instances can be much reduced if the sample is not thin. The seeding density may need to be adjusted to account for increases in surface area due to grooves/roughness, etc. In any case it is important to seed some cells onto Thermanox/glass as a positive control to monitor the status of the cells and to act as an indication of when cell confluence or differentiation may occur. Of equal importance is to ensure biomaterial samples are carefully washed or ‘conditioned’, by incubating in culture medium or PBS prior to cell seeding, if this is appropriate, to allow leaching of remaining monomers from polymer samples, for example. These can be toxic and could easily give rise to misleading results if they are not taken into account. Differences in the pH of the medium can also result from leachables if the volume of medium is not sufficient to allow buffering. Prewashing and inclusion of a sufficient volume of medium can avoid some common pitfalls.
For 3D scaffolds, consisting of a porous or fibrous network, cell seeding poses different problems as cells may attach and grow preferentially on the outer surfaces, forming a cellular ‘crust’ around the outer surfaces of the scaffold which prevents cell ingress into the scaffold. This in turn can prevent adequate nutrient diffusion into the scaffold for those cells that manage to colonise the internal area. This area has received particular emphasis in recent years (Nukavarapu and Dorcemus, 2012; Hansmann et al., 2012; Wang et al., 2012; Murphy and Atala, 2012; Hu and Athanasiou, 2006; Griffon et al., 2005; Chen et al., 2004; Almarza and Athanasiou, 2004; Wu et al., 1999) and new developments in scaffold design and in the use of bioreactors have helped to alleviate the problem and must be given due consideration when planning an experiment using 3D scaffolds.
It may be that samples are very expensive to produce or that the yield is low. In this case it is important to design the experiment so that a definite result is obtained. This is often best achieved by limiting the number of variables rather than using fewer samples per variable and ending up with poor results. As an absolute minimum, three replicates should be included and imaged. It is wise to plan the imaging of samples in advance. Too often the images returned from an experiment will focus on ‘unusual’ or ‘interesting’ findings. There are often many more images from ‘test’ samples than ‘control’ samples. The correct way to approach imaging is to decide on an appropriate number of images to be generated in advance, to ensure these are representative of what is seen, and to generate a similar number of images from each sample (at equivalent magnifications). Obtaining representative images can be achieved by, for example, taking one image and moving a set distance across the sample each time. A suggestion to standardise imaging is to move two fields of view across and one field of view down each time (like a knight’s move in chess) and to record an image each time. In addition, experiments should be shown to be reproducible, so they should be carried out more than once, with the same amount of standardised imaging each time. Imaging will be much more reliable and it will be easier to take representative and accurate data as a result of good experimental design.
6.3 Confocal laser scanning microscopy (CLSM)
Imaging cell growth and matrix development in a tissue-engineering environment often utilises fluorescence techniques due to the opaque nature of ceramic and polymer samples. Fluorescently labelled cells can be imaged on an opaque surface where conventional transmitted light microscopy would not be suitable. Fluorescence microscopy is useful for many tissue-engineering applications but has limitations. For example, where many cell layers are present the resolution of the image will suffer due to the contribution of the glare from out-of-focus information to the image (‘out-of-focus’ blur). Where scaffolds or roughened surfaces are used, cells growing in deeper grooves or pores will not be easily imaged by higher magnification lenses as they will be out of the range of the working distance of the lens. Additionally many ceramics and polymers are auto-fluorescent, making conventional fluorescence microscopy difficult. In these cases, and where 3D information is required, confocal microscopy has become a routine technique for cellular imaging and has several advantages over fluorescence microscopy.
6.3.1 Principle of CLSM
CLSM is an advanced method of studying fluorescently labelled samples. The principle of CLSM is relatively straightforward. Excitation of the fluorescent label is achieved by means of a laser specific to the excitation maxima of the dye. This has the advantage of maximising the signal to background ratio. In addition, the inclusion of confocally aligned pinholes in the optical path means that only information for the plane of focus of the microscope is collected (Fig. 6.1). Information from above and below the plane of focus is excluded, which eliminates the ‘out of focus blur’ seen in fluorescence microscopes and provides an increased resolution over conventional fluorescence microscopy. The image is collected by point scanning of the sample and the emitted photons are collected using a photomultiplier tube (PMT). The digital images collected are easily quantifiable. By altering the plane of focus stepwise a series of images, all in focus, can be collected throughout the depth of the sample. This is called optical sectioning and allows images to be collected at several depths within the tissue (z-series). These can be displayed as a gallery of optical sections, showing the depth of cell ingress into a scaffold, or the areas in which the ECM is being produced, for example. Alternatively, the z-series can be projected as a maximum intensity projection – an image made by combining the brightest pixels from each optical section. This is useful for the tissue engineer as it allows cells growing on an uneven surface to be represented in one image, which is not possible in conventional light microscopy as many cells are out of focus at any one focal plane (Fig. 6.2). By collecting optical sections at the correct intervals (see later) it is possible to create a 3D reconstruction of the entire image series.


Confocal microscopes have a powerful optical zoom allowing much better resolution and magnification over the conventional light or fluorescence microscope. Simultaneously scanning multiple fluorescent labels at high magnification allows confirmation of the presence and localisation of the stained molecule to a particular organelle/membrane, etc. or to colocalise two labelled molecules. For detailed reading on CLSM see Pawley (2006). For the tissue engineer, the extent of colonisation of a surface, the viability of the cells, the production of ECM and the presence of phenotypic markers can be examined and compared using CLSM. An additional advantage for the biomaterials scientist/tissue engineer is that the problem of auto-fluorescence, which troubles many polymers or ceramics, can be almost eliminated. If the auto-fluorescent material has a flat surface, a z-series is collected of the cell layers only and the auto-fluorescent surface can be excluded from the z-scan. This allows the cell or ECM staining to be visualised without background auto-fluorescence. Collecting some surface auto-fluorescence can even be helpful in identifying surface features. Similarly, in a 3D scaffold, the auto-fluorescence from the scaffold can be used as an advantage, allowing the structure of the material to be visualised. This strategy only works if the labelling regime is optimal so that the intensity of staining of the cells and matrix, is optimal, i.e. much stronger than the auto-fluorescence.
Confocal microscopy also has some limitations.
• It is important to note that because CLSM is fluorescence based, only what is stained can be seen. This means the experimental outcomes need careful consideration so the number of dyes required to visualise all the elements needed is beyond what is practical.
• For tissue engineers the small depth of focus of the microscope and the opacity of scaffolds mean that 3D data from only a small depth of the surface of the scaffold can be collected and cells within deeper areas, e.g. pores will fall beyond the limits of the microscope. The depth of information that can be collected depends not only on the optical properties of the microscope, but also on the transparency of the sample. For example, 3D information can be collected from sub-surface pores in some gel/transparent polymer structures. The density of the network is also important, for example a fibrous network will allow information to be collected from deeper within a dense porous ceramic simply because of the interconnectivity of the structure.
CLSM is, however, a very useful tool in tissue engineering and provided the experimental design and approach are tailored to utilise the strengths of the system, can be used to give hitherto inaccessible information about the status of cells on, or in, materials. CLSM is the method of choice to study cell function – are cells alive or dead?; are they producing the right growth factors or matrix?; are they maturing?, etc. There are a number of practical considerations which must be taken into account when planning a CLSM experiment, using tissue engineered constructs and these will be dealt with in the following sections.
6.3.2 Experimental set-up
The way in which an experiment is planned and executed will depend on several factors, such as the type of equipment available, the type and shape of material under investigation or the availability of fluorescent labels. Each experiment will need controls both positive (this is used to validate the staining technique and is usually a (frozen) tissue section where the antigen of interest is definitely expressed) and negative (to ensure absence of nonspecific staining by the secondary antibody, usually the same tissue or cell sample where the primary antibody step is replaced by buffer). Additionally, a series of controls to illustrate how the cells would perform on a straight tissue culture comparison is needed.
It is not possible to recover cells growing in a well plate for fluorescence labelling without the use of cell scraping or chemical means such as trypsin so control samples are most often grown on glass or tissue culture plastic coverslips. Thermanox plastic coverslips (Nunc) are available in a range of diameters suitable for the well plate format. Care needs to be taken if glass is used as a control sample since many cell types do not behave in the same way on glass as tissue culture plastic, which is an optimised surface for cell growth. It may even outperform the biomaterial surface under investigation! For ease of use negative controls for the labelling procedure (i.e. where the primary antibody is excluded from the labelling procedure) can be carried out on cells growing on the flat surfaces of glass or Thermanox. A frozen section of an appropriate tissue is most often used as a positive control so that the efficacy of the label and the staining method can be checked in the natural in vivo situation (e.g. skin dermis for collagen 1). Thermanox/glass coverslips are usually treated in the same way as a tissue section for subsequent labelling and placed cell side up on a microscope slide under a coverslip using anti-fade mounting medium. It is not ideal to invert a thermanox coverslip onto a slide, cells face down.
Photobleaching results from reaction of the excited dye molecules with oxygen and the anti-fade component of a mountant mops up reactive oxygen species, limiting bleaching. The refractive index of the mountant should be as close as possible to that of biological tissue (1.5). Commonly used anti-fade mountants include Vectashield (containing p-phenylenediamine) and DABCO (1,4-diazabicyclo[2.2.2]octane; refractive index 1.4). An anti-fade mountant can be made in the laboratory by adding 2% DABCO to PBS. These mounting media do not set, so the coverslip is usually sealed using nail polish. For optimal image quality the thickness of coverslip used must be matched to the lens. The required coverslip thickness is engraved on each lens (e.g. 0.17 = 0.17 microns, which corresponds to a no. 11/2 coverslip). It is inadvisable to invert the glass/Thermanox coverslip onto the slide as the underside of the samples is not clean, having been incubated in tissue culture medium and undergone staining procedures. In addition Thermanox is auto-fluorescent so only suitable for confocal applications. It is also much thicker than a glass coverslip and therefore does not have appropriate optical properties. Use of small round coverslips also carries the risk that the nail varnish used to seal the sample obscures much of the available viewing area. This is difficult to image while still leaving a suitably sized viewing area from which to generate a series of representative images. Hard setting mountants are available such as Vectashield Hard Set (www.vectorlabs.com) and may be more appropriate for 2D biomaterial surfaces although it must be noted that shrinkage occurs, with the potential to cause tissue damage, though, in practical terms, this may not be any more than is caused by fixation and staining of the sample.
6.3.3 Upright versus inverted microscopy
An upright microscope has the lenses mounted above the stage, so that the sample is viewed from above, while an inverted microscope has the lenses below the stage so that the sample is viewed from below (seen in many tissue culture laboratories). Initially the upright microscope may appear to be the best choice for the tissue engineer or biomaterials scientist as many biomaterials are opaque and it may be assumed that cells growing on the surface will need to be imaged from above. The samples are mounted on a glass slide with the cells uppermost and a coverslip added with anti-fade mounting medium used to minimise photobleaching. The samples are adhered to the slides by means of a double-sided sticky tab (carbon tabs used to mount SEM samples are ideal, available from Agar Scientific/TAAB). It is not possible to seal these samples so they may not store well and it is advisable to image them straight after making them unless a hard setting mounting medium is used. Placing the slides in a suitable carrier and wrapping loosely in tin foil allows short-term storage at 4 °C.
As the samples are imaged from above, the uneven nature of many surfaces can cause artefacts: for example, if the sample is wedge shaped or has a concave surface. In an effort to bring deeper objects into focus, to visualise the bottom of pores or to push at a fibrous network, it is possible to exert pressure on the coverslip and hence compress the sample. In this case false information about the depth, size and shape of stained cells and surfaces will be recorded (see Fig. 6.3). In a system designed to give 3D information about a sample, awareness of the potential of these artefacts is essential. Additionally, it is possible to inadvertently drag the coverslip across the surface of the sample, while locating a suitable area, and this will disturb the cells. Often the best way to prevent this is to use an inverted system.
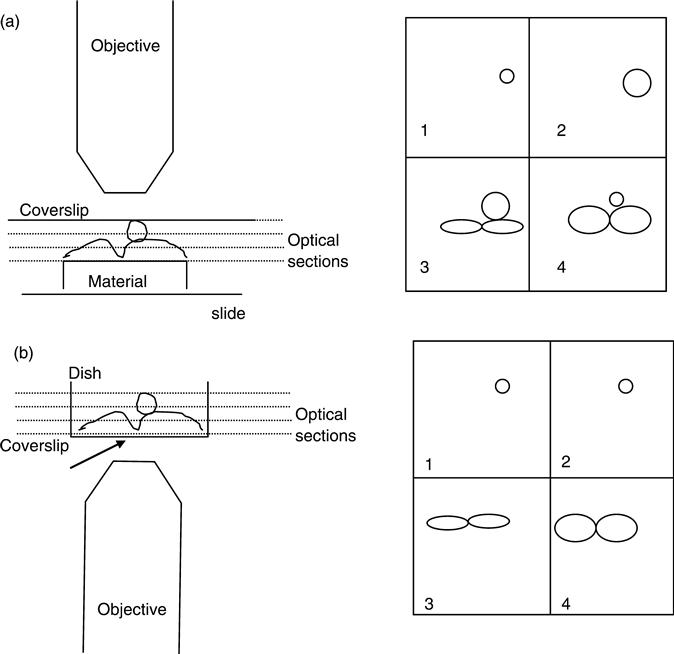
Looking at samples mounted in the conventional manner in an inverted system can be difficult: the sample must be inverted, risking losing the coverslip and distorting the cells by putting pressure on them from above and below. This can best be avoided by placing the sample/scaffold in a glass-bottomed culture dish where a coverslip is inserted into a hole in the base of a Petri dish. These can be made in the laboratory by modifying small Petri dishes or purchased from a range of suppliers (such as Iwaki). The base of the dish is removed using a heated cork borer and a glass coverslip, of the appropriate thickness, glued onto the base from beneath. The dishes can be sterilised using UV light if needed. Using glass-based dishes has the advantage that the lens cannot exert pressure from the coverslip onto the sample so depth information will be accurate. In addition, live cell imaging is also possible as the cells can remain in tissue culture medium.
6.3.4 Flatness of field and surface roughness of sample
In an upright system the upper and lower surfaces of any material need to be as parallel as possible, otherwise depth information will be inaccurate and cell in-growth into a scaffold may be reported, when in fact it is simply a sloped surface that has been presented (Fig. 6.4). The same applies to dishes being placed in an inverted system – if they are not absolutely level the depth information will be inaccurate. Corrections for this, i.e. linear and parabolic flattening tools, are often present in the CLSM software but in our experience they can be crude and so it is best to avoid having to use them where possible.

In an inverted system, as long as the culture dish is placed into the microscope stage level, the sample will be presented correctly. However, samples that are excessively porous, roughened, concave or convex will present the microscopist with a challenge because the necessity of imaging through a coverslip will mean that cells will have adhered to the material surface in areas that are beyond the working distance of the lens. This is in a similar manner to the way that cells grown in depression slides, or indeed slides with excess mounting medium, cannot be focused except at very low magnifications. In this case only a certain proportion of the surface of the sample will be within the range of the working distance of the lens. If the sample is too uneven only a small area of the entire surface may be focused. This limits the operator in two ways. Firstly, it is not possible to survey the whole sample in order to ensure what is recorded is representative of the surface as a whole and secondly, the element of choice is removed so that the collected image is dictated by what can be focused rather than by what is representative or valid. To minimise this, attention to detail during and after casting (e.g. trimming of excess material from the edges of the sample, ensuring a sample is not excessively concave or convex, ensuring the upper and lower surfaces are parallel – to avoid a wedge shaped sample) will ensure that the roughness of the sample is part of its intrinsic properties rather than bad casting. If the scaffold is produced in such a way that the surface is as level as possible, much more of it will be in contact with the coverslip and optical sectioning will allow deeper areas of the sample to be collected. However, the cells growing in the bases of very deep pores or crevices in the material will not contribute to the final image.
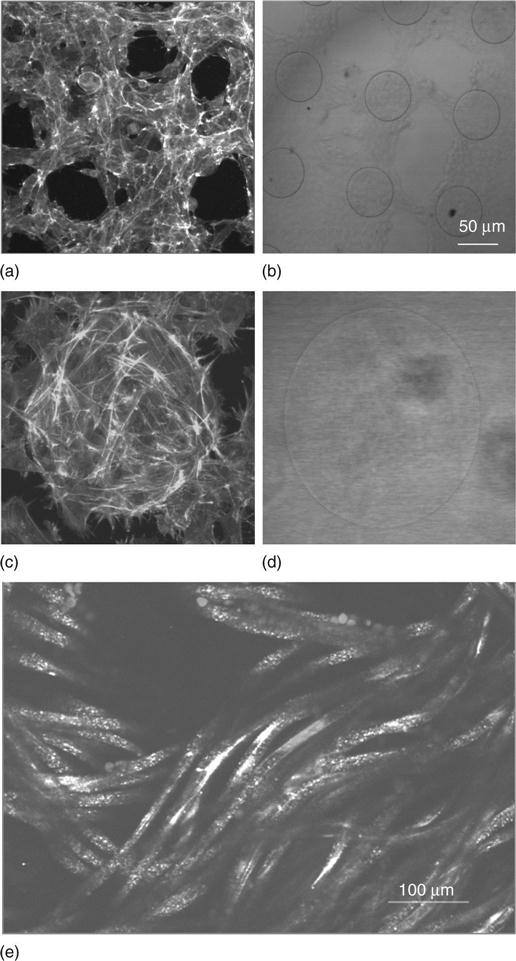
The CLSM can also be used to measure the surface roughness of a sample and this is a useful tool. Optical sections are acquired in reflectance mode (see below) and the Ra value is calculated (Tomovich and Peng, 2005). We have used samples of standard roughness (Ra = 3 and Ra = 0.5) to validate the use of CLSM for roughness measurements. The magnification used is critical and as a general guide the most accurate measurements use a magnification where 10–12 repeats of the roughness feature are seen in the field of view (grooves, pits, etc.) per scanned area, ensuring the surface is entirely level. Using the standard samples we have shown that a 16 × lens is most accurate for the Ra = 3 sample and a 63 × lens is most accurate for imaging the Ra = 0.5 sample.
6.3.5 Opacity and shape of sample
The opacity of a solid sample presents no problems for imaging. The cells are all on the surface and as long as this is even (as outlined above) information can be collected from many cell layers and cells growing in grooves, pitted or roughened surfaces. In a porous or fibrous scaffold structure the depth of penetration into the sample depends on the opacity of the sample. If it is transparent the laser can penetrate into pores and spaces below the surface and provide information on cell colonisation, state of health, ECM production and presence of phenotypic markers. Similarly if the sample is a 3D cell culture, such as a spheroid (Thomas et al., 2006) then it is possible, with good staining, to image depths of up to 300 microns. Often in these cases the penetration of the stain is the limiting factor rather than the size of the sample. Using vital dyes incorporated into living cells (such as DiI or Di8-Annepps for membranes, or ‘live/dead’ assay for cells, etc.), or matrix (such as tetracycline for bone mineral) or green fluorescent protein (GFP) constructs transfected into cells can overcome the depth of staining issues.
In an opaque 3D open network the depth of penetration will be limited below the surfaces. Occasionally a large surface pore will allow access to a deeper structure but generally these samples need to be cut in order to view cell colonisation/matrix deposition/maturation in the interior. Initially image series can be collected from the upper and lower surfaces as well as the sides by turning the sample in the dish so that the surface of interest is downwards. Then the sample can be cut into a series of slices (with a sharp scalpel blade) to show cell in growth and activity in several areas. These, in turn, can be imaged on both sides and by using a systematic approach quantifiable information on the colonisation of the construct can be achieved. Again, the use of an inverted microscope is invaluable in ensuring the accuracy of depth data generated using z-series, as in an open 3D structure it is easy to push the coverslip with the lens and thus cells on the surface of the scaffold may be recorded as being deeper within the scaffold. This use of the ‘live/dead’ assay enables the viability in the centre of the construct to be assessed. Combining these techniques with others allows the colonisation of the scaffold to be mapped using microCT (computed tomography) or SEM for example, and be related to the cell behaviour as recorded from specific areas using CLSM.
6.3.6 Fluorescent labels
Traditionally the means of fluorescently labelling cells has been to primarily label the antigen of interest with an antibody raised in a different species. The cells are then incubated in a species-specific secondary antibody conjugated to a fluorescent probe. The fluorescence is excited using a laser matched to the maximum excitation wavelength of the dye. The choice of label is dependent on the individual experiment, but stains for many cellular organelles, membranes and cytoskeletal elements are now available, already conjugated to a range of different fluorochromes. These are summarised in the molecular probes handbook (available online – see list Section 6.6). In this way labelling of a cell with three or four dyes, to identify the structure and localisation of many cellular components, can be readily achieved. For a typical example in the biomaterials field see Recknor et al. (2006).
The increasing range of low cost lasers available on modern CLSMs matched to the increased number of fluorescent proteins available have resulted in a huge increase in the number of wavelength dyes available so that the microscopist is no longer dependent on the traditional blue/green/red fluorescence (for example, CFP and YFP – cyan and yellow fluorescent proteins). This has meant that, apart from the most common GFP, other fluorescent proteins now span the entire visible spectrum, greatly increasing the opportunities for multiple labelling in fixed and live cell imaging.
6.3.7 Reflectance microscopy
Reflectance is a way of confocal imaging that uses reflected light instead of fluorescence. The laser interrogates the sample in the usual way and light reflected from the sample is collected. In this way unlabelled specimens can be imaged. This is an extremely useful tool for the tissue engineer and depends on the nature of the sample. Highly reflective materials such as metals are shown in detail (Fig. 6.5b and d). Even if the material is not highly reflective (as in the case of some polymers) they still may be imaged if there is a significant fluctuation of refractive index at certain boundaries, for example in a polymer fibre network structure (Fig. 6.5e). Collagen fibres have also been imaged using this method (Paddock, 2002). Generation of a simple image of cells growing in a scaffold is relatively straightforward. For example, one can stain cells with ‘cell tracker’ or the ‘live dead’ stain or a nuclear label and use reflectance to image the scaffold for an informative result without any difficulty or expense. The DAB (diaminobenzidine) reaction, often used in histology, can be detected using reflectance microscopy, further enlarging the number of labels that can be imaged simultaneously (Robinson and Batten, 1989). This has been used successfully in our laboratory to image DAB labelled neurons via reflectance microscopy.
6.3.8 Number of optical sections, 3D reconstruction and localisation
For CLSM imaging of tissue engineered and biomaterial samples the casting of the samples, seeding of the cells and presentation of the samples to the microscope are key to getting a good set of data. The actual process of imaging the samples is routine and straightforward. However, it is useful to review some essential information on the selection of the correct number of optical sections. If the number of sections is selected accurately then a 3D reconstruction and animation can be prepared, either using the confocal software itself or one of the other available programs such as Imaris (Bitplane), Volocity (Improvision) or Metamorph (Molecular Devices). Image J is hugely popular, free software within the microscopy community and new functionality is constantly being added (see http://rsbweb.nih.gov/ij/). This can provide a useful means of interpreting data and make it easier to present such data in a meaningful way. In addition, having gathered the data in an XY plane, it is often useful to view it in XZ and YZ directions (Fig. 6.6). The interaction of astrocyte processes with blood vessels was easily distinguished using this view. The resolution of these views will entirely depend on having collected enough depth information in the z series.

Additionally it is crucial to collect the correct number of optical sections if very small molecules are being imaged (e.g. synaptic vesicles) or if imaging labels that are likely to be in a single plane in the cell (e.g. focal adhesions). If there is not a sufficient degree of oversampling then information will be missed from the series. It is not necessary, however, to exhaustively gather the correct number of sections for applications where 3D reconstructions are not required. In a sample where a large z-series of larger objects (e.g. cells/nuclei) is to be scanned and if these results are to be displayed as a gallery of images from the top to the bottom of several cell layers, for example, much time will be saved by spacing the z-slices by several microns. However, this approach is only advisable if the researcher is sure that relevant information will not be missed. It is always possible to collect the correct number of z-slices, and subsequently only display, for example, every third one in a gallery.
The correct number of optical sections Z step size) is calculated according to the Nyquist sampling theory, which describes the sampling frequency required to represent the true identity of the sample. As a rule of thumb the z-step between sections should be half the objective resolution, which is calculated by:
where λ = wavelength of the laser and NA = the numerical aperture of the lens which is engraved onto the lens casing. So, using the 488 nm laser line, for a 63 × objective with a numerical aperture of 1.4 the resolution is 174 nm and the z-step should be 75 nm. In practice the minimum step size is often 100 nm. For a 10 × objective with a NA of 0.4 the resolution is 610 nm and the z-step should be 305 nm.
6.3.9 Live cell imaging
For the tissue engineer some useful information can be gleaned using relatively simple live cell imaging techniques and in this way CLSM provides an entirely different, but complementary, set of information from SEM. Cell viability studies are perhaps the most straightforward of these. The basis of the propidium iodide stain is that it can only enter cells with damaged membranes and therefore it will only label dead (or fixed) cells. This is the basis of the ‘live/dead’ stain from Molecular Probes (Invitrogen). This stain also utilises calcein, which is actively taken up by metabolising cells, and in this way the living cells are also labelled, giving a quantitative analysis of viability over the whole culture. For tissue engineering this is especially valuable as it gives viability information that is specific to the location within a sample, e.g. in a large tissue engineered sample are the cells in the middle doing worse than those near the surface? Over time are the sells seeded into a scaffold alive and thriving or just slowly dying off (Altmann et al., 2011; Bölgen et al., 2011)? Live cell imaging can also be carried out on 3D culture systems such as hepatic spheroids (Thomas et al., 2006).
Cell tracker (Invitrogen) is another useful simple method of fluorescently labelling live cells and has the advantage that it persists in daughter cells after mitosis. This means that fluorescence labelling is not lost in an actively dividing culture and also allows the labelled cells introduced to a scaffold to be tracked. In this way the progress of labelled cells into a scaffold could be monitored.
The structure of cellular components can also be visualised in live cells using a range of vital markers for subcellular components, a selection of which are shown in Table 6.1 (see http://probes.invitrogen.com for extensive listings and protocols), but the distinct advantage of live cell imaging is the ability to also monitor cellular function.
Table 6.1
Table of vital dyes commonly used for live cell imaging using CLSM and fluorescence applications
| Organelle | Vital dye |
| Nucleus | Hoechst 33342 |
| SYTO 13 | |
| Mitochondria | Rhodamine 123 |
| Mitotracker | |
| Endoplasmic reticulum | ER Tracker |
| DiOC6 | |
| Golgi apparatus | BODIPY FL C5 Ceramide |
| C6-NBD-Ceramide | |
| Lysosomes | Lysotracker |
| Lysosensor (for pH) | |
| Plasma membrane | Di-I |
| Wheat germ agglutinin | |
| Intracellular membrane | Cell trace BODIPY TR methyl ester |
| Cytoskeletal actin | NBD Phalloidin |
| Microtubules | Oregon Green paclitaxel |
The use of ratiometric dyes to measure ionic flux (such as calcium indicators, e.g. Fura-2 or pH indicators, e.g. SNARF) facilitates more complex investigations on cellular function. These probes bind available ions in a ratiometric manner so that the wavelength or fluorescent intensity is increased or decreased in a quantifiable manner. Lohr (2003) describes a method for using Fura Red for CLSM imaging of calcium signalling in neurons. Other cellular functions, such as measuring oxidation, can also be performed, e.g. hydrogen peroxide activity can be measured using dichlorofluorescein diacetate (Carter et al., 1994).
GFP is a product of the naturally chemiluminescent jellyfish Aequoria victoria and is used primarily as a marker for specific molecular sequences. GFP can be retrovirally expressed in specific colonies of cells and these are studied under various conditions (such as cell division, cell death, or in mutant versus wild-type strains of the same cell type), often using time lapse imaging (Jessel et al., 2006), but will also retain fluorescence after fixation allowing subsequent labelling with a number of other fluorescent markers. In the biomaterials field GFP has been used to study adult hippocampal progenitor cell cultures on micropatterned polymer surfaces (Recknor et al., 2006). GFP can also be used with other vital dyes in order to multiple label live cells. Many other fluorescent proteins have been developed in recent years, allowing the possibility of multiple labelling of specific moieties in live cells or of monitoring the interaction of two cell types.
Dynamic information from live cell applications can be gained by using fluorescence resonance energy transfer (FRET), fluorescence recovery after photobleaching (FRAP) and total internal reflectance (TIRF) microscopy. A full review of these techniques is beyond the scope of this text but a basic description will be given here. FRET allows detection of the energy transfer between two molecules which are 10–100 Å apart. One molecule acts as the donor and one the acceptor and each is labelled with fluorescent tags where the emission spectrum of the donor must significantly overlap the excitation spectrum of the acceptor. By exciting the donor molecule and detecting the fluorescence emission from the acceptor, it can be confirmed that FRET is occurring. This gives information on the proximity and communication between the two molecules. FRAP is a means of measuring transport and diffusion gradients within a cell. The cell is labelled with a fluorescent tag and a small region of interest is scanned with a laser on maximum power until the fluorescence in the region of interest has been completely photobleached. A time-lapse series is then recorded and the rate of recovery of the fluorescence is measured. Perhaps the most useful technique currently for the tissue engineer is TIRF. This requires a separate set of optics but gives high-resolution imaging to facilitate the study of interfaces such as cell–substrate or cell–material interactions (Blacklock et al., 2010; Burmeister et al., 1998).
6.4 Combining techniques
The nature of tissue engineered samples, which are a composite of biological and material moieties often in a complex arrangement, means that no one technique is likely to provide all the information required from an experiment. Often experiments are run in parallel for a biochemical assay to provide quantitative information on the function of a cell population. Combining imaging techniques provides a way of extracting further information from the samples, which may be in limited supply or expensive to produce. Additionally, imaging has the added advantage of investigating cells in situ, i.e. they are not removed from the scaffold and remain intact. In this way the nuances of a cell culture can be identified. For example, in a typical osteoblast culture cells form nodules as they mature and this is the site of mineral formation. It is therefore possible, using imaging techniques, to characterise the distinction between nodules versus non-nodular areas within a single culture.
Simply combining fluorescence and reflection techniques within CLSM provides additional useful information on the location of cells within a scaffold as previously shown. Another useful combination is live and fixed cell imaging. Having imaged cells growing in a scaffold using a vital dye it is then possible to fix the cells and stain with conventional dyes. In our experience, this has proved to be a very useful tool and has answered questions arising during live cell imaging by fixing and labelling while the dish was still in the microscope, allowing visualisation of the same cell in both live and fixed states. Figure 6.7 shows cultured human osteoblasts labelled with the vital membrane dipole dye Di-8-Anepps (Invitrogen). This was used to assess the potential interaction of a probe with osteoblasts by serial additions of the probe to the culture dish and time-lapse confocal imaging. At a certain concentration there was an influx of the dye into the cell, but it was unclear which part of the cell now contained the dye. By keeping the culture dish in place on the microscope stage and carefully removing the medium, washing and adding fixative to the dish and then labelling the nuclei with propidium iodide, it was confirmed that the dye had relocated to the cytoplasm and not the nucleus of the same cells. It is also possible to do labelling of receptors or focal adhesions in this way, which gives an opportunity to further study ‘interesting’ areas found during live cell experiments.

SEM is dealt with at length in another chapter but it is worth reiterating a few facts here. Firstly, the resolving power of electron microscopy with the added bonus of a large depth of field makes SEM a powerful technique for looking at cells on materials. It allows the user to look at cell colonisation deep in surface features in a 3D porous scaffold and can give information on sub-surface cell in growth in a fibrous network (Chua et al., 2005) while maintaining focus. Additionally, energy dispersive X-ray microanalysis (EDX) or elemental mapping can be used to assist in the identification of elemental composition of composites (e.g. particle size and distribution of a second phase within a polymer composite). Also, backscattered electron imaging gives great contrast to, for example, cells on metal as the atomic number for the major elements present are far apart in the periodic table. Harris et al. (1999) compared methods of imaging cellular cytoskeletal elements using backscattered electrons. These factors make SEM an invaluable tool for imaging cells on materials. Limitations of SEM are that it can be difficult in the case of some materials to distinguish cells from the material and to judge the state of health of the cell especially if cells become very spread out; when this is the case CLSM is a good option. Fluorescently labelled cells have excellent contrast against unstained materials and use of other fluorochromes can give functional information about cells. This works best when the material itself is auto-fluorescent (in the case of hydroxyapatite and some polymers), to facilitate viewing or reflective, to facilitate reflectance imaging. The combination of SEM and CLSM augments the amount of information that can be gathered from a single experiment. By labelling specific receptors or molecules, CLSM gives the additional information on cell viability, cell behaviour, expression of phenotypic markers, cell maturation or reaction to changes in topography or surface chemistry. The combination of these techniques allows the characterisation of the material surface, the distribution of cells and the characterisation of cell phenotype and behaviour in a single experiment (Recknor et al., 2006).
Given the limitation of both CLSM and SEM in imaging cells deep within the scaffold it is perhaps unsurprising that an increasing number of groups are using microCT to assess cell in growth within a 3D porous network (Hayward et al., 2013; Ruggiu et al., 2012; Amosi et al., 2012; Knackstedt et al., 2006; Gauthier et al., 2005; Jones et al., 2004). The resolution achievable with microCT is sufficient to give a good indication of colonisation of a scaffold, and data processing allows the scaffold and cells to be distinguished. This is becoming an invaluable technique for tissue engineers and consideration should be given to combining this technique with both SEM and CLSM. For a recent review of microCT in tissue engineering see Barbetta et al. (2012).
6.5 Future trends
Combining techniques has proved to be very useful in the imaging of tissue engineered samples as has already been discussed. A potential future trend for the field also lies in the combination of two useful techniques, i.e. CLSM and TEM.
TEM is a very powerful technique as it allows the highest achievable resolution in microscopy, achieving magnifications typically up to 300000 × and resolving fine ultrastructural detail. Electromagnetic coils assume the function of lenses, focusing the beam and magnifying the section. The electron beam is propelled through a high vacuum by an accelerating voltage of 60–100 kV and passes through a thin (70–90 nm) section projecting the final image on a phosphorescent screen. The main limiting factor for TEM in tissue engineering are whether the scaffold (especially polymers) is stable throughout a processing schedule that uses alcohols, acetone and propylene oxide and whether the material component can be cut without damage to the knife or biological components.
Optimal tissue processing is needed to prevent excessive shrinkage of the tissue from the pores of the scaffold. TEM allows identification of cells, organelles and membranes and can also distinguish cell types and ECM components (GAGs, collagen) and also types of intercellular communication (tight/gap junctions/desmosomes). Additionally it is possible to immunolabel targets of interest using tiny gold particles instead of coloured or fluorescent tags and double labelling is achieved by using gold probes of different sizes.
The challenge to the tissue engineer is to develop a processing schedule which does not destabilise the material while retaining antigenicity for subsequent immunolabelling. One option of dealing with this problem is use of the new generation of nano probes (1.4 nm), which allows the labelling of fresh/fixed tissue prior to embedding. This overcomes the problem of the routine TEM processing schedule being incompatible with antigen retention. It is necessary to use silver enhancement techniques (e.g. HQ silver, Nanoprobes) to build these probes into a visible size by nucleation of silver grains uniformly around the gold particle. A second option is the use of cryo techniques. In this case the scaffold–cell composite would be frozen and sectioned using a cryoultramicrotome to produce ultra thin sections of polymer and cell for subsequent immunolabelling. This, although complex technically, removes the need to subject either the cells or the material to chemical intervention and opens up the possibility to conduct immunocytochemical investigations of intracellular, cell–matrix, cell–cell and cell–material interactions at the ultrastructural level. Combining TEM and CLSM has been made easier by the emergence of fluoronanogold probes (Nanoprobes via UK agent Universal Biologicals). It is now possible to label an antigen of interest with a label containing both a fluorescent tag and a 1.4 nm gold probe. This allows a cell to be examined firstly by CLSM and subsequently the same cell can be examined by TEM to zone in on areas of interest and ultrastructurally localise the target to within a cell type/organelle. The small size of the gold probe allows for good tissue and cell penetration and the presence of a fluorescent tag allows both confirmation of the presence of the target of interest and its broad localisation within the larger structure (Takizawa and Robinson, 2003; Robinson et al., 2001; Robinson and Vandre, 1997).
It is also possible to combine immunocytochemical te`chniques with SEM. Therefore, not only is it possible to augment the knowledge gained from SEM studies using CLSM, it is also possible further enhance information gained using CLSM by using immuno-SEM to localise immunostaining of a particular antigen to a distinct sub-cellular component or membrane. This can be achieved for cell surface and ECM components and also for internal cellular components using cellular ‘unroofing’ techniques (Mishra et al., 2004; Heuser, 2000). Filmon et al. (2002) have combined backscattered SEM imaging with CLSM and immuno-TEM to study the interaction between osteoblastic cells and polymer hydroxyapatite composite materials. The future for imaging cells in a 3D scaffold offers huge potential both in terms of advances in individual techniques and in combining these techniques to get the maximum amount of information from a given experiment.