


IBM z Advanced Workload Analysis Reporter (IBM zAware)
This appendix introduces IBM z Advanced Workload Analysis Reporter (IBM zAware), which was introduced with IBM zEnterprise zEC12. This feature is designed to offer a near real-time, continuous learning, diagnostic, and monitoring capability. IBM zAware helps you pinpoint and resolve potential problems quickly enough to minimize impacts to your business.
This appendix includes the following sections:
For more information about IBM zAware, see Extending z/OS System Management Functions with IBM zAware, SG24-8070 and Advanced Workload Analysis Reporter (IBM zAware), SC27-2632.
A.1 Troubleshooting in complex IT environments
In a 24x7 operating environment, a system problem or incident can drive up operations costs and disrupt service to clients for hours or even days. Current IT environments cannot afford recurring problems or outages that take too long to repair. These outages can result in damage to a company’s reputation and limit the ability to remain competitive in the marketplace.
However, as systems become more complex, errors can occur anywhere. Some problems begin with symptoms that go undetected for long periods of time. Systems often experience “soft failures” (sick but not dead) that are much more difficult or unusual to detect. Moreover, problems can grow, cascade, and get out of control.
Many everyday activities can introduce system anomalies and initiate either hard or soft failures in complex, integrated data centers:
•Increased volume of business activity
•Application modifications to comply with changing regulatory requirements
•IT efficiency efforts, such as consolidating images
•Standard operational changes:
– Adding or upgrading hardware
– Adding or upgrading software, such as operating systems, middleware, and independent software vendor products
– Modifying network configurations
– Moving workloads (provisioning, balancing, deploying, disaster recovery (DR) testing, and so on)
Using a combination of existing system management tools helps to diagnose problems. However, they cannot quickly identify messages that precede system problems and cannot detect every possible combination of change and failure.
When using these tools, you might need to look through message logs to understand the underlying issue. But the number of messages makes this a challenging and skills-intensive task, as well as an error-prone task.
To meet IT service challenges and to effectively sustain high levels of availability, a proven way is needed to identify, isolate, and resolve system problems quickly. Information and insight are vital to understanding baseline system behavior along with possible deviations. Having this knowledge reduces the time that is needed to diagnose problems, and address them quickly and accurately.
The current complex, integrated data centers require a team of experts to monitor systems and perform the real-time diagnosis of events. However, it is not always possible to afford this level of skill for these reasons:
•A z/OS sysplex might produce more than 40 GB of message traffic per day for its images and components alone. Application messages can significantly increase that number.
•There are more than 40,000 unique message IDs defined in z/OS and the IBM software that runs on z/OS. Independent software vendor (ISV) or client messages can increase that number.
A.2 Introducing IBM zAware
IBM zAware is an integrated expert solution that contains sophisticated analytics, IBM insight into the problem domain, and web-browser-based visualization. It is an adaptive analytics solution that learns your unique system characteristics and helps you to detect and diagnose unusual behavior of z/OS images in near real time, accurately and rapidly.
IBM zAware introduces a new generation of technology with improved analytics to provide better results. It can process message streams that do not have message IDs, which makes it possible to handle a broader variety of unstructured data.
IBM zAware delivered on z13 provides the following capabilities:
•Support for Linux on z Systems message log analysis
•Support for native or guest Linux on z Systems images
•The ability to process message streams with no message IDs
•The ability to group multiple systems that have similar operational characteristics for modeling and analysis
•Recognition of dynamic activation and deactivation of a Linux image into a group and appropriate modeling and analysis
– Aggregated Sysplex view for z/OS and system views
– User-defined grouping
For Linux on z Systems, the user can group multiple systems’ data into a combined model by workload (one for all web servers, one for all databases, and so on), by “solution” (for example, one model for your cloud), and by VM host.
•Heat map display that provides a consolidated, aggregated, and higher-level view, with the ability to drill down to detail views
•Improved usability and GUI functional enhancements that address customer requirements
•Enhanced filtering and visualization, with better use of GUI space
•Improved UI navigation
•Display of local time in addition to Coordinated Universal Time
•Enhancements based on IBM One UI guidelines
•Enhanced analytics
•More robust data stores
•Expanded browser support with Mozilla Firefox 31 and Internet Explorer 9, 10, and 11
IBM zAware is designed to use near real-time continuous learning algorithms, providing a diagnostics capability that is intended to help you pinpoint problems, which in turn, can lead to better availability and a more efficient system. IBM zAware uses analytics to intelligently examine z/OS or Linux on z Systems messages to find unusual patterns, inconsistencies, and variations.
Large operating system environments can sometimes generate more than 25 million messages per day. This large volume of messages can make manual analysis time-consuming and error-prone when exceptional problems occur. IBM zAware provides a simple GUI and APIs to help you find message anomalies quickly, which can help speed problem resolution when seconds count.
IBM zAware and Tivoli® Service Management can be integrated using the zAware API to provide the following capabilities:
•Provide visibility into IBM zAware anomalies by using Event Management
•Improve mean time to repair (MTTR) through integration with existing problem determination and performance monitoring tools
•Identify system errors and eliminate subsequent occurrences through automation and more sophisticated analysis
A.2.1 Hardware requirements overview
IBM zAware runs on a client-visible logical partition (LPAR) with the following resources:
•Shared or dedicated Open Systems Adapter (OSA) port
•Shared or dedicated Integrated Facilities for Linux (IFLs) or central processors (CPs)
•Storage and memory
For more information, see A.4.2, “IBM zAware operating requirements” on page 481.
Figure A-1 shows how IBM zAware complements an existing environment.

Figure A-1 IBM zAware complements an existing environment
|
Statement of direction1: IBM intends to deliver IBM zAware support for z/VM. This future release of IBM zAware is intended to help identify unusual behaviors of workloads running on z/VM to accelerate problem determination and improve service levels.
|
1 All statements regarding IBM plans, directions, and intent are subject to change or withdrawal without notice. Any reliance on these statements of general direction is at the relying party’s sole risk and will not create liability or obligation for IBM.
A.2.2 Value of IBM zAware
Early detection and focused diagnosis can help improve the time needed to recover from complex z/OS problems. These problems can be cross sysplex, across a set of z Systems servers, and beyond central processing complex (CPC) boundaries. IBM zAware is enhanced to identify unusual system behavior of Linux on z Systems images running natively or as a guest on z/VM.
IBM zAware delivers sophisticated detection and diagnostic capabilities that identify when and where to look for a problem. The cause of the anomalies can be difficult to determine. High-speed analytics on large quantities of log data reduces the problem determination and isolation efforts, time to repair, and impact to service levels. They also provide system awareness for more effective monitoring.
Figure A-2 depicts how IBM zAware shortens the business impact of a problem.

Figure A-2 IBM zAware shortens the business impact of a problem
The IBM zAware GUI also provides quick drill-down capabilities. You can view analytical data that indicates which system is experiencing deviations in behavior, when the anomaly occurred, and whether the message was issued out of context. The IBM zAware GUI fits into existing monitoring structure and can also feed other processes or tools so that they can take corrective action for faster problem resolution.
A.2.3 IBM z/OS Solutions to improve problem diagnostic procedures
Table A-1 shows how IBM zAware compliments with other monitoring and problem determination tools.
Table A-1 Using IBM zAware with other monitoring and problem determination tools
|
Solution
|
Available functions
|
Rules based
|
Analytics/Statistical model
|
Examines message traffic
|
Self-
learning |
Method
|
|
z/OS Health Checker1
|
•Checks configurations
•Programmatic, applies to IBM and ISV tools
•Can escalate notifications
|
Yes
|
|
|
|
Rules based to screen for conditions
|
|
z/OS PFAa
|
•Trending analysis of z/OS system resources and performance
•Can start z/OS Runtime Diagnostics
|
|
Yes
|
|
Yes
|
Early detection
|
|
z/OS RTDa
|
•Real-time diagnostics of specific z/OS system issues
|
Yes
|
|
Yes
|
|
Rules based after an incident
|
|
Linux on z Systems health checker2
|
•Checks configurations
•Programmatic, applies to IBM and ISV tools
|
Yes
|
|
|
|
Rules based to screen for conditions
|
|
IBM zAware
|
•Pattern-based message analysis
•Self-learning
•Aids in diagnosing complex z/OS problems, including cross sysplex and problems that might bring the system down
|
|
Yes
|
Yes
|
Yes
|
Diagnosis before or after an incident
|
1 Included in z/OS.
2 Installable as RedHat Package Manager (RPM).
You can use IBM zAware along with problem diagnosis solutions that are included in z/OS with any large and complex z/OS installation with mission-critical applications and middleware.
|
Notes:
•IBM zAware uniquely analyzes messages in context to determine unusual behaviors.
•IBM zAware uniquely understands and tunes its baseline to compare against your current activity.
•IBM zAware does not depend on other solutions or manual coding of rules, and is always enabled to watch your system.
|
A.3 Understanding IBM zAware technology
IBM zAware creates a base model of system behavior by accessing prior system log (SYSLOG) and applying mathematical modeling on these logs. The base model is then used to compare with current SYSLOG for the monitored z/OS, and Linux on z Systems images. This helps in detecting unusual message pattern that might pinpoint deviations from normal system behavior, which improves real-time diagnostics. IBM zAware automatically manages the creation of the behavioral model that is used to compare current message log data from the connected z/OS and Linux on z Systems systems.
Figure A-3 depicts the basic components of an IBM zAware environment.
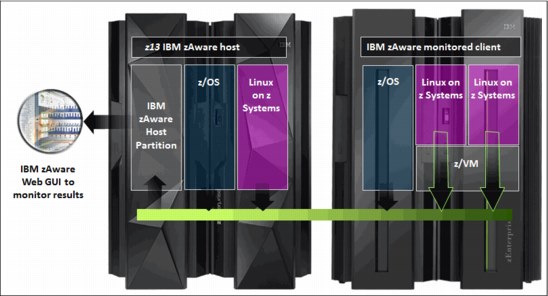
Figure A-3 Basic components of the IBM zAware environment
IBM zAware runs in an independent LPAR as firmware. IBM zAware has the following characteristics:
•Requires the z13, zEC12, or zBC12 configuration to have a priced feature code.
•Needs processor, memory, disk, and network resources to be assigned to the LPAR that it runs.
•Is updated like all other firmware, with a separate engineering change stream.
•Is loaded from the Support Element (SE) hard disk.
•Employs out-of-band monitoring with minimal effect on product workloads.
Figure A-4 shows IBM zAware Image Profile on the Hardware Management Console (HMC).

Figure A-4 HMC Image Profile for an IBM zAware LPAR
IBM zAware analyzes massive amounts of OPERLOG messages, including all z/OS console messages and ISV and application-generated messages, to build sysplex and LPAR detailed views in the IBM zAware GUI. Linux on z Systems images must be configured so that the syslog daemon sends data to IBM zAware. IBM zAware can create model groups based on similar operational characteristics for Linux images that run on z Systems.
Figure A-5 shows the IBM zAware Heat Map view.

Figure A-5 IBM zAware Heat Map view analysis
Figure A-6 shows a sample bar score view.

Figure A-6 IBM zAware bar score with intervals
The analytics create a statistical model of the normal message traffic that is generated by each monitored client (system or group of systems, such as z/OS or Linux on z Systems). This model is stored in a database and is used to identify out-of-the-ordinary messages and patterns of messages.
Using a sliding 10-minute interval that is updated every two minutes, a current score for the interval is created based on the uniqueness of the message traffic:
•A stable system requires a lower interval score to be marked as interesting or rare.
•An unstable system requires a larger interval score to be marked as interesting or rare.
For each interval, IBM zAware provides details of all of the unique and unusual message IDs within the interval. This data includes how many, how rare, and how much the messages contributed to the intervals score (anomaly score, interval contribution score, rarity score, and appearance count) when they first appeared. IBM zAware also helps in identifying messages with the following conditions:
•Whether the unusual message IDs are coming from a single component
•Whether the message is a critical z/OS or Linux kernel message
•Whether the messages are related to changes, such as new software levels (operating system, middleware, and applications) or updated system settings and configurations
IBM zAware detects conditions that typical monitoring systems miss because of these challenges:
•Message suppression (message too common): Common messages are useful for long-term health issues.
•Uniqueness (message not common enough): These messages are useful for real-time event diagnostic procedures.
IBM zAware assigns a color to an interval based on the distribution of interval score:
•Blue (Normal)
Interval score between 1- 99.5
•Gold (Interesting)
Interval score between 99.6 - 100
•Orange (Rare)
An interval score of 101
A.3.1 Training period
The IBM zAware server starts receiving current data from the z/OS system logger that runs on z/OS monitored clients and from Linux SYSLOG for Linux on z Systems monitored clients. However, the server cannot use this data for analysis until a model of normal system behavior exists.
The minimum amount of data for building the most accurate models is 90 days of data for each client. By default, training automatically runs every 30 days. You can modify the number of days that are required for this training period, based on your knowledge of the workloads that run on z/OS monitored clients. This training period applies for all monitored clients. Different training periods cannot be defined for each client.
A.3.2 Priming IBM zAware
Instead of waiting for the IBM zAware server to collect data over the course of the training period, you can prime the server. You do so by transferring prior data for monitored clients and requesting that the server build a model for each client from the transferred data. Currently, the bulk transfer of Linux historical data is not supported.
A.3.3 IBM zAware ignore message support
When a new workload is added to a system being monitored by IBM zAware or is moved to a different system, it often generates messages that are not part of that system’s model. Subsequently, these messages are flagged as anomalous and cause orange bars to appear on the IBM zAware analysis window.
Sometimes, the reporting of anomalous behavior is caused solely by the new workload, but sometimes a real problem is present as well. Therefore, it is not appropriate to automatically mark all the messages as “normal” when new workloads are introduced. IBM zAware on z13, zEC12, and zBC12 with Driver level 15 introduces the ignore message support to give you input into the IBM zAware rules. This function allows you to mark messages as “ignore.” An ignored message is not part of the IBM zAware interval anomaly scoring, although it appears in the output.
The first iteration of this work requires you to mark each message to be ignored on a per system basis. That is, for each message that you want to ignore, you must mark that particular message on each system for which IBM zAware is to ignore the message. You can choose from one of two types of ignore message: Until the next training period occurs (automatic or manual train) or forever.
A.3.4 IBM zAware graphical user interface
IBM zAware creates XML data with the status of the z/OS, Linux image, and details about the message traffic. This data is rendered by the web server that runs as a part of IBM zAware. The web server is available using a standard web browser (Internet Explorer or Mozilla Firefox).
IBM zAware provides an easy-to-use, browser-based GUI with relative weighting and color coding. For IBM messages, IBM zAware GUI has a link to the message description that often includes a corrective action for the issue that is highlighted by the message.
A.3.5 IBM zAware is complementary to your existing tools
Compared to existing tools, IBM zAware works with relatively little customization. It does not depend on other solutions or manual coding of rules, and is always enabled to watch your system. The XML output that is created by IBM zAware is consumed by existing system monitoring tools, such as IBM Tivoli OMEGAMON XE for z/OS and IBM Tivoli NetView® for z/OS, by using published APIs.
A.4 IBM zAware prerequisites
This section describes the hardware and software requirements for IBM zAware.
A.4.1 IBM zAware features and ordering
IBM zAware is available with IBM z13, IBM zEnterprise EC12 (zEC12), and zEnterprise BC12 (zBC12) models. IBM zAware feature-related definitions are listed in Table A-2.
Table A-2 IBM zAware feature code definitions
|
Name
|
Related feature code
|
Description
|
|
IBM zAware host system
|
FC0011
|
Represents the z13, zEC12, or zBC12 that hosts the IBM zAware partition. In most cases, the host server also has partitions on it that are being monitored. There can be multiple IBM zAware host partitions on one z13, zEC12, or zBC12, but there is only one IBM zAware FC0011 feature (no additional charge for multiple host partitions).
|
|
IBM zAware monitored client
|
|
Represents the z/OS partition that sends OPERLOG files for processing to an IBM zAware partition. Multiple z/OS partitions (monitored clients) can be on the server.
The clients can also include Linux running natively or as a guest on a hypervisor (z/VM)
|
|
IBM zAware environment
|
|
Represents the collection of the IBM zAware host system and the IBM zAware monitored clients that are sending information to the IBM zAware host system.
|
|
IBM zAware connection
|
FC0101 and so on1
|
Represents a set of central processors that are associated with servers that are either the IBM zAware host system or IBM zAware monitored clients.
|
|
Disaster Recovery (DR) IBM zAware server
|
FC0102 and so on2
|
Represents the z13, zEC12, or zBC12 with no-charge firmware to run IBM zAware in a disaster situation.
|
FC0101: IBM zAware CP 10 pack (z13, zEC12)
FC0138: IBM zAware CP 2 pack (zBC12)
FC0140: IBM zAware CP 4 pack (zBC12)
FC0142: IBM zAware CP 6 pack (zBC12)
FC0150: IBM zAware CP 10 pack (zBC12)
FC0102: IBM zAware DR CP 10 pack (z13, zEC12)
FC0139: IBM zAware DR CP 2 pack (zBC12)
FC0141: IBM zAware DR CP 4 pack (zBC12)
FC0143: IBM zAware DR CP 6 pack (zBC12)
FC0151: IBM zAware DR CP 10 pack (zBC12)
12.6.1 Feature on Demand (FoD)
Feature on Demand is a centralized way to flexibly entitle features and functions on the system. For example, Feature on Demand contains the IBM zEnterprise BladeCenter Extension (zBX) Model 004 High Water Marks (HWMs). HWMs refer to highest quantity of blade entitlements by blade type that the client has purchased. On the z196 and z114, the HWMs are stored in the processor and memory Licensed Internal Code (LIC) configuration code (LICCC) record. From zEC12 onwards, the HWMs are in the Feature on Demand record.
The IBM zAware feature availability and installed capacity are also controlled by the FoD LICCC record. The current IBM zAware installed and staged feature values can be obtained by using the Perform Model Conversion function on the SE or from the HMC by using a single object operation (SOO) to the server SE.
Figure A-7 shows the window for IBM zAware Feature on Demand status and value shown under the Perform Model Conversion, Feature on Demand Manage function.

Figure A-7 Feature on Demand window for zAware feature
There is only one Feature on Demand LICCC record installed or staged at any time in the system. Its contents can be viewed under the Manage window as shown in Figure A-7. A staged record can be removed without installing it. A Feature on Demand record can be installed only as a complete installation. There is no selective feature or partial record installation, and the features installed will be merged with the CPC LICCC after activation.
A Feature on Demand record can be installed only once. If it is removed, a new Feature on Demand record is needed to install it again. A remove action cannot be undone.
The IBM zAware host system feature code (FC 0011) must be ordered for the z13, zEC12, or zBC12 that hosts the IBM zAware partition.
You do not need to order IBM zAware connections for client systems. The number of IBM zAware connections to be ordered can be calculated by completing the following steps:
1. Determine which systems have z/OS images to be monitored by IBM zAware, including the z13, zEC12, or zBC12 where the IBM zAware LPAR resides.
2. Count the number of CPs on the systems that were identified in the previous step. Include banked CPs (HWM), and round up to the nearest factor of 10 (z13).
A disaster recovery option (IBM zAware DR CP packs) is also available and indicates that IBM zAware is installed on a DR z13, zEC12, or zBC12 server. This feature is available at no additional fee, but is exclusive to the IBM zAware connection.
For example, FC 0102 represents the quantity of DR CPs. FC 0101 represents the quantity of CPs associated with servers that are either the IBM zAware host system or the IBM zAware monitored clients. FC 0101 and FC 0102 are mutually exclusive. Therefore, if you have one, you cannot have the other. In addition, in most cases, the number of FC 0102 features on DR must match the number of FC 0101 features on the IBM zAware host server.
A.4.2 IBM zAware operating requirements
This section describes the components that are required for IBM zAware.
IBM zAware host system requirements
The z13, zEC12, or zBC12 can host the IBM zAware server. The IBM zAware server requires a dedicated LPAR and runs its own self-contained firmware stack.
|
Note: Host system resources (processors, memory, direct access storage device (DASD), and so on) depend on the number of monitored clients, amount of message traffic, and length of time that data is retained.
|
The following components are required:
•Processors
– General-purpose CP or IFL that can be shared with other LPARs in the z13, zEC12, or zBC12
– Usage estimates between a partial engine to two engines, depending on the size of the configuration
•Memory
– Minimum 4 GB initial memory for the first six z/OS clients
– 256 MB required for each additional z/OS client above the first six z/OS clients
– Flash Express is not supported
•Direct access storage devices (DASDs)
– 500 GB persistent DASD storage
– Only extended count key data (ECKD) format is supported
– Fibre Channel Protocol (FCP) devices are not supported
– IBM zAware manages its own data store
•Network (for both instrumentation data gathering and outbound alerting/communications)
– HiperSockets for the z/OS and Linux LPARs running on the same z13, zEC12 or zBC12 as the IBM zAware LPAR
– OSA ports for the z/OS LPARs running on a different CPC than where the IBM zAware LPAR runs and for browser access to GUI
– Dedicated IP address for IBM zAware LPAR
IBM zAware monitored client requirements
IBM zAware monitored clients can be in the same CPC as the IBM zAware host system or in different CPCs. They can be in the same site or multiple sites.
•Distance between the IBM zAware host systems and monitored clients can be up to a maximum of 3500 km (2174.79 miles).
•IBM zAware monitored clients can be on any z Systems servers (IBM z13, zEC12, zBC12, z196, z114, z10, and so on) if they fulfill Operating system requirements. Monitoring can be done by transmitting log files through an Internet Protocol network with IBM zAware servers.
Operating system requirements
IBM zAware monitored clients have the following z/OS requirements:
•Linux on z Systems (SUSE or Red Hat)
•z/OS V2.1 or higher
•z/OS V1.13 with PTFs
•Ninety days historical SYSLOG or formatted OPERLOG data to initially prime IBM zAware
A.5 Configuring and using IBM zAware virtual appliance
The following checklist provides a task summary for configuring and using IBM zAware:
•Phase 1: Planning
– Plan the configuration of the IBM zAware environment.
– Plan the LPAR characteristics of the IBM zAware partition.
– Plan the network connections that are required for the IBM zAware partition and each z/OS monitored client.
– Plan the security requirements for the IBM zAware server, its monitored clients, and users of the IBM zAware GUI.
– Plan for using the IBM zAware GUI.
•Phase 2: Configuring the IBM zAware partition
– Verify that your installation meets the prerequisites for using the IBM zAware virtual appliance.
– Configure network connections for the IBM zAware partition through the hardware configuration definition (HCD) or the input/output configuration program (IOCP).
– Configure persistent storage for the IBM zAware partition through the HCD or IOCP.
– Define the LPAR characteristics of the IBM zAware partition through the HMC.
– Define network settings for the IBM zAware partition through the HMC.
– Activate the IBM zAware partition through the HMC.
•Phase 3: Configuring the IBM zAware server and its monitored clients
– Assign storage devices for the IBM zAware server through the IBM zAware GUI.
– Optional: Replace the self-signed certificate authority (CA) certificate that is configured in the IBM zAware server.
– Optional: Configure a Lightweight Directory Access Protocol (LDAP) directory or local file-based repository for authenticating users of the IBM zAware GUI.
– Optional: Authorize users or groups to access the IBM zAware GUI.
– Optional: Modify the configuration values that control the IBM zAware analytics operation.
– Configure a network connection for each z/OS, Linux monitored client through the TCP/IP profile. If necessary, update firewall settings.
– Verify that each z/OS system meets the sysplex configuration and OPERLOG requirements for IBM zAware virtual appliance monitored clients.
– Configure the z/OS system logger to send data to the IBM zAware virtual appliance server.
– Configure the Linux SYSLOG to send data to the IBM zAware virtual appliance server.
– Prime the IBM zAware server with prior data from monitored clients.
– Build a model of normal system behavior for each monitored client.1 The IBM zAware server uses these models for analysis.
– Optional: Use the IBM zAware ignore message support to give your input to the zAware rules. It allows you to mark messages as “ignore.” An ignored message is not part of zAware analysis and scoring.
1 For Linux on z Systems, model groups are defined based on host names. Models are built with available data for systems matching the model group definition.
..................Content has been hidden....................
You can't read the all page of ebook, please click here login for view all page.