
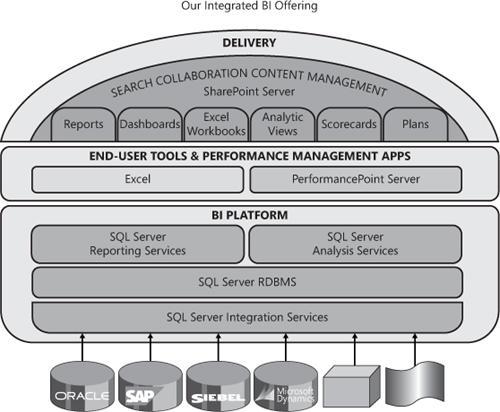
As discussed earlier in the chapter, Microsoft provides a number of BI offerings ranging from SQL Server Analysis Services (SSAS) to PerformancePoint Server 2007. Figure 3-17 provides an overview of the different BI offerings from Microsoft. You can see from this figure that the BI components within MOSS 2007 (SharePoint Server in the figure) comprise a number of different options, including reports, dashboards, Excel workbooks, and so on. MOSS also represents the primary entry point and delivery mechanism for the BI offerings that are located beneath the SharePoint layer.
Because we’re discussing Office Business Applications in this chapter, we’ll focus on those BI features built into Microsoft Office SharePoint Server 2007 (Enterprise edition). Specifically, we’ll discuss Excel Services, key performance indicators (KPIs), and the Business Data Catalog, all represented through the creation of a top-level BI dashboard.
The MOSS Reports Center dashboard is a critical component of any BI solution. It is a new Enterprise Site Template that facilitates the storage and management of BI content artifacts like Office Data Connections, KPI definitions, reports (both Excel and SSRS reports), dashboards created using Excel Services, and report schedules. It provides you with a view into your business data and ideally provides you with a way to filter and manage your data to enable decisions for specific scenarios, for example, filter fiscal year historical data to create next year’s forecasts. MOSS 2007 makes it easy to build a dashboard.
To do so, click Reports on your site, and then New Dashboard. This will prompt you to complete some properties for your dashboard, like the name of the dashboard and the layout. Figure 3-18 illustrates the New Dashboard page. After you’ve filled in the properties, click OK. This creates your dashboard.

At this point, you can edit the existing Web parts and add new ones to the portal. Depending on your properties, you will have a set of default Web parts added to the site already. Figure 3-19 illustrates the dashboard created—a simple Publication Business Intelligence dashboard that will help report on some book sales data. You can see here that there is a KPI Web part and a couple of Excel Web Services Web parts, both of which will be discussed later in this chapter. In both cases, open the tool pane to edit these Web parts. Also notice that you can add either custom HTML code or rich text to the top of the dashboard to provide some explanatory context around the dashboard. You can also add profile information and allow other people (for example, team members or managers) to be able to view your portal as well. When you’ve finished with all of your customizations, you then click Publish and all of your changes will be saved and published to your SharePoint site.
For my BI dashboard, illustrated in Figure 3-20, I included a number of different Web part types. For example, I wanted to provide some context for my dashboard, so I added a content Web part to the top of my dashboard. I used the rich text editor and simply added some text. Because the content Web part was a default part of my dashboard, I only had to open the tool pane and then click Rich Text Editor to edit the content part.
I next wanted to add some sales KPIs to indicate which books I manage are doing well versus ones that are not doing well. You can see the KPI indicators display a red diamond where sales are lagging and a green orb where sales meet or exceed expectations. I’ve also added an Excel Services Web part to provide a quick chart view into the book sales data. I’ve also got a couple of other Web parts, one with my profile information and another with some contextual information about the dashboard. You could choose to keep these types of Web parts included, which again were default Web parts within my dashboard, within your dashboard or make your dashboard entirely data-centric.

Let’s now turn to talking more in detail about Excel Services, KPIs, and the Business Data Catalog.
Excel Services represents a smart front end to worksheets that you’ve uploaded to your SharePoint site. You might think of Excel Services comprising three main parts, Excel Calculation Service, Excel Web Service, and Excel Web Access. The Excel Calculation Service loads the spreadsheets published to MOSS, calculates them, refreshes external data, and maintains session state for interactivity. This is the heart of Excel Services. The Excel Web Services provides programmatic access to the Excel Calculation Services. It is a Web service hosted in SharePoint. You can use methods in this Web service to develop custom applications that incorporate calculations performed by Excel Services and to automate the refreshing of Excel spreadsheets. Excel Web Access is a Web part in SharePoint that performs the "rendering" of Excel Workbooks on a Web page. This is perhaps the most visible component for the end user. You can use it like any other Web part in SharePoint to create a wide range of Web pages.

Excel Services ships with MOSS 2007 Enterprise edition and offers a thin client browser rendering of Excel Workbooks published to MOSS, and exposes Web service interfaces that enable using Excel Formulas and Calculation Services from within custom client applications. Let’s take a look at how we can create a view into our business data using Excel Services.
Figure 3-21 illustrates a worksheet created to track book sales. This maps to the dashboard, which manages a specific set of (very much theoretical) books that track as part of a phantom portfolio. The worksheet comprises two objects: a table and a chart. This is what I would call a static worksheet; that is, I’ve manually entered data into the worksheet to run business calculations. However, you could develop customizations into your worksheet using VSTO or map data to the spreadsheet (as we discussed earlier in the chapter), and this would provide you with a more dynamic experience where you are exposing more centrally located and fresh data.
The goal now, then, would be to create a thin client view into this business data within our Excel Services Web part. To do this, you first have to upload the worksheet to a library on your SharePoint site. I would recommend having a document library tied to your Reports Center (i.e., your dashboard) that is specifically dedicated to sales sheets like these. For those who are familiar with MOSS, this is a very simple action. You merely navigate to the document library and click Actions, Upload, and then browse to the worksheet, and then click OK.

After you have your worksheet uploaded to the document library, it is important to remember that to expose the objects from your worksheet within the Web part, you must publish them to Excel Services first. To do this, open the document library where your worksheet was uploaded, click the document, and select Edit Document. This will open an instance of the document. You then click the Office button, Publish, and then Excel Services. In the resulting Save dialog box, select Excel Services Options. It is here where you select which parts of the worksheet you want to expose. In my case, I’ve selected to expose only the sales chart, which was called Chart1.
After you’ve selected the objects you want to expose in the Excel Services Web part, click Save. You can now go to your dashboard and configure the Excel Services Web part to point to the object you have published to Excel Services.
The last step, then, is to expose the published object in your Excel Services Web part. To do this, open the dashboard and click Edit Page. This will open the dashboard page in Edit mode.
For the Web part that you want to configure, open the tool pane and then provide a link to the Excel spreadsheet and a name for the object (in my case this was Chart1) that you want to expose. There are other properties that you can set, such as the name of the object in the Web part, dimensions for the Web part, and so on. After you’ve completed configuring the Excel Services Web part, click OK and the Web part will refresh with the object you’ve chosen to expose.
Another aspect of business intelligence within your OBA is the ability to surface and track key metrics through KPIs. KPIs are metrics that allow you to gauge the health of a particular item within your project or business. In the dashboard created earlier, I use them to provide indicators of how well the books in my phantom portfolio are selling: a red flag indicates the books are selling below expectation, a yellow flag indicates a warning, and a green flag indicates that the books are meeting or are above sales expectations. They could equally be applied to many other variables.
The nice thing about KPIs is that you can create them quickly, and they can serve as a good view into the performance of business data. Thus, KPIs are good for executive and managerial reporting—or reporting at the top level of a dashboard. For deeper-level business reporting, you would want to use other features of MOSS (for example, Excel Services).
To create a KPI list, navigate to your dashboard. In my dashboard, the KPI list is a default Web part, so I just needed to configure it. You add the KPI list by clicking Site Actions, Site Settings, and then Modify All Site Settings. In the Site Administration of the Site Settings page, click Site Libraries and Lists. Click the Create New Content link, and in the Custom Lists column select KPI List, provide properties for the list, and then click Create.
After you create the KPI list, map the KPI Web part to the business data on which you want to report in three ways. The first is by creating the KPI values manually. The second is to map them to a SharePoint list. And the third is to tie them to values in an Excel 2007 spreadsheet. To select one of these options, in your KPI list select New and then select the appropriate choice that maps to one of the three options mentioned.
To create a KPI using manually entered data is the easiest of the three ways. However, the values are obviously static, so you may need to update them on a regular basis. Oftentimes I’ll use the manual KPIs for metrics that don’t change often (for example, quarterly report snapshots), or capture longer intervals of tracking, so managing them is less costly to me. Figure 3-22 illustrates how you define the values for the manual KPI. Essentially you enter the appropriate values for the different KPI indicators and then click OK.

For more dynamic reporting, or reporting that may be mapped back to an algorithm, project status, or central data source, I like to use KPI lists that either map to a spreadsheet or a SharePoint list. In either case, when you configure your KPI list you need to provide a link to the list or spreadsheet and provide a mapping to the values that will create your KPIs. Figure 3-23 illustrates the mapping of the KPI list to an Excel 2007 spreadsheet. Using this type of KPI list, you can either add the mapping of the indicator values directly into this form or you can invoke an alternate form (Figure 3-24) that enables you to select the specific cell that then maps to a specific indicator.
The final result of this type of mapping, then, is that the indicator values of the KPI rely on the values to which they map in the Excel 2007 spreadsheet. Referring back, Figure 3-20 illustrates an example of what results from this process. I would definitely recommend using KPIs as part of your OBA business intelligence solution. This is because oftentimes you need high-level views for those who may not be familiar with the details of your project or business data. KPIs are not only very good for this, but similar to Excel Services, they require very little coding and are straightforward to configure. Let’s finish off this part of the chapter by discussing the Business Data Catalog.

A very important part of the OBA is the ability to integrate line-of-business systems with your Office customizations in the client and in SharePoint. This might mean connections to SQL Server databases or larger systems such as SAP, PeopleSoft, or Microsoft Dynamics. Several services within SharePoint are supported through the Business Data Catalog (BDC), which are listed as follows:
Business Data List Web part
The most commonly used Web part. It displays data (or, more precisely, a list of instances for a specific entity) that is registered in the Business Data Catalog.
Business Data Related List Web part
Displays related data for which there exists an association with data registered in the Business Data Catalog.
Business Data Item Web part
Displays details for a particular entity instance.
Business Data Actions Web part
Displays the actions that can be performed for a specific entity instance.
Business Data Item Builder Web part
A normal SharePoint page on which details are displayed through a programmatic call and passing of query string information and identifier information.

The BDC essentially integrates LOB systems with MOSS 2007 through an abstracted XML layer. The XML layer, called the application definition file (ADF) defines and describes how the BDC Web part will integrate with the LOB system. For example, the ADF will define the entities within the data source and the SQL queries that are supported through the connection with the LOB system data. The BDC can further integrate with the LOB system data source through either an ADO.NET-supported connection or a Web service proxy, thus supporting integration with custom Web services in PeopleSoft, SAP, and other large-scale ERP systems—or your own custom Web services.
The creation of ADFs was once cumbersome because the developer had to hand-code the XML; however, today there are tools that allow the developer to more easily create the ADF file. You can find in the MOSS SDK a tool called the Microsoft Business Data Catalog Definition Editor. Using the Microsoft BDC Definition Editor, you can create and edit metadata for OBAs. You can use the Business Data Catalog Definition Editor to connect to LOB systems via Web services or databases. After you create and configure an instance of the LOB in the tool, you export the ADF and save it as an XML file. You can then add the XML file to the Business Data Catalog. You can also import an existing application definition file and edit that file by using the tool.
There are also other tools that developers can use, such as the BDC Meta Man or Simego’s MOSS BDC Design Studio. Either way, these tools support much easier creation of the ADF, which is just plain good for the developer. Given these tools abstract the ADF, I will not spend time in this book going over the actual XML structure of the ADF; rather, I will walk through how you can use the Microsoft BDC Definition Editor to create the ADF and then show you how you import the ADF into a BDC Web Part.
To begin with, you must make sure that you’ve installed the MOSS 2007 SDK. You can download this SDK from the following link:
After installing the SDK, you must then install the Microsoft BDC Definition Editor. To do this, open Windows Explorer and navigate to the following folder: ...Program Files2007 Office System Developer ResourcesTOOLSBDC Definition Editor. To install, click setup.exe.
After you’ve installed and opened the tool, your default view will display any existing connections you have created. Figure 3-25 illustrates this view and shows the type of information that is displayed within the tool. In this instance, there is an existing connection to a simple Budget database, so let’s go ahead and add an LOB system (or ADF) for the pubs database that is being used in this example.
The first thing we need to do is to click Add LOB System and then select Connect to Database. This will prompt you with a dialog box in which you must enter the connection string to the database. The connection string I entered is as follows: Data Source=<servername>;Initial Catalog=<database>;Integrated Security=True.
After you’ve entered the connection string, you can use the designer to add tables to the connection (see Figure 3-26). Because we’re discussing business intelligence in this chapter, I added the table Sales to the designer. In practice, you might create relationships among tables and then add specific methods or filters, but I wanted to keep things simple to illustrate the process.
After you add a table, click OK. Note that you can also connect to a Web service in the designer and also define the ADF in much the same way you do the database connection. This is discussed more in Chapter 4.
After you click OK, the BDC Definition Editor takes you back to your default view and generates a taxonomy view of the definition. In this view, you can now test the connection by executing methods against the tables.


To test my connection, I’ve selected the FindAll_sales_Instance, which selects all of the sales and their associated store IDs, order numbers, and title ID, which is a straightforward "SELECT *" query. And while the results view does not include much information other than returned data, it does provide a good test of whether the connection will succeed and the results that are returned from the execution of this definition. Figure 3-27 illustrates this view.

Hopefully, the testing of your connection will have been similarly successful because the next step is to export the definition. To do this, select the root node of the LOB instance and click Export. In my case, the root node is LOB_Book_Sales. This will export the ADF file to a location you select.
After you export the file, you can now import the ADF into SharePoint and associate that ADF with a specific BDC Web part. To do this, navigate to your SharePoint Administration page by clicking Start, All Programs, Microsoft Office Server, and then SharePoint 3.0 Central Administration.
In the left-hand navigation, click your Shared Services. Under the Business Data Catalog, click Import Application Definition. You can then browse to your ADF and then click Import. During the import process, SharePoint will validate the XML definition file against a master BDC XSD, and if there are any errors the import will fail with a specific line number where the failure occurred. Conversely, you’ll be notified if the import is a success. Click OK on the Application Definition Import Success page to complete the process.
At this point, you have now successfully imported the ADF, so the last remaining step is to associate the entity definitions with a specific BDC Web part. The view for your database entities automatically invokes after you complete the import process, so navigate to Business Data Catalog Applications to view the definitions available for your use. In my case, I’ve got three definitions imported in my sandbox environment. Notice that LOB_Book_Sales is among them in Figure 3-28.

To add the ADF, navigate to where you want to add your BDC Web part. In my case, I added the BDC Web part to my Book Sales dashboard. Once you’ve navigated to where you want to add the Web part, click Site Actions and Edit Page.
You can now click Add a Web Part, which invokes the Add Web Parts dialog box. Select the Business Data List Web Part and click Add.
With the BDC Web part added, you need to open the tool pane and then associate the definition with the Web part. You can see in Figure 3-29 the new BDC Web part that displays the sales data from the pubs database.
There are many more types of customizations that you can develop using MOSS 2007, and I encourage you to set up your own sandbox environment for a couple of reasons. First, this will give you some experience in setting up the MOSS environment. And second, you’ll have your own environment to explore all of the features of SharePoint.
