
One of the best selling points of Flex Builder is the integrated GUI debugger. FDB is free, but for day-to-day debugging, Flex Builder’s debugger makes it much easier to debug applications.
A default Flex Builder installation (see Figure 18-2) will configure the tasks needed to get you up and running for debugging applications. To debug an application you are working on, you just need to select Run→Debug from the main menu (or press F11). This will compile the application if it is not already compiled, launch it within the browser, and connect the application to the debugger. The first time you debug an application you will be prompted to switch perspectives to the debugging perspective in Flex Builder, which usually is recommended.
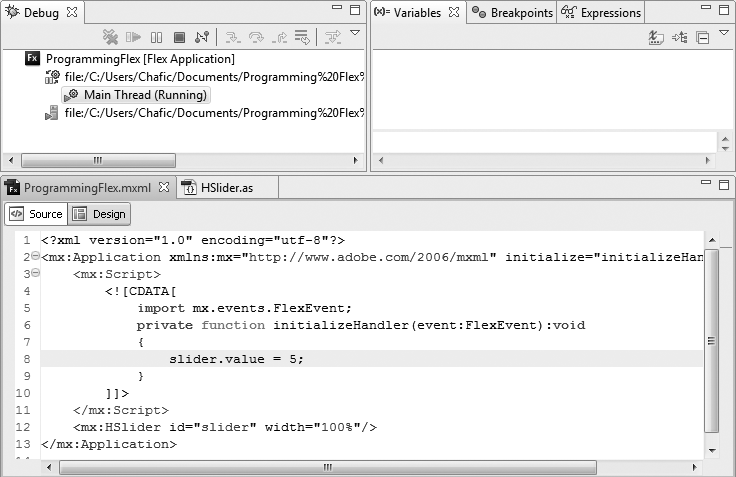
When in the debugging perspective, you will have access to the currently running application. Often you will set a breakpoint to stop the application at a point during the execution process in which you are interested. You can set breakpoints by double-clicking the left margin of a source line or by using the keyboard shortcut Ctrl-Shift-B. You can do this during a debug session or even before a session is started in the development perspective. You can navigate through a list of breakpoints by using the Breakpoints panel (see Figure 18-3). The Breakpoints panel contains a list of all breakpoints currently set and lets you navigate directly to a breakpoint or disable a breakpoint. This panel can also be very useful if you aren’t sure what breakpoints you have set in your application as it allows you to view all breakpoints and manage them from one central location.

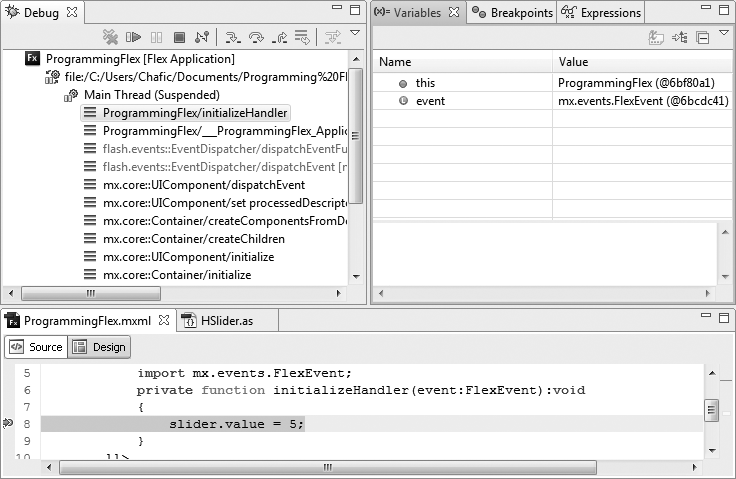
When Flash Player encounters a breakpoint, as in Figure 18-4, execution will halt, the debugger will gain focus, and the call stack will be displayed. You then will have the option of having the application continue execution, step through code, set variables, or evaluate expressions.
Note
Breakpoints can be set on both ActionScript and MXML code. Breakpoints on MXML code are valid only when ActionScript event handlers exist. In cases where you set a breakpoint on an invalid MXML line, Flex Builder will attempt to find the nearest valid breakpoint. It does so by scanning the next 10 lines of execution for points where a breakpoint would be valid, and automatically moving the breakpoint to that location.
To help speed up the debugging process, Flex Builder offers the following default keyboard shortcuts for stepping through code:
Stepping into (F5)
Stepping over (F6)
Step return (F7)
Resume execution (F8)
While stepping through code, the debugger will have control over the player. At times, this may cause the player and browser to seem unresponsive. This is normal as you step through code. To suspend the debugger from having control until the next breakpoint, you have to tell the debugger to resume execution by clicking on the Play button or by using the F8 keyboard shortcut.
While debugging, you also have the ability to review values of variables. The Variables panel (see Figure 18-5) will list all object instances as well as their child properties and values. You can also review the values of variables right within the code editor by hovering above a variable within the code. This will display a tool tip with the current value of the variable. To change a value, click the Value column for the field that you wish to change, as shown in Figure 18-6, or right-click the property you wish to change and select Change Value.

Changing variables will often result in other variables changing as well. To give you insight into the changes that occur as a result of changing a variable, the Variables panel will highlight in yellow the affected variables in the panel.
Note
When debugging an application, you also have the ability to set breakpoints in and step through Flex framework code. Stepping through Flex framework code will happen automatically when encountered. To set breakpoints within the framework, you will need to open the class file. An easy way to do this is to use the shortcut Ctrl-Shift-T within Flex Builder and select the appropriate type. Once the class file is opened, you can set breakpoints as you would normally.
To end a debug session you can either close Flash Player or your browser, or click the red square within the Debug panel. Caution should be taken when closing an active debug session by closing the browser when it is executing within a browser, as sessions that are in a halted state can cause a web browser to close unexpectedly.
This book does not fully cover all the functionality possible with the debugger within Flex Builder. For full coverage, you can review the documentation provided with Flex Builder.