Chapter 20. Monitoring the Iteration Plan
“Facts are better than dreams.”
—Winston Churchill
In addition to tracking progress toward the high-level goal of a release, it is always helpful to track the development team’s progress toward completing the work of a single iteration. In this chapter, we’ll look at the two tools for iteration tracking: the task board and iteration burndown charts.
The Task Board
A task board serves the dual purpose of giving a team a convenient mechanism for organizing their work and a way of seeing at a glance how much work is left. It is important that the task board (or something equivalent to it) allow the team a great deal of flexibility in how they organize their work. Individuals on an agile team do not sign up for (or get assigned) work until they are ready to work on it. This means that except for the last day or two of an iteration, there typically are many tasks that no one has yet signed up for. A task board makes these tasks highly visible so that everyone can see which tasks are being worked on and which are available to sign up for. An example task board is shown in Figure 20.1.
Figure 20.1. A task board in use during an iteration.

The task board is often a large whiteboard or, even better, a corkboard. Taped or pinned to the task board are the story cards as well as the task cards that were written during iteration planning. The task board includes one row for each story or feature that will be worked on during the iteration. In Figure 20.1, the first row contains information about the five-point story. The first column of the task board holds the story card. Because the story card shows the point estimate assigned to the story, anyone looking at the task board can quickly determine the number of story points for each story included in the iteration.
The second column holds all of the task cards that the team identified as necessary to implement the story or feature. Each of these cards shows the estimate of the work remaining to complete the task.
The third column indicates whether the acceptance tests are ready for the story. I am a big fan of test-driven development (Beck 2002), both at the code level, where I encourage developers to write a failing unit test before writing code, and at the feature level, where I encourage teams to design high-level acceptance tests before they begin coding. If the conditions of satisfaction for each story were identified as part of iteration planning (as advised in Chapter 14, “Iteration Planning”), this is easy, as the conditions of satisfactions are essentially a user story’s high-level acceptance tests. This type of specification by example is very beneficial for the programmers, as they can refer to specific examples of how each function and business rule is expected to work.
I have teams put a big checkmark in the Tests Ready column when they have specified the high-level tests for a story. Further, I encourage teams not to move many cards to the fourth column, In Process, unless the tests are specified. You may not need a Tests Specified column, but it’s a useful, visible reminder to a team that is trying to become accustomed to specifying acceptance tests before coding a feature.
The In Process column holds cards that developers have signed up for. Typically, a developer takes a card from the To Do column, puts her initials on it, and moves it to the In Process column. This happens throughout the day as developers are finishing work and selecting what they’ll work on next. No one should sign up for more than one or two cards at a time. This helps maintain a consistent flow of work through the process and reduces the cost of context switching among multiple tasks. As a constant reminder of this, when I have a team set up their task board I have them make the In Process column the width of one card. The To Do column is typically wider (and wider than shown in Figure 20.1) because cards are often taped four across there.
The To Verify column is another that you may or may not need but that I find useful, especially when working with a team that is learning how to become agile. Ideally, each test activity is thought of and a task card written during iteration planning. If so, when a programming task card (“Code the boojum user interface”) is finished, it is removed from the task board (or moved to a final column called Done). At that time, someone can sign up for the associated test card (“Test the boojum user interface”). However, I find there are times when a developer considers a task card done but would like a fresh pair of eyes to take a quick, verifying look. In those cases, and when there is no associated test task, the task card is placed in the To Verify column.
The developers are encouraged to change the estimate on any task card on the board at any time. For example, if I start working on a card and realize that the estimate of two hours on it is wrong, I will go over to the task board, cross out the two, and replace it with perhaps a six. If I believe the estimate is even further off, I may rip up that task card and replace it with two or three task cards, each with its own estimate. The final column on the task board is simply a sum of the hours of work remaining on the feature or story. I usually sum the hours for each row every morning. I use these totals to draw an iteration burndown chart, which is the second tool for tracking the progress of an iteration.
Many teams, when they begin the transition to an agile development process, are faced with a large number of legacy bugs. Not only is there usually a large backlog of bugs to be fixed “someday,” but also bugs continue to come in at a rapid rate. A common challenge for teams moving to an agile process is how to deal with these bugs. The task board provides a convenient mechanism for starting to correct this problem.
As an example of how the task board can help, suppose the product owner includes “Fix ten ‘high’ bugs” in the new iteration. The product owner selects the ten bugs, and the developers write a task card (with an estimate) for each. The cards are taped in the To Do column of a row on the task board. As the iteration progresses, the developers work on the ten bugs in the same way they work on other task cards. Now suppose a user finds a new bug halfway through the iteration. If the new bug is considered a higher priority than one or more bug remaining in the To Do column, the product owner can swap out an equivalent amount of bug fixing work in favor of fixing the new bug.
This approach allows a team to correct legacy defects at whatever rate the product owner chooses. The team could allocate 40 hours to bug fixing, or they could allocate 100 hours. The product owner selects how much of an iteration should be directed toward bug fixing rather than new feature development. The product owner and team then collaboratively select which bugs fit within that amount of time.
Iteration Burndown Charts
Drawing a release burndown chart is a great way to see whether a project is going astray or not. Depending on the length of your iterations, it can be useful to create an iteration burndown chart. If you’re using one-week iterations, it probably isn’t necessary. By the time a trend is visible on an iteration burndown chart, a one-week iteration will be over. However, I’ve found iteration burndown charts to be extremely useful with iteration lengths of two weeks or longer. An iteration burndown chart plots hours remaining by day, as shown in Figure 20.2.
Figure 20.2. An iteration burndown chart.
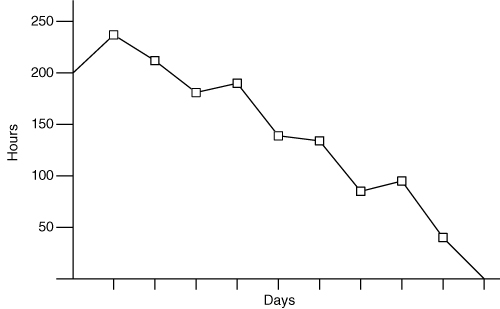
To create an iteration burndown chart, simply sum all of the hours on your task board once per day and plot that on the chart. If the team’s task board is drawn on a whiteboard, I usually draw the iteration burndown by hand on one side of the task board. If the task board is on a corkboard, I tack a large piece of paper to the corkboard and draw the burndown chart on it.
Tracking Effort Expended
In the previous chapter, the analogy of a project as a sailboat was introduced to make the point that a sailboat’s progress is not always easily measured. A sailboat that sailed for eight hours yesterday and then anchored may or may not be eight hours closer to its destination. Wind and current may have pushed the sailboat off what was believed to be its course. The boat may be closer to or farther from its destination. When this is the case, the most useful thing the crew can do is assess where they are relative to the destination. Measuring the distance traveled or time spent traveling are not helpful if we’re not sure all progress was in the right direction.
On a project, it is far more useful to know how much remains to be done rather than how much has been done. Further, tracking effort expended and comparing it with estimated effort can lead to “evaluation apprehension” (Sanders 1984). When estimators are apprehensive about providing an estimate, the familiar “fight or flight” instinct kicks in, and estimators rely more on instinct than on analytical thought (Jørgensen 2004).
Tracking effort expended in an effort to improve estimate accuracy is a very fine line. It can work (Lederer and Prasad 1998; Weinberg and Schulman 1974). However, the project manager or whoever is doing the tracking must be very careful to avoid putting significant evaluation pressure on the estimators, as doing so could result in estimates that are worse rather than better.
Additionally, keep in mind that variability is a part of every estimate. No matter how much effort is put into improving estimates, a team will never be able to estimate perfectly. Evidence of this is no further away than your morning commute to work. There is an inherent amount of variability in your commute regardless of how you travel, how far you must go, and where you live. If you drive to work, no amount of driving skill will eliminate this variability.
Individual Velocity
Some teams refer to individual velocity as the number of story points or ideal days completed by an individual team member. Do not track individual velocity. Tracking individual velocity leads to behavior that works against the success of the project. Suppose it has been announced that individual velocity will be measured and tracked from iteration to iteration. How do you think individuals will respond? If I am forced to choose between finishing a story on my own and helping someone else, what incentive does measuring individual velocity give me?
Individuals should be given every incentive possible to work as a team. If the team’s throughput is increased by my helping someone else, that’s what I should do. Team velocity matters; individual velocity doesn’t. It’s not even a metric of passing interest.
As a further argument against measuring individual velocity, you shouldn’t even be able to calculate it. Most user stories should be written such that they need to be worked on by more than one person, such as a user interface designer, programmer, database engineer, and a tester. If most of your stories can be completed by a single person, you should reconsider how your stories are written. Normally, this means they need to be written at a higher level so that work from multiple individuals is included with each.
Summary
A task board—which is often a whiteboard, corkboard, or just a designated space on a wall—helps a team organize and visualize their work. The columns of a task board are labeled, and team members move task cards through the columns as work progresses.
An iteration burndown chart is similar to a release burndown chart but is used to track only the work of the current iteration. It graphs the number of hours remaining on the vertical axis and the days of the iteration on the horizontal axis.
Teams should be reluctant to track the actual hours expended on tasks to get better at estimating. The risks and the effort to do so usually outweigh the benefits.
Teams should not calculate or track individual velocity.
Discussion Questions
1. In your organization, would the benefits of tracking the actual effort expended on tasks and comparing these with the estimates outweigh the risks and costs of doing so?
2. If your current project team is not collocated, what can you do to achieve some of the same benefits that collocated teams experience when using a task board?