
4.4 Artificial intelligence applications
This section considers some specific possibilities of artificial intelligence applications to the development of principles and tools of automatic emergency control in EPS.
4.4.1 Forecast of state variables based on the dynamic state estimation method
DSE is used to forecast the state vector components. The DSE is based on the extended Kalman filter. The state vector is used to calculate all state variables. Forecasting all state vector components some time ahead makes it possible to forecast the values of all state variables. Forecasting of state vector components is considered as DSE if there are no new measurements.
The values of forecasts of all state vector components are calculated by the equation:
The forecast error ![]() in the first forecasting cycle is determined by the equation:
in the first forecasting cycle is determined by the equation:
where ![]() —estimates of state vector components. In the subsequent snapshots the forecast error is calculated by the equation:
—estimates of state vector components. In the subsequent snapshots the forecast error is calculated by the equation:
where ![]() —the forecast of state vector components.
—the forecast of state vector components.
The forecast accuracy is determined according to the following equation

where k—the number of snapshots and ϕF is the average error for forecasting the voltage magnitude and phase angle with regard to estimates of the total number of snapshots.
The extended Kalman filters were tested on the schemes with the 7 (Fig. 11), 33, and 100 nodes.

The archives of measurements were created for these schemes. The estimates of state variables for each scheme were obtained based on the formed snapshots through the DSE on the basis of the extended Kalman filters. Fig. 12 shows the results of the error forecast and filtering in the voltage magnitude measurement at node 1.

DSE with application of the Kalman filter can be used to forecast all the EPS state variables for a short period of time. The regular filter adjustment improves the forecast quality. Measurements from PMU improve the forecast results.
4.4.2 Forecast of power system parameters based on a hybrid data-driven approach
A novel hybrid data-driven approach has been developed for forecasting EPS parameters (e.g., load, distributed embedded generation, wind energy, and distributed storage) to improve grid operation efficiency and reduce fossil fuel consumption and carbon emissions. The main goal of the hybrid forecasting approach development was to increase the efficiency of forecasting studies when dealing with limited retrospective data and a sharply variable, nonstationary time series of EPS parameters.
The proposed approach is based on mode decomposition and a feature analysis of initial retrospective data using the Hilbert-Huang transform and machine learning algorithms. The random forests and gradient boosting trees learning techniques were examined. The decision tree techniques were used to rank the importance of variables employed in the forecasting models. The Mean Decrease Gini index is employed as an impurity function. The resulting hybrid forecasting models employ the radial basis function neural network and support vector regression.
Fig. 13A shows a general forecasting scheme with five main blocks. Data collection is performed by the SCADA system, which merely identifies a set of EPS parameters. The second block preprocesses input data with HHT. HHT is a two-step algorithm; combining empirical mode decomposition (EMD) and the Hilbert transform (HT). After the HHT was employed, through EMD and HT, the sets of intrinsic mode functions (IMFs), instantaneous amplitudes, and frequencies are obtained. These sets are used as input values to the next block for feature selection and dimensionality reduction. In this block, learning methods are used—random forest and boosting trees to rank a variable's importance [107,108]. SVM and ANN forecasting models with nonlinear optimization algorithms are employed in the next block for optimal selection of parameters. The last block is used for testing and a comparison of obtained forecasting models. As a result, an HHT-ANN-SVM-based forecasting system will be able to predict EPS parameters.

The novel hybrid approach is realized in STATISTICA 6.0 and MATLAB. The efficiency of the developed approach is demonstrated with a real-time series in the following electric power problems: active power flow forecasting for the western Baikal-Amur mainline (Russia) [109,110], electricity price forecasting for the Australian and Nord pool spot (EU) power markets [111], and wind speed forecasting for the Valentia region (Ireland) [84].
The Baikal-Amur mainline external power supply is carried on the 110 kV power network (from Taishet to Lena substations) and the 220 kV power network (from Lena to Taksimo substations). Continuous and random changes in time traction load and the presence of a two-way feed greatly complicates the forecasting of state variables.
The initial training data is represented by the telemetric data of the minute-by-minute active power flow for 3 days (4320 values). The initial time series were converted using the HHT algorithm. The obtained HHT components are used as input values of the trained machine learning-based forecasting models. The multilayer perceptron (MLP) neural network model is trained with the Broyden-Fletcher-Goldfarb-Shanno algorithm [112]. The radial basis kernel function is used in the epsilon-SVM regression model. Using a 10-fold cross-validation method, the following optimal training constants and kernel parameters were determined: the capacity constant, C = 10; epsilon, ɛ = 0.4; and degree, γ = 0.001. To compare the performance of forecasting approaches, the authors also calculated similar forecasts based on conventional approaches: ARIMA, single ANN, and multiplicative exponential smoothing.
Table 6 and Fig. 13B summaries the numerical results for a “1 min ahead” active power flow forecasting on based on the HHT-ANN and HHT-SVM models. As the table shows, the most accurate forecast was given by the hybrid HHT-SVM and HHT-ANN models (MAPE—11.6% and 12.5% respectively), compared with the conventional approaches: the ANN model—15.8%, the ARIMA model—22.4%, and exponential smoothing—32.2%.

4.4.3 Total transfer capability estimation method
TTC estimation means the calculation of the steady state with TTC in the controlled lines and with the parameters of current conditions in the remaining part of the EPS. The values of flows in the controlled lines change through the adjustment of EPS state variables determined in advance. The state of the resultant EPS operating conditions ![]() is estimated using the measurements of the current operating conditions
is estimated using the measurements of the current operating conditions ![]() and ideal power flow limits in terms of static stability or thermal stability of each controlled line. Further, these values will be referred to as the PMs of TTC (PTTC PM). The vector of initial data for the TTC estimation looks as follows:
and ideal power flow limits in terms of static stability or thermal stability of each controlled line. Further, these values will be referred to as the PMs of TTC (PTTC PM). The vector of initial data for the TTC estimation looks as follows:
where Ui—magnitudes of nodal voltages; Pi, Qi—injection of active and reactive powers at nodes; Pij, Qij—power flows in transformers and lines, δi—voltage phases at the nodes of the scheme, in which PMUs are placed.
The main idea of the method is illustrated with a three-node scheme (Fig. 14A) in which five state variables are measured (U1, U2, U3, P2, P2 − 1). The main idea of TTC estimation is showed in Fig. 14B.

The TTC estimation method makes the current values of flows in the controlled lines (P2 − 1) as close to the ideal power flow limit (P2 − 1TTC PM) as possible in accordance with the topological and operational constraints.
and current values of uncontrollable state variables (U1). Online generation of coordinated actions of dispatchers in order to obtain the resultant state variables optimal in terms of all stakeholders is provided by the values of weighting coefficients of P2 − 1TTC PM.
The TTC estimation parameters are adjusted offline [113] according to the operational constraints of the IPS. When all the requirements imposed by the dispatchers of individual systems are met, the modified SE program is considered to be adjusted for these operating conditions and the weighting coefficients are written in the database. A great number of various operating conditions, that is, constraints and snapshots of measurements, should be considered offline.
Weighting coefficients of PTTC PM that provide the optimal result of TTC estimation in the resultant condition in sense criterion (61).

where k0—the number of controlled lines.
There are determined by N cycles of SE of EPS operating condition by the TTC estimation method, taking into account constraints
where Ui—voltage at the control point; Uimin and Uimax—lower and upper admissible limits for changes in the value.
where Pllim = Plav + Plres; Plav—available power of power plant excluding equipment removed for maintenance; Pres—operating reserve.
where j—nodes at which reactive power is controlled.
The range of possible values for weighting coefficients for PTTC PM is divided into N points. In the first calculation the weighting coefficients of PTTC PM are taken equal to the least value. Each calculation consists of two stages. The first one is solving the SE problem disregarding inequality constraints (62)–(64), then checking if (62)–(64) are met. If constraints (62)–(64) are met, then the criterion (61) is checked.
If criterion (61) in the current calculation (cycle) is lower than in the previous calculation, the weighting coefficients for PlkTTC PM are written in the database. Then weighting coefficients for PlkTTC PM are changed and again a TTC estimation is made, constraints are checked, and criterion (61) is calculated. Thus, N cycles of TTC estimation are made offline by the TTC estimation method with different weighting coefficients of PlkTTC PM. The values from the database as weighting coefficients of PlkTTC PM are used to perform the online TTC estimation method. ANN selects the weighting coefficients from the database.
The Kohonen ANNs [114] are applied to adjust the TTC estimation method in real time. In order to solve the problem using ANN, it is necessary to create a problem book and train as well as the ANN. The problem and testing books are created on the basis of an archive of realistic measurement snapshots. An approximation to the reality is achieved using typical or actual active and reactive load curves at the load nodes and reactive load curves at the nodes where compensators are installed for the calculation of steady states.
Based on the initial data, the algorithm calculates steady states for each point in the load curve. All the calculated steady states are written in the database of steady states. To create a standard measurement snapshot ![]() , the measured state variables ytrue are chosen from this database. To form the measurement snapshot, random errors xrand generated by the random number generator are applied to ytrue:
, the measured state variables ytrue are chosen from this database. To form the measurement snapshot, random errors xrand generated by the random number generator are applied to ytrue:
where xrand ∈N(0, 1), σy—measurement variance.
The problem book is compiled from the patterns represented by values of measurements. The problem book is used to train the ANN to identify the weighting coefficients that correspond to the given scenario and the current operating conditions. In the course of training all the patterns (input data) are classified into several classes through their comparison with typical elements of different classes and selection of the closest one. An answer of the trained ANN is the number of a class to which the considered pattern belongs. Each class corresponds to an individual set of weighting coefficients, which is determined by interpreting the answers of the ANN. Whether or not each set of weighting coefficients belongs to a certain class is determined offline. To this end the TTC estimation is performed N times for each snapshot, where N is the number of combinations of weighting coefficients.
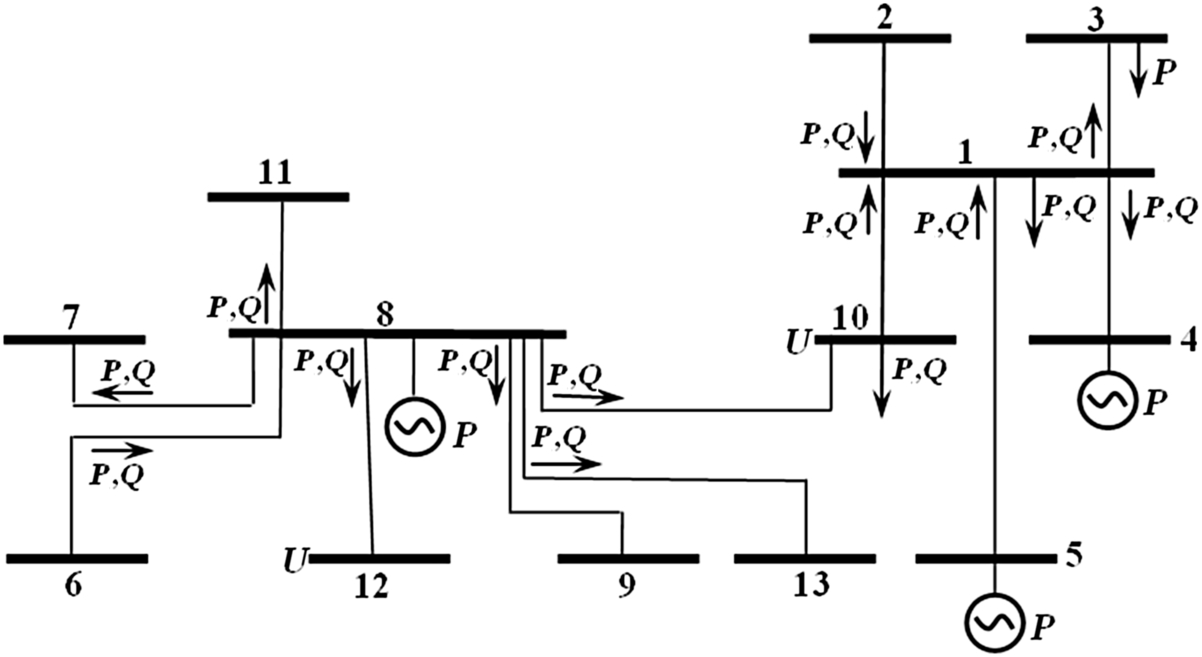
The dispatcher of each system puts forward his or her requirements and suggests a set of control actions to use the TTC. The voltage deviation is allowed within ± 15 kV of rated voltage at nodes. The range of reactive power control at nodes 4, 8, and 10 is possible at ± 100 MVAr of current reactive power. Active power generated at node 8 should not exceed 2000 MW.
The calculations were done on a test scheme (Fig. 15) consisting of two IPSs according to the following scenario: it is necessary to calculate the TTC in lines 8–10, 1–10, and 1–4. Additional power will be provided by EPS_1 (node 8) and EPS_2 (node 4).
Two steps are required to solve this problem: offline and online.
- (A) The offline stage
Creation of a problem book for ANN. Load curve at node 10 is used to create a problem book.
Training and testing the Kohonen network. The Kohonen network solves the problem of classifying the operating conditions into several classes. Relative testing error equals 0.83% (2 out of 240 are incorrect).
To interpret the ANN answers, the TTC estimation is performed 100 times for each of the 240 snapshots, where 100 is the number of combinations of weighting coefficients for PlkTTC PM in lines 1–10, 8–10, and 1–4. Enumeration of weighting coefficients starts with the value 0.1 and changes by 0.3 at the next calculation. After the calculations there remains one set of weighting coefficients of each snapshot. The set provides optimal results of TTC estimation of the considered operating conditions in real time.
- (B) The online stage
The obtained snapshot of measurements is used to perform SE of the current conditions under the weighting coefficients of measurements that correspond to the specified variances. New values of weighting coefficients for TTC estimation are identified using ANN. The input data for ANN are formed out of measurements. The ANN determines if this snapshot belongs to any of the classes, each of which is characterized by its set of weighting coefficients of TTC PMs in three controlled lines. The coincidence of weighting coefficients of the TTC PMs in controlled lines 8–10, 10–1, and 1–4 provides the maximum TTC value of all controlled lines in the current operating conditions of the EPS.
The current snapshot of measurements, with the weighting coefficients selected by the ANN, is used to perform the TTC estimation. Table 7 presents the estimates of current power flows and TTC estimates in lines 8–10, 10–1, and 1–4 for four snapshots.
Table 7
| Snapshot no. | Estimates | TTC | ||||
|---|---|---|---|---|---|---|
| 8–10 | 1–10 | 1–4 | 8–10 | 10–1 | 1–4 | |
| 37 | 175 | 111 | 55.8 | 520 | 426 | 248 |
| 105 | 237 | 111 | 55.8 | 548 | 395 | 250 |
| 163 | 254 | 111 | 55.8 | 557 | 388 | 252 |
| 181 | 350 | 111 | 55.8 | 595 | 336 | 249 |

The values of control actions for four snapshots are presented in Table 8. The tables demonstrate that to achieve TTC in the controlled lines, it is necessary to increase active power generation at nodes 4 and 8, increase reactive power generation at node 10, and reduce reactive power generation at node 1.

4.4.4 Automatic decision tree-based system for online voltage security control of power systems
The authors tested the most popular machine learning models that have been proposed recently to solve the problems of security assessment of EPSs. These are: neural networks of Kohonen, SVMs, hybrid neural network models, and various decision-tree algorithms [96,115,116]. The capability of these algorithms to effectively identify operating conditions of EPSs was demonstrated on various test schemes of IEEE involving different stability indicators as target vectors for training the models.
The calculations, however, show that when security is assessed in real time, the most effective algorithm in terms of such criteria as accuracy, robustness, online adaptability, and versatility is the algorithm of proximity-driven streaming random forest (PDSRF). Therefore, it is the PDSRF algorithm implemented in the programming language C ++, which was used as a basis for the developed automatic intelligent system for a real time security assessment of EPS. Moreover, the combination of the original properties of the PDSRF algorithm and capabilities of the L-index as a target vector for training a model made it possible to implement the following functions:
- (1) the function of the online alarming and prediction,
- (2) the function of control with localization of “critical nodes” in EPS, and
- (3) the function of a direct interaction with the relay protection and automation systems.
As said above, it is more sensible to use system variables-based voltage stability indices of the EPS in real time. Therefore, the L-index is used in the study, being one of the effective indices from this group, as a target indicator of system stability when training the PDSRF model. The L-index is proposed by Kessel and Glavitsch [117] as an indicator of impeding voltage stability. Starting from the subsequent analysis of a power line equivalent model, the authors developed a voltage stability index based on the solution to power flow equations. The L-index is a quantitative measure for the estimation of the distance of the actual state of the system to the stability limit. The L-index describes the stability of the entire system with the expression:
where αL is a set of load nodes and αG is a set of generator nodes. Lj is a local indicator that determines the buses that can be sources of a collapse. The L-index varies in a range between 0 (no load) and 1 (voltage collapse) and is used to provide meaningful voltage instability information during dynamic disturbances in the system [118]. Kessel and Glavitsch reformulate the local indicator Lj in terms of the power as:

where ![]() is the complex conjugate injected power at bus j; Yjj+ is transformed admittance; and
is the complex conjugate injected power at bus j; Yjj+ is transformed admittance; and ![]() is the complex voltage at bus j.
is the complex voltage at bus j.
The voltage stability indicators are known to be not only an effective method to assess the system stability, but they also underlie the control of EPS security. In [118] the authors propose a variant of the L-index calculation, which was used to develop an L-Q sensitivity analysis method that eases the quantitative analysis of voltage influence between different nodes.
According to the basic differential property of the L-index, a common analytical algorithm is devised for reactive power optimization. The algorithm can be used to determine the required reactive power injection for the load node. Based on the applied methodology, a large-scale power system will operate in an optimal steady state under the minimum Lsum, which represents a sum of local indices Lj. In this case the function of the first partial derivative is defined as follows:

The calculations carried out in Ref. [119] on different IEEE test systems show that the application of this approach makes it possible to improve the voltage stability by reactive power injections at load nodes. The injections are calculated from the L-index minimization conditions, and keep a system under heavy load conditions away from instability boundaries. Nevertheless, the authors state that despite the relative simplicity of the calculation, this method requires considerable computational efforts and its application in real-time problems can be complicated.
In this work supplementing and modifying this approach is suggested by using trainable models able “to learn” to calculate both the global L-index for the security assessment of an entire system, and the required injections Δ Q when determining the place and magnitude of corrective actions. This will allow applying this methodology in real time.
In many papers devoted to the studies of power system security on the basis of decision trees, the authors suggest using the model offline and, instead of adaptation, periodically updating the model [120,121]. However, even in the case of retraining, the complete training of the model is associated with additional time, which excludes the retraining in real time. This problem can be solved by online methods that update the existing model, using new data without its total restructuring [121]. A PDSRF algorithm proposed in this section can serve as one of such models.
The general structure of the developed system is presented in Fig. 16. The scheme shows that the proposed system consists of two main models on the basis of the PDSRF local and global algorithms.

Global model is trained to correctly identify the global L-index on the basis of system variables of an EPS such as voltage at nodes, loads, power flows, etc. Here an output value of the L-index is interpreted as a security signal (indicator) of the entire EPS. The local model on the basis of the PDSRF algorithm, in turn, is trained to determine the required reactive power injections ΔQ for load PQ-nodes. The inputs for the local model are represented by the same operating parameters and calculated values of the local L-index at a current time instant. Training of the local PDSRF model is based on the equation of partial derivative of (68). As a result, the trained model is able to determine the values ΔQ to perform corrective and/or preventive control actions online. Additionally, the security intelligent system can provide local signals in the form of local L-indices for each load at PQ-node.
In the end, such a structure makes it possible to implement the above functions of online alarming, localization, and interaction with automatic systems. For example, the system signal on the basis of the L-index, which is delivered to the operator through the visualization block, informs the dispatcher of the general level of security in the analyzed EPS (“high,” “low,” “emergency”), and allows the operator to predict (estimate) the extent to which the current state of the EPS is dangerous in terms of its closeness to voltage collapse. In the case of a dangerous state identification (“low security”), the local signals on the basis of the local L-index, formed by the local model, enable the localization of “critical load nodes” at which the system is at its closest to the stability loss. The corrective and/or preventive control actions can be implemented online on the basis of the injections ΔQ generated by the local model based on the PDSRF algorithm for PQ-nodes. Such control actions can both adjust the operating conditions in terms of their optimality according to some economic criteria or, in the case of a decrease in security, keep the conditions away from the instability boundaries.
It is important to note that the output signals of the alarming system are delivered both to the operator and directly to the operating automation. Interactions with the automation allow, where necessary, a correction of the agents actions because it is they that control the reactive power sources to regulate voltage in order to prevent the development of an emergency process. The operator, in turn, using the recommendations of the intelligent system (in the case of a security decrease), can adjust the protective relay settings by decreasing the settings with respect to time, increasing the sensitivity of startup signals of the emergency control functions through the selection of an appropriate group of settings, etc. Despite the fact that the proposed structure suggests a certain interaction with the dispatcher to control the EPS security, one can see the main mechanism of the developed intelligent system operation to be mostly automatic where many control actions are generated with the minimum involvement of the operator.
The efficiency of the proposed intelligent system was tested on various IEEE test power systems. The database of possible states of the test EPS for model training was generated by quasidynamic modeling in the MATLAB/PSAT environment. Global and local PDSRF models are implemented in C ++. A set of the obtained system states was used to calculate the values of global L-index, and on the basis of local indices Lj, the reactive power injections ΔQ were found for each load node. These characteristics were applied as class marks for training and testing the models on the basis of the PDSRF algorithm. The testing was done in the developed modeling platform in the MATLAB/PSAT environment that involved the simulation models of the quasidynamic model. This model provides the dynamic modeling accuracy sufficient for research into voltage stability, overload of lines, algorithms for local automation devices, etc.
To demonstrate the effective adaptation of the PDSRF algorithm in real time, various significant disturbances were modeled in the IEEE 118 test system (Fig. 17A). The disturbances included losses of generation and connection of a large consumer at specified nodes (Fig. 17B). These operation changes in the system were specified randomly at quasidynamic modeling.

The testing results of the PDSRF algorithm compared to the other machine learning models are presented in Table 9. The table shows that in all the models, except the PDSRF model, the accuracy declines at modeling of significant disturbances in the system, that is, they could not adapt in real time and required additional training (updating). For example, the accuracy of state identification for the scheme IEEE 118 made up 97.24% (Table 9), which is approximately 10% higher than the accuracy of other known intelligent approaches presented in some international peer-reviewed journals in recent years. These approaches include neural networks of Kohonen, supporting vector machines, hybrid neural network models, and various algorithms of decision trees.
Table 9
| Method | Accuracy (%) | Kappa (%) |
|---|---|---|
| Global PDSRF model | 97.24 | 95.30 |
| Support vector machine | 81.54 | 64.92 |
| Random forest | 96.01 | 93.24 |
| Gradient boosting trees | 93.64 | 89.41 |
| Elman neural network | 80.80 | 65.08 |
Moreover, the calculations show that the proposed online approach on the basis of PDSRF provides lower errors (root-mean square error of order 11% for IEEE 118) and a high speed of solving process (about centiseconds for each steady state of IEEE 118 compared to 30–40 min in the traditional approach), when determining the additional reactive power injections.
This fact makes it possible to effectively apply the warning subsystem for monitoring to control security in electric EPSs of a large dimension in real time. The obtained values of additional injections were used for reactive power compensation by using reactive power sources, which decreased the sum of L-indices at load nodes. Their increase is indicative of an even greater proximity of voltage collapse, first of all for the heavy load and dangerous conditions of IEEE 118 system (Fig. 18).

In the former case, the gradual load increase led to equipment overload, the tripping of the generator, and, finally, to a voltage collapse. In the case where the proposed intelligent system was applied, in the same emergency scenarios the corrective control actions made it possible to maintain the stability of a test subsystem by the coordination of reactive power sources and without load shedding.
4.4.5 Multiagent coordination of emergency control devices
Analysis of the recent blackouts shows that the most severe contingencies that lead to voltage collapse occur in a highly loaded EPS without effective coordination of emergency control device operation.
A decentralized agent-based system for operation and emergency control, that is, a MAAS, has been developed in MATLAB and JADE. The system provides control of reactive power, prevents emergency tripping of generators, and maintains voltage at load buses within acceptable limits [122]. The MAAS is based on the decentralized algorithms of adaptive control of reactive power sources, where each source (agent) is an autonomous unit with a global goal to prevent voltage collapse not to the detriment of the local interests, that is, prevention of the local overload of the controlled reactive power source. The agents are interconnected by the common information environment that allows the exchange of messages. An agent's knowledge about a subsystem is formed as a base of sensitivity coefficients on the basis of the Jacobian matrix elements of steady-state equations.
The efficiency of the intelligent system was tested on the following schemes: IEEE RTS 96 (a modified 53-bus scheme) and IEEE 118 (a 118-bus scheme). The assumption is that using the two types of automatic control can be used in the IEEE RTS 96 scheme: conventional automatic control system (CACS) (includes turbine governor, automatic voltage regulator and over excitation limiters on each generator, and OLTCs on transformers connected to buses 204–210, excludes UVLS), and MAAS—in addition to the set of CACS local controllers, it includes OLTCs on transformers connected to buses 101, 102, and 103.
The multiagent automation testing performed for the IEEE RTS-96 system demonstrated that the coordination of local devices through the implementation of additional control actions from the proposed MAAS makes it possible to effectively cope with the equipment overload and, consequently, with voltage collapse (Fig. 19). In particular, where the local automation failed to tackle the situation, the multiagent automation prevented the voltage collapse without load shedding but only by coordinating the reactive power sources.

The testing carried out for the IEEE 118 system shows that the probability of a cascading failure in the case of applying the multiagent automation will be lower because, thanks to the reactive power redistribution, the generators will be loaded evenly compared to the situation where there is no multiagent automation at all (Fig. 20). Results of the test calculations testify to the fact that the proposed MAAS provides the opportunity to exactly determine the instant when it becomes necessary to transition from the secondary control to the emergency control, excluding human factors and ensuring a continuous process of operation and emergency control.

4.4.6 Intelligent system for preventing large-scale emergencies in power system
The research proposes supplementing the existing principles of EPS control with the method of “control with prediction,” which suggests early detection and prevention of dangerous states and emergency situations before they lead to a voltage collapse [74,75]. Thus, the preemergency control represents a sort of “zero echelon (level)” in the whole system of emergency control and assists the system to avoid instability (Fig. 21). The control system based on this approach should adjust the operation of local emergency control devices both in steady state and postemergency conditions to reduce the probability of a severe emergency.

The intelligent system developed in Ref. [85] makes it possible to compensate for the revealed downsides of some existing protection and emergency control devices by applying various artificial intelligence algorithms (system of agents, technology of decision trees) to early detection and prevention of dangerous conditions of complex power systems before they lead to a blackout. This fact makes it possible to improve the operation of domestic ECSs and considerably reduce the risk of massive blackouts by minimizing the economic, social, and technical losses.
An architecture of the intelligent system for prevention of blackouts in complex EPSs (Fig. 22) was developed based on the proposed intelligence algorithms. This architecture represents a software platform including the following components:
- (1) a database of emergency disturbances,
- (2) a block for simulation of the behavior of EPS (dynamic and quasidynamic models),
- (3) a block of operation/emergency control on the basis of multiagent technologies,
- (4) a block for monitoring and assessment of EPS security on the basis of machine learning algorithms,
- (5) interfaces providing interaction between the block of EPS behavior simulation with the blocks of monitoring and control, and
- (6) a block for the analysis of results.

A developed structure of emergency disturbances contains the following elements:
- (1) set of scenarios of load increase in the EPS,
- (2) sequence of random and dependent discrete actions (tripping of lines, generators, transformers, load shedding, failure of automation, etc.),
- (3) additional set defining the current state of automation devices in the event that the considered disturbance occurs, and
- (4) results of test trials.
A database of emergency disturbances was created basing on the formulated principles. Its structure includes the following elements:
- (1) a list of emergency disturbances and
- (2) a set describing the state of the classical and agent-based automation systems.
The developed software allows an interaction with the described database by transmitting respective data to the block of EPS behavior simulation and receiving additional data from the block of analysis of results. Also a program for the formation of an emergency development scenario was developed. For a concrete test scheme of EPS based on the constructed database of emergency disturbances, the models of classical and agent-based automation systems were designed.
An alarm subsystem for monitoring and assessment of security to reveal dangerous states of EPS was developed. Within the alarm subsystem for monitoring, an innovative online method was devised for the assessment and control of the dynamic security of EPS using the technology of decision trees, that is, PDSRF, implemented in the language C ++. The main qualitative distinction of this approach from the other modern approaches is the capability of PDSRF to independently and adaptively change in real time in case of serious changes in the received telemetry data without loss of accuracy while identifying the conditions of EPS.
5 Smart grid clusters in Russia
The process of IESAAN formation suggests implementation of pilot projects and creation of territorial smart grid clusters. These clusters are supposed to use information, technological, and control systems providing adaptive (depending on the operation situation in the system) control of network parameters, remote control of switching devices, and real-time estimation of the technical state of the network under normal, preemergency, and postemergency conditions in EPS [4,5].
Currently, along with implementation of the pilot projects and the creation of smart grid clusters, new equipment is being installed at the energy facilities of the UNEG of Russia as part of a modernization program. According to the investment program for 2011–14, the innovative equipment was installed at more than 50 facilities. First of all, there are new devices intended to compensate reactive power and maintain voltage (static thyristor compensators, STATCOMs, controlled shunt reactors).
5.1 Smart grid clusters in the east interconnected power system
5.1.1 Smart grid clusters
In 2011 the projects on formation of individual smart grid clusters and implementation of pilot projects aimed at creating the smart grid [4,5,123] were launched in the territory covered by the East IPS (Amur region, Sakha Republic, Primorye, and Khabarovsk Territories). The projects (Table 10 [4,5,9]) include:
- − Smart grid cluster ElgaUgol.
- − Smart grid cluster Nizhny Kuranakh-Maiya (Yakutian energy system).
- − Smart grid cluster Vanino.
- − Smart grid cluster of Primorye Territory.
- − Pilot project on smart grid with distributed generation on Russky Island and Popov Island.
- − Pilot project on reliable power supply from the Zeya HPP, and reliable and quality power supply to electric traction transit line Siberia-East.
Table 10

Implementation of smart grid in the clusters Elgacoal, Vanino, and Primorye Territory suggests construction of compact digital substations furnished with innovative devices (new systems for reactive power compensation and voltage maintenance, active filters, equipment monitoring, and diagnosis systems, etc.) This addresses the enhanced reliability of the power supply to consumers from the substations located along the railway of the Khabarovsk Territory and provides a reliable electricity supply to the south of the Primorye Territory.
5.1.2 Pilot project for creation of territorial smart grid cluster in Russky and Popov Islands
The 220/35 kV substation Russkaya and 220 kV cable—overhead line Zeleny ugol—Russkaya with a submarine bridge through the Eastern Bosforus strait is under construction to provide centralized electricity supply to Russky Island [4,5,124].
The territorial smart grid cluster [4,5,125] was formed because of the summit of APEC countries in 2012 on Russky Island and involves the creation of a smart automated control system. The system aims to provide centralized monitoring, dispatching, and process control as well as solving the problems of creating the smart grid of the region and optimal control of electricity, heat, and gas supply facilities and consumers.
Alongside the network infrastructure, the integrated smart grid includes gas-fired power plants (mini-CHPPs), wind farms, boiler plants, electricity and heat storage systems, “smart houses,” and a park of electric cars with charging stations. The control zones of the smart control system are listed in Table 11 [4,5,126].
Table 11

The major components of the smart grid cluster are:
- − Distributed software and hardware complex of the adaptive automatic system for optimal online control of the energy system.
- − Software and hardware complex of the automated dispatching and process control system for facilities of the electric network, heat network, and gas supply system as an upper level of the control system of energy supply facilities (SCADA system).
- − Automated control system of production process facilities as a lower level in the control loop of energy supply facilities that are directly connected with production equipment.
- − System of smart metering of electricity consumption.
- − Software and hardware complex of the smart grid cluster dynamic simulations for validation of engineering solutions, and for demonstration and education purposes.
- − Information and computation infrastructure.
- − Active elements of the energy system.
The total planned electric load of consumers on the island during the APEC summit is estimated at 320–380 MW, including 120 MW of residential communities. The first stage includes the construction of four mini-CHPPs: Severnaya, Tsentralnaya, Okeanarium, and Kommunalnaya on Russky Island. Besides, it is planned to construct the Dalnevostochnaya wind power plant consisting of a system of wind turbines on the islands. In terms of the estimated wind potential of the islands, the total capacity of the Dalnevostochnaya wind power plant is 36 MW. It is suggested to install 10 wind turbines in the southern part of Popov, and eight wind turbines (with the total capacity16 MW) on the Kondratenko peninsula of Russky.
Wind power plants will supply electricity at a voltage of 35 kV with construction of a 35 kV cable line from Switchgear-2 on Popov to Switchgear-1 on Russky (crossing the strait of Stark) and from switchgear-1 to substation Russkaya. In this case the 35 kV cable line will be used to connect the centers of electricity supply to consumers on Popov that is to be switched to the centralized electricity supply from the EPS and residential consumers in the bay of Boyarin.
In the municipal zone of the Saperny peninsula of Russky, it is foreseen to create a residential district with low-rise buildings equipped with a substantial amount of automation devices (“smart houses”). Besides, it is envisioned to equip residential buildings with their own microgeneration sources (solar panels) and create infrastructure for electric cars.
5.2 Smart grid clusters in northwest interconnected power system
The following pilot projects of smart grid clusters will be implemented in the Northwestern region of Russia during the period through 2020 [4,5,127]: Karelskaya power system, power systems of Komi Republic and Arkhangelsk, and “Big Ring” and “Small Ring” of electric networks in St. Petersburg (Table 12 [4,5,9]).
Table 12

The pilot projects are intended to furnish Northwest IPS with innovation technologies of smart grids that will effectively solve the regional problems (limitations on power output from power plants, insufficient reliability level of power supply to consumers, etc.).
5.3 Pilot project on electricity supply to the Skolkovo innovation center
Construction of the Skolkovo innovation center is a far-reaching project on the creation of the high-tech research and technological complex for design and commercialization of new technologies. The center is planned to be engaged in development of five priority directions of updating: energy, information technologies, telecommunication, biomedical technologies, and nuclear technologies. This “city of the future” will host subsidiaries and laboratories of the leading Russian and international universities and companies.
The Skolkovo innovation center is planned to be built on the territory of the urban settlements Novoivanovskoye and Odintsovo near the village Skolkovo, in the eastern part of the Odintsovo district of the Moscow region at a distance of 2 km to the west of the Moscow ring road (MKAD) on the Skolkovo highway [128]. About 40,000 people will reside and work on the area of 370 ha.
For the electricity supply to objects of the Skolkovo innovation center, nine main electric network facilities will be built and reconstructed during 2011–14 [4,5,124]. They are [129]:
- ▪ Conversion of sections of seven 110–500 kV overhead transmission lines into cable lines from 500 kV substation Ochakovo to the Minsk highway with construction of 110–500 kV transfer points:
- − 500 kV transmission line Ochakovo-Zapadnaya;
- − Four 220 kV overhead transmission lines (Ochakovo-Krasnogorskaya, Ochakovo-Novovnukovo, Ochakovo-Choboty, and Ochakovo-Lykovo);
- − Two 110 kV cable lines Ochakovo-Odintsovo.
The cable routing is planned to be about 11 km long. It is planned to use cable made of cross-linked polyethylene by the leading world manufacturers.
- ▪ Two 220/20 kV indoor substations Skolkovo and Smirnovo with the total capacity 252 MVA on the territory of the Skolkovo innovation center. The variant of underground construction is discussed for substation Smirnovo with the use of gas-insulated power transformers for the first time in Russia. As a result, higher reliability and fire safety of substation operation will be achieved.
Transport links within the Skolkovo innovation center are planned to be implemented by innovation vehicles: five routes of electrobus that provide fast transit to the Moscow underground railway stations and electric cars (with a system of their hire and a network of charging stations).
6 Conclusion
- (1) Essential sophistication of the operating conditions of current EPSs enhances the danger of heavy system emergencies and requires improvement and development of the principles and control systems of EPS operating conditions. It is necessary for these purposes to apply new methods and tools for measuring, transferring, and processing the EPS operating parameters. We have suggested in this chapter basic principles on the system of monitoring and forecasting the operating conditions and control of EPS, substantially enhancing the efficiency and adaptability of the coordinated operation and emergency control in EPS.
- (2) Intelligent EPS is a customer-oriented EPS of a new generation that should provide high-quality, reliable, and efficient services for electricity supply through flexible interaction in all types of generation, electric networks, and consumers based on cutting-edge technologies and a common hierarchical system of control. A key role in the intelligent EPS is assigned to the AAN that provides reliable and efficient connection between generation and consumers.
- (3) The use of uniform principles of control and qualitatively new kinds of techniques and technologies is necessary for the effective solution of IESААN control problems online in the conditions of incomplete information on parameters of EPS and disturbances. The structure of IESААN control should be formed on the basis of the following principles:
- − A control system realizing operating functions with a high degree of automation is a key link at the construction of IESААN.
- − IESААN control systems should have the uniform (coordinated) principles of management regardless of the form of property and hierarchical level.
- − When combining the local and system functions of management, the relations between controls of generation, networks, and load-controlled consumers should be traced explicitly.
- − Information support of control systems should provide transmission of controlled parameters and signals into control loops in real time.
- − The software of control systems should be realized in online and offline modes to trace and control both normal (optimization of conditions) and abnormal (prevention of overloaded and liquidation of preemergency conditions) EPS operation, and besides should be adaptive to changing situations.
- − The communication systems included in the control loop should provide high speed, reliability of information, and control signals transmission.
- (4) To obtain a general picture of the EPS state for further solving the control problems, the universal methods are necessary to place the PMU to complement SCADA measurements. These methods:
- − should provide the best properties of the SE problem solution, such as the observability of the calculated scheme, the identifiability of bad data, and the accuracy of obtained estimates.
- − should be based on the observability theory that was devised to place SCADA systems and take into account the block character of PMU measurements.
Among different ways of solving this problem, the topological approaches based on different strategies of random search seem to be the most promising.
- (5) Quality of the results in the online SE can be improved by using retrospective information on the state variables. The algorithms were developed that consider interrelations between the time-varying state variables using a set of snapshots (DSE). The main advantage of the algorithms is the ability to deliver good results in the cases of bad and incomplete data and to forecast state variables.
- (6) With a permanently growing number of cyberattacks against the information structure of energy facilities, the systems of data collection and processing (SCADA and WAMS) are most vulnerable to the physical failures and information attacks. If a local region or an object is observable on the basis of PMU measurements, they are also observable by SCADA measurements. Therefore, it is suggested, when needed, carrying out independent simultaneous (by one timestamp) bad data detection and SE by SCADA and WAMS measurements to additionally find out if there is a malicious attack against one or another system.
- (7) The existing ECSs and the actions of the transmission system operator may prove to be ineffective to prevent the catastrophic development of the emergency. The development of next-generation intelligent systems is necessary to complement existing ECSs, taking into account their “weak points.” The new emergency protection and operation systems should
- − include tools for the intelligent monitoring and assessment of the EPS operating conditions,
- − be capable of predicting potentially dangerous states of the EPS,
- − be highly resilient and able to coordinate local emergency control devices,
- − include methods and models providing the protection of an EPS with a complex structure, and
- − complement the existing ideology of ECSs but not contradict it.
- (8) Computational intelligence techniques like decision trees, ANNs, and multiagent systems have been applied to achieve the essential online intelligent security monitoring and assessment performance. The following systems of monitoring, forecasting, and control of EPS are recommended for implementation:
- − Novel forecasting systems such as Forecast of EPS state variables based on the DSE method and forecast of EPS parameters based on the hybrid data-driven approach, which have been developed to improve grid operation efficiency and to reduce fossil fuel consumption and carbon emissions. The main goal of the forecasting approach development was to increase the efficiency of forecasting studies when dealing with limited retrospective data and a sharply variable, nonstationary time series of EPS parameters.
- − Automatic decision tree-based system for online voltage security control of EPSs, which provides the dynamics modeling accuracy sufficient for research into voltage stability, overload of lines, algorithms for local automation devices, etc. This fact makes it possible to effectively apply the system for monitoring to control security in EPSs of a large dimension in real time and to implement functions of online alarming, localization, and interaction with automatic systems. The operation of the developed intelligent system is mostly automatic, and the major part of the control actions is generated with the minimum involvement of the operator.
- − A decentralized agent-based system for operation and emergency control (a MAAS), which provides reactive power control by coordinating the operation of different discrete and continuous control devices in a postdisturbance period. Such a coordinated control of local devices makes it possible to effectively cope with the equipment overload and voltage collapse, prevents generator tripping, and maintains load bus voltages within the normal range.
- − Supplementing the existing principles of EPS control with the method of “control with prediction,” which provides early detection and prevention of dangerous states and emergency situations before they lead to a voltage collapse. The proposed intelligent system for preventing large-scale emergencies in the EPS adjusts the operation of local emergency control devices both in steady state and in postemergency conditions to reduce the probability of a severe emergency.
- (9) The areas for further developing IESААN are:
- − Design a subsequent application of new types of power equipment, giving active properties to an electric grid (on the basis of new kinds of materials such as power semiconductors, high-temperature superconductors, and so forth).
- − Create a new means and systems of relay protection, automatic operation and emergency control, equipment diagnostics, and energy resources accounting.
- − Design of control systems for substations of new generation.
- − Improve existing as well as design and implementation of novel hierarchical systems for coordination and control of power flows, frequency, and generation.
- − Provide a new quality of network monitoring and protection against external contingencies (lightning, icing, wind effects, wires sagging etc.).
- − Monitoring the reliability and quality of electricity transmission services.
Finally, the creation of IESААN should provide a qualitatively new level of efficiency of electric power industry development and functioning, raise system security, and increases the quality and reliability of the electricity supply to consumers.