
Characterization of Microstructures of Volcanic Gas Reservoirs
Reservoir microstructures refer to the geometry, size, distribution, and communication of pores and throats in reservoir rocks, which directly affect the reservoir accumulation and permeation capacity and ultimately determine the variable distribution of gas reservoir deliverability [1]. By means of core description, microscopic observation, and experimental analysis, the microstructural characterization of volcanic gas reservoirs can reveal the microscale shape, size, and accumulation capacity of volcanic reservoir spaces as well as the shape, scale, and permeation capacity of seepage pathways. It can also clarify the accumulation-permeation capacity and distribution characteristics of volcanic reservoirs with various accumulation-permeation modes, and ensure that the effectiveness and fluid-producing capacity of volcanic reservoirs are characterized quantitatively, so as to provide guidance for evaluating their microscale producing capacity and calibrating their recovery ratio.
11.1 Challenges and solutions
11.1.1 Challenges in characterizing volcanic reservoir microstructures
Volcanic reservoirs have their specific petrogeneses and a great variety of reservoir spaces and throats as well as complex pore-throat configurations. This results in extremely complex microstructures that pose tough challenges in their identification and characterization with regard to the following aspects.
Intergranular pores are predominant in conventional sedimentary reservoirs, and reservoir spaces in volcanic reservoirs are highly variable, as there are up to a dozen types. Because of their complex petrogenetic origins, various influencing factors, and different preservation conditions, reservoir spaces in volcanic reservoirs are extremely complex for a variety of reasons: (1) various types of reservoir spaces differ significantly in shape, and the shapes of the same type of reservoir space vary greatly under different conditions of occurrence and preservation; (2) the radius of a reservoir space can range from several micrometers to tens of millimeters, with a wide range of uneven distribution; (3) the variety in the shapes and sizes of reservoir spaces contributes to the large differences in accumulation capacity. In volcanic reservoirs, porosity varies from several thousandths to over 20%, and the maximum mercury intrusion saturation ranges from a few percentages to over 95%. Therefore, it is difficult to characterize the shape, size, and accumulation capacity of reservoir spaces in volcanic rocks.
Compared to conventional sedimentary reservoirs, the throats in volcanic reservoirs have more complex petrogenetic origins and are represented by a variety of types (contracted, dissolved, and fractured), a wide range of sizes (with throat radii that can range from 10 −3 μm to several μm), and distinctly different permeation capacities (with a permeability differential up to several thousands). Currently, the research methods are relatively simple. Specifically, the throat shape is observed qualitatively in cast thin sections, and the throat size is determined quantitatively from the data derived from mercury injections and constant-rate mercury injections. Therefore, it is difficult to characterize the shape, size, and permeation capacity of throats in volcanic reservoirs.
The complexity of reservoir spaces and throats leads to complicated and variable accumulation-permeation modes in volcanic reservoirs. Based on the assemblage modes of reservoir spaces and seepage pathways, eight basic accumulation-permeation (A-P) patterns are recognized in volcanic reservoirs. Currently, the categories of A-P patterns are identified qualitatively by examining cores and thin sections; the accumulation and permeation capacities of various volcanic reservoirs are evaluated by log interpretation and dynamic testing. Due to the variation in geological characteristics of the tested horizon, the reliability of the testing method, and the information quality and quantity of testing points, it is difficult to quantitatively evaluate the accumulation-permeation capacity and deliverability of volcanic reservoirs with different A-P patterns.
Multiple modes of pore-fracture assemblage and the extremely strong heterogeneity of volcanic rock reservoirs result in complex microporous structures in volcanic reservoirs in 3D space. Currently, mercury injection and nuclear magnetic resonance are the primary means for determining the effective pore volumes and mobile (movable) fluid volumes under the control of throats, permeability, and displacement pressures at various levels and for evaluating the producing capacity of different reservoir fluids. Constrained by many factors such as insufficient quantity and representation of samples, it is difficult to precisely evaluate the effectiveness and producing capacity of volcanic reservoirs.
11.1.2 Technical solutions and approaches
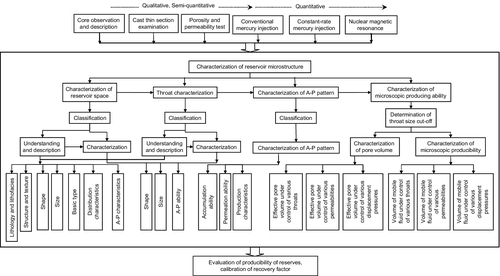
Most previous studies on the microscopic characteristics of volcanic reservoirs provided qualitative descriptions. In this book, the microstructures are characterized in detail step by step according to a technical approach that progresses from qualitative to semiquantitative and then to quantitative study, taking into consideration the complexity of volcanic reservoir microstructures, by systematically integrating data from cores, thin sections, and experiments such as mercury injection, constant-rate mercury injection, and nuclear magnetic resonance. This study focuses on the four key topics: reservoir space, the fluid flow pathway, the accumulation-permeation pattern, and the microscopic producing capacity (Figure 11.1).
1 Characterization of reservoir spaces
The volcanic reservoir spaces are usually characterized in three steps. (1) In terms of their origins, shape, and size, a logical classification scheme is established to divide the reservoir spaces in volcanic gas reservoirs. (2) The classification scheme provides identification markers for various types of reservoir spaces; then, the types of reservoir spaces in volcanic rocks are identified, and the distribution and accumulation characteristics of various types of reservoir spaces are described based on the shape, scale, configuration, and dissolution traces, in combination with the characteristics of lithology and lithofacies, rock structure, and texture that are associated with the reservoir spaces. (3) The morphology of various types of reservoir spaces is characterized qualitatively based on an observation of cores and thin sections; the size and accumulation capacity are characterized quantitatively by means of experiments such as porosity and permeability tests, conventional mercury injection, and constant-rate mercury injection.
2 Characterization of throats
Similar to the characterization of reservoir spaces, throats in volcanic reservoirs are also characterized in three steps. (1) In terms of their origins, shape, and size, the throats in volcanic reservoirs are classified. (2) Identification markers of various types of throat are set up; then the throat types in volcanic rocks are identified and the distribution and seepage characteristics of various types of throats are described based on throat size, shape, and dissolution traces, in combination with the characteristics of lithology and lithofacies, rock texture, and structure that are associated with the throats. (3) The shape characteristics of various types of throats are characterized qualitatively using core observation and thin section examination, and the sizes and permeation capacities are characterized quantitatively by means of experiments such as porosity and permeability tests, conventional mercury injection, and constant-rate mercury injection.
3 Characterization of A-P patterns
On the basis of characterized reservoir spaces and throats, the A-P patterns in volcanic gas reservoirs are established according to the modes of pore-throat-fracture assemblage. For various A-P patterns, the accumulation-permeation capacity and production characteristics are characterized respectively and the control of the A-P pattern on production characteristics is clarified by integrated analysis of static and dynamic data, so as to guide the formulation and optimization of technical policy for development.
4 Characterization of reservoir microscopic producing capacity
The cutoff threshold of throat size in volcanic gas reservoirs is determined by various methods. On this basis, the permeability cutoff of volcanic reservoirs is determined, the classification criteria of throat and permeability are set up, the effective pore volumes and mobile fluid volumes are evaluated under the control of various throat, permeability, and displacement pressure parameters, and the characteristics of the microscale fluid-producing capacity of volcanic rocks under different controlling conditions are clarified. These criteria provide a basis for evaluating reserve producing capacity and calibrating recovery parameters for volcanic gas reservoirs.
11.2 Characterization of reservoir spaces in volcanic gas reservoirs
11.2.1 Classification of reservoir spaces in volcanic gas reservoirs
The classification scheme of reservoir spaces in conventional sedimentary reservoirs is not suited for volcanic reservoirs because of the fundamental difference in the origin of volcanic reservoirs compared with normal sedimentary reservoirs. By now, a great deal of work has been done on the classification of reservoir spaces in volcanic rocks [2–7]. However, a unified classification scheme is still unavailable due to the complexity of volcanic reservoir spaces. To solve this practical problem, a classification scheme for reservoir spaces in volcanic rocks is established in this study according to the features of volcanic reservoir spaces, with references to the previous research results.
1 Research results from previous work
Zhao and colleagues [2–4] divided the reservoir spaces in volcanic rocks into two categories: pores and fractures. They subdivided pores into 10 categories: vesicles, pores within amygdaloids, interporphyrocrystic pores, contraction pores, intermicritic pores, interhyalinocrystalline pores, intracrystal pores, dissolution pores, expanded pores, and plastic flow pores. They subdivided fractures into six categories: structural fractures, cryptoexplosive fractures, diagenetic fractures, weathering fractures, vertical joints, and columnar joints.
Ren and coworkers [5] examined in detail the categories and characteristics of reservoir spaces in volcanic reservoirs in their study on the volcanic reservoir in Well Block 609 of the Liaohe depression. As a result, these authors divided the volcanic reservoir spaces into a primary category and a secondary category; the primary pores include primary vesicles, residual vesicles, interporphyrocrystic pores, intercrystal pores, pores within amygdaloids, and contraction pores; the primary fractures include cooling contraction fractures, contraction joints, and interclast fractures. The secondary pores include porphyrocrystic dissolution pores, intraporphyrocrystic and intramatrix dissolution pores, matrix dissolution pores, devitrified dissolution pores, dissolution pores in amygdaloids, dissolution pores in altered rocks, postfilling redissolution pores, and dissolution pores in metasomatic deposits; the secondary fractures include structural fractures and weathering fractures.
Yu and colleagues [6] divided the reservoir spaces in volcanic rocks into primary and secondary categories in their study on the volcanic reservoirs of the Wucaiwan depression (Junggar basin). The primary reservoir spaces include (1) primary pores (primary vesicles, residual vesicles, intercrystal pores and intra-crystal pores); (2) primary fractures (cooling contraction fractures); (3) secondary pores, including porphyrocrystic dissolution pores and dissolution pores in amygdaloids; and (4) secondary fractures, mainly including structural fractures and weathering fractures.
Liu and coworkers [7] divided the reservoir spaces in volcanic rocks into pores and fractures based on the morphology in their study on the evolution of the volcanic reservoir space in the Yingcheng Formation of the Xujiaweizi faulted depression in the Songliao basin. These authors recognized 15 types in four categories in terms of their origins: (1) primary pores, including vesicles, amygdaloidal pores, interclast pores, and intercrystal pores; (2) secondary pores, including interclast dissolution pores, intercrystal dissolution pores, intracrystal dissolution pores, devitrified dissolution pores, and dissolution pores in altered deposits; (3) primary fractures, including contraction fractures, contraction cleavages, and grain explosion cracks; and (4) secondary fractures, including structural fractures, dissolution fractures, and weathering fractures.
As this discussion implies, the classification schemes of reservoir spaces have been proposed from different perspectives, which partly reflects the complicated origins and diverse types of reservoir spaces in volcanic reservoirs. However, the shapes and origins of reservoir spaces have been taken into account when volcanic geologists have proposed classification schemes.
2 Classification scheme used in this book
With regard to the features of reservoir spaces in volcanic gas reservoirs such as their complex origins and their highly variable shapes and scales, the reservoir spaces in volcanic rocks are divided into two categories based on shape first: pores and fractures. Pores refer to a type of reservoir space that has an approximately equidimensional morphology; fractures refer to sheetlike reservoir spaces in 3D, in which two of the dimensions are far larger than the third (i.e., the ratio is greater than 10:1). Then, in terms of their origins, pores are subdivided into three categories: vesicles, intergranular pores, and dissolution pores, and fractures are subdivided into five categories: contraction fractures, structure fractures, blast fractures, dissolution fractures, and sutured fractures. Finally, according to the scale of reservoir space, the pores of different origins are further subdivided into 11 types at four levels: cavities, macropores, small pores, and micropores; and fractures are divided into four types: macro-, medium, small, and microfractures (Table 11.1).
Table 11.1
Classification and Characteristics of Reservoir Spaces in Volcanic Gas Reservoirs
| Category of Reservoir Spaces | Basic Characteristics of Reservoir Spaces | Basic Characteristics of Reservoir Spaces | ||||||||||||
| Shape Type | Genetic Classification/Distribution in XX Gas Reservoir | Scale Classification | Pore Diameter, mm | Distribution Percentage in XX Gas Reservoir | Lithology | Lithofacies/Subfacies | Pore Shape | Accumulation Ability | Throat Type | Throat Shape | Throat Radius, μm | Permeation Ability | Pattern of Accumulation-Permeation | Deliverability |
| Pore | Vesicle, 45% | Vesicular cavities | > 2 | 3 | Vesicular lava, breccia lava | Top subfacies of effusive facies, splash subfacies of explosive facies | Nearly round, elliptic, rhombic | Strong | Pore-contraction (large throat), fractured | Thick-short tubular, sheetlike | > 0.5 dominantly | Strong | Vesicular | High |
| Macrovesicles | 0.5-2 | 12 | Vesicular lava | Upper subfacies of effusive facies, lower subfacies of effusive facies | Sub-rounded, elliptic, rhombic | Fairly strong | Pore-contraction (large throat, medium throat), fractured | Thick-short tubular, small-short tubular, sheetlike | 0.25-0.5 dominantly | Strong, medium | Vesicular, fractured-vesicular | High, medium | ||
| Small vesicles | 0.01-0.5 | 20 | Tight lava, welded tuff, welded breccia | Middle subfacies of effusive facies, hot clastic flow subfacies of explosive facies | Nearly round, elliptic | Fairly weak | Pore-contraction (medium throat, small throat), fractured | Small-short tubular, sheetlike | 0.1-0.25 dominantly | Weak | Fractured-vesicular | Medium, low | ||
| Microvesicles | < 0.01 | 10 | Tight lava | Middle subfacies of effusive facies | Nearly round | Weak | Pore-contraction (microthroat), fractured | Small-short tubular, sheetlike | < 0.1 dominantly | Weak | Microporous, fractured-microporous | Low | ||
| Inte-granular pore, 35% | Intergranular cavities | > 2 | 2 | Volcanic agglomerate, volcanic breccia | Fallout subfacies of explosive facies | Stripelike, dendritic | Strong | Pore-contraction (large throat), fractured | Thick-short tubular, thick-long tubular, sheetlike | > 0.5 dominantly | Strong | Intergranular porous | High | |
| Macro-intergranular pores | 0.5-2 | 8 | Volcanic breccia, welded breccia, autoclastic breccia lava | Fallout subfacies of explosive facies, hot clastic flow subfacies of explosive facies, volcanic conduit facies | Rhombic, striped, dendritic | Fairly strong | Pore-contraction (large throat, medium throat), fractured | Thick-short tubular, thick-long tubular, small-long tubular, sheetlike | 0.25-0.5 dominantly | Medium | Intergranular porous, fractured–intergranular porous | Medium | ||
| Small intergranular pores | 0.01-0.5 | 15 | Volcanic breccia, welded breccia, welded tuff | Fallout subfacies of explosive facies, hot clastic flow subfacies of explosive facies | Rhombic, stripelike | Fairly weak | Pore-contraction (medium throat, small throat), fractured | Small-short tubular, small-long tubular, sheetlike | 0.1-0.25 dominantly | Medium, weak | Intergranular porous, fractured–intergranular porous | Medium, low | ||
| Matrix micropores | < 0.01 | 10 | Crystalline tuff, welded tuff | Hot base surge subfacies of explosive facies, hot clastic flow subfacies of explosive facies | Rhombic | Weak | Pore-contraction (microthroat), fractured | Small-short tubular, sheetlike | < 0.1 dominantly | Weak | Microporous, fractured-microporous | Low | ||
| Pore | Dissolution pore, 20% | Dissolution cavities | > 2 | 3 | Vesicular lava, breccia lava, volcanic agglomerate, volcanic breccia | Top subfacies of effusive facies, upper subfacies of effusive facies, splash subfacies of explosive facies, fallout subfacies of explosive facies, | Nearly round, stripe like, regular phenocrystic | Strong | Dissolution throat (large throat), fractured | (Ir)regular thick-short tubular, (ir)regular thick-long tubular, irregular sheetlike | > 0.5 mainly | Strong | Dissolution- porous, fractured–dissolution-porous | High |
| Dissolution pores | 0.5-2 | 10 | Vesicular lava, breccia lava, welded breccia, volcanic breccia, autoclastic breccia lava | Upper subfacies of effusive facies, splash subfacies of explosive facies, hot clastic flow subfacies of explosive facies, fallout subfacies of explosive facies, volcanic conduit facies | Near elliptic, rhombic, harbor like, regular phenocrystic | Strong | Dissolution throat (medium and small throats), fractured | (Ir)regular thick-short tubular, (ir)regular thick-long tubular, (Ir)regular fine-long tubular, irregular sheetlike | 0.25-0.5 mainly | Medium, strong | Dissolution-porous, fractured–dissolution-porous | Medium | ||
| Matrix dissolution pores | < 0.5 | 7 | Vesicular lava, tuffaceous lava, welded tuff, crystalline tuff, tuff | Lower subfacies of effusive facies, splash subfacies of explosive facies, hot clastic flow subfacies of explosive facies, hot base surge subfacies of explosive facies, fallout subfacies of explosive facies | Regular phenocrystic, disseminated | Fairly strong | Dissolution throat (thin and microthroat), fractured | (Ir)regular thick-short tubular, irregular sheetlike | Mostly < 0.25 | Medium | Fractured–dissolution-porous | Medium | ||
| fracture | Structural fracture | Small-macrofractures | > 0.1 | 70 | Various volcanic rocks | Various lithofacies/subfacies | Developed in group (flat, slightly curved) linear, stripelike | Weak | Strong | Fractured | Low yield, without stable production capability | |||
| Dissolution fracture | Small-macrofractures | > 0.1 | 5 | Various volcanic rocks | Various lithofacies/subfacies | (Flat, slightly curved, highly curved) linear, sheetlike | Weak | Strong | ||||||
| Contraction fracture | Micro- medium fractures | Various sizes | 12 | Vesicular lava | Upper subfacies of effusive facies, lower subfacies of effusive facies, volcanic conduit facies | Crevasse cracklike, concentric circular | Very weak | Fairly strong | ||||||
| Blast fracture | Micro- small fractures | < 0.1 | 8 | Crystal tuff, cryptoexplosive breccia | Hot base surge subfacies of explosive facies, cryptoexplosive breccia subfacies of volcanic conduit facies | (Flat, straight, slightly curved) linear, netlike | Very weak | Fairly strong | ||||||
| Sutured fracture | Micro fractures | < 0.1, basically closed | 5 | Volcanic breccia, crystalline tuff | Fallout subfacies of explosive facies, hot base surge subfacies of explosive facies | Highly curved linear | Very weak | Weak | ||||||

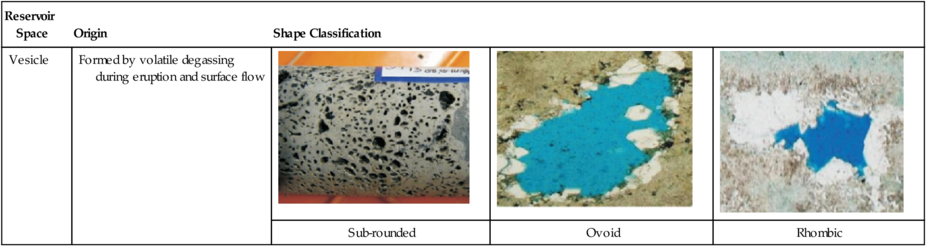
1) Vesicles
When a volcano erupts, the magma containing a great amount of volatiles is degassed upon reaching the surface, and the volatiles escape from this magma to leave behind primary pores (e.g., vesicles), which are the products of effusion. The radius of vesicles in volcanic rocks varies significantly (up to 100 mm and over). In terms of pore radius [8], vesicles can be divided into four types: vesicular pores (those with a radius > 2 mm), microvesicle (with a radius from 0.5 mm to 2 mm), small vesicles (with a radius from 0.01 mm to 0.5 mm), and microvesicles (with a radius < 0.01 mm).
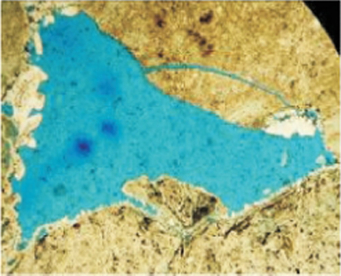
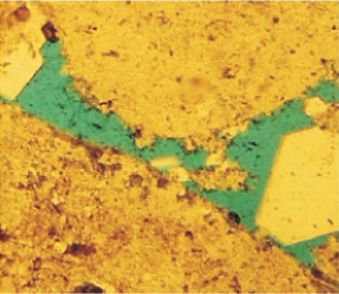
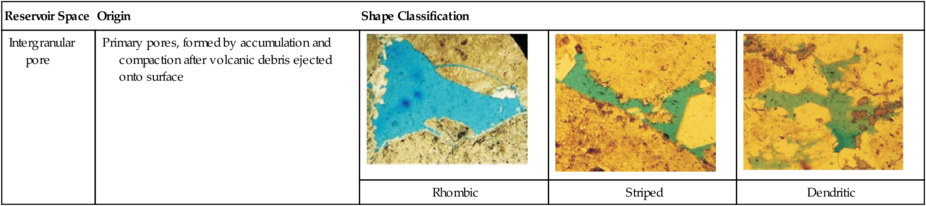
2) Intergranular pores
Intergranular pores refer to the primary pores formed between clasts during accumulation and compaction after a great amount of volcanic clastic mass erupted out of surface as the product of explosion. In terms of their radius and genesis, intergranular pores can be divided into four types: intergranular cavities (with a radius > 2 mm), macro-intergranular pores (with a radius from 0.5 mm to 2 mm), small intergranular pores (with a radius from 0.01 mm to 0.5 mm), and matrix micropores (with a radius < 0.01 mm).
3) Dissolution pores
Dissolution pores refer to the secondary pores originating from the formation of vesicles, intergranular pores, and matrixes as a result of partial or complete dissolution of soluble components such as feldspar phenocryst, and volcanic ash in rocks by meteoric water, organic acids, and acidic water with CO2 retained during burial and diagenetic evolution after volcanic rocks and primary pores formed. In terms of pore radius, dissolution pores can be divided into three types: dissolution cavities (with a radius > 2 mm), dissolution pores (with a radius from 0.5 mm to 2 mm), and matrix dissolution pores (with a radius < 0.5 mm).
4) Fractures
Fracture refers to the sheetlike space in volcanic rocks. In terms of their origins, fractures are divided into five types: (1) contraction fractures, which are primary fractures formed by irregular contraction of magma due to an uneven decrease in internal temperature during volcanic action; (2) blast fractures, primary fractures formed in volcanic rocks when gas-liquid exploded in a volcano; (3) structural fractures, secondary fractures generated by tectonic activities after volcanic rocks are formed; (4) dissolution fractures, secondary fractures formed by enlargement of original fractures due to the dissolution of soluble components when meteoric water or underground water seeps along fractures; and (5) sutured fractures, serrated contact fractures between adjacent rock beds or two parts of the same rock bed, generated by a pressure solution. With reference to the classification criteria of fracture width in carbonate rocks [8], fractures in volcanic rocks are divided into four categories: macrofractures (those with a width > 10 mm), medium fractures (with a width from 1 mm to 10 mm), small fractures (with a width from 0.1 mm to 1 mm), and microfractures (with a width < 0.1 mm). Generally speaking, structural fractures in volcanic rocks have a large width and length and are mostly small to macrofractures; dissolution fractures have complex origins and their width and original length vary greatly before dissolution enlarges the width further, but they are mostly small to macrofractures; sutured fractures have a large extension but are usually closed; contraction and blast fractures have a small width and extension and are normally micro to small fractures. In comparison, the large columnar joints developed near volcanic conduits are of contraction origin, dominated by medium fractures.
11.2.2 Identification of reservoir spaces in volcanic gas reservoirs
The identification of reservoir spaces is crucial for understanding the developmental characteristics of reservoir spaces in volcanic rocks. It provides a basis for characterizing the shape, scale, and accumulation capacity of reservoir spaces. By taking into consideration the complexity of reservoir spaces in volcanic rocks, the identification markers for various types of reservoir spaces are set up (Table 11.2) based on the classification, and the identification is conducted by integrating outcrop observation, core description, and thin section examination, according to the technical approach that progresses from macroscopic to microscopic analysis. The procedures mainly include (1) distinguishing pores and fractures according to shape markers; (2) identifying dissolution pores and fractures according to markers of dissolution traces; and (3) identifying effective reservoir spaces in terms of the types of reservoir spaces (such as pores and fractures), respectively, on the basis of lithology, lithofacies, rock structure, and texture as well as the identification markers such as shape, scale, and configuration of reservoir spaces.
Table 11.2
Identification Markers of Reservoir Spaces in Volcanic Rocks
| Type of Reservoir Space | Identification Marks of Reservoir Space | |||||||
| Lithology | Lithofacies/Subfacies | Structures/Textures | Shape | Size or Scale | Occurrence | Dissolution Trace | ||
| Pore | Vesicle | Volcanic lava, volcanic clastic lava, welded clastic rock | Effusive facies, splash subfacies of explosive facies, hot clastic flow subfacies of explosive facies | Rhyolitic structure, spherulitic texture, welded texture | Nearly rounded, elliptic, rhombic | Commonly cavity and macropore | Usually in directional arrangement and rhyolitic texture is formed | None |
| Intergranular pore | Volcanic clastic rock, welded clastic rock, autoclastic breccia lava | Explosive facies, volcanic conduit facies | Agglomerate texture, volcanic breccia texture, tuffaceous texture, autoclastic texture | Rhombic, striped, dendritic | Small pore and micropore mainly | Non-directional | None | |
| Dissolution pore | Various volcanic rock | Various lithofacies | Various rock textures | Various shapes, more irregular | Commonly cavity and macropore | Consistent to primary pores | Dissolution residues, dissolution dents and pitches, dissolution embayment | |
| Fracture | Contraction fracture | Volcanic lava | Effusive facies, volcanic conduit facies | Perlitic structure, columnar joint | Crevasse crack like, concentric circular | Small to large sized pores are all developed | Joint fractures spread along passages and contraction fractures spread disorderly | None |
| Blast fracture | Volcanic clastic rock | Explosive facies, volcanic conduit facies | Agglomerate texture, volcanic breccia texture, tuffaceous texture, cryptoexplosive texture | (Flat, slightly curved) linear, netlike | Small width, short extension, small scale | Scattered and chaotic | None | |
| Structural fracture | Various volcanic rock | Various lithofacies | Various rock textures | Developed in group (flat, slightly curved) linear, striped | Fairly large width, long extension, large scale | With low to high angle, developed in group | None | |
| Dissolution fracture | Under control of primary fractures | Dissolution residues, dissolution dents and pitches, dissolution embayment | ||||||
| Sutured fracture | Volcanic clastic rock | Hot base surge subfacies of eruptive facies, fallout subfacies of explosive facies | Volcanic breccia texture, crystalline tuffaceous texture | Highly curved linear (serrated) | Small width, usually closed | Consistent with rock bed interface | None | |

1 Identification of vesicles
Vesicles are the product of effusion, with different characteristics of size, shape, and configuration from other types of pores. According to their origins and characteristics, therefore, vesicles in volcanic rocks can be identified effectively by taking an integrated analysis of their characteristics in lithology, lithofacies, texture, and structure of vesicle-bearing volcanic rocks.
1) Characteristics of lithology and lithofacies
Volcanic lithofacies represent an important controlling factor for the type and development of primary pores [9]. Effusion and degassing of volatiles are key factors controlling the formation of vesicles. In volcanic rocks, therefore, vesicles are typically developed in the effusive facies (see Table 11.2), especially in lithotypes such as rhyolite, andesite, and basalt. In addition, vesicles can also be developed in other volcanic lithofacies with effusion involved, such as the splash subfacies and hot clastic flow subfacies of the explosive facies, with greater effusion correlated with better development of vesicles.
2) Characteristics of rock structure and texture
As the markers for lithology and lithofacies characteristics, typical rock textures and structures can serve as indirect guides for identifying reservoir spaces. The effusion of magma usually results in the directional arrangement of vesicles and magma constituents; therefore, typical rhyolitic structure and welded texture are formed, and spherulitic textures are usually formed during the cooling of magma. Hence, rhyolitic structure, spherulitic texture, and welded texture are indirect identification markers for vesicles (Figure 11.2b and c).
3) Characteristics of shape and configuration (occurrence)
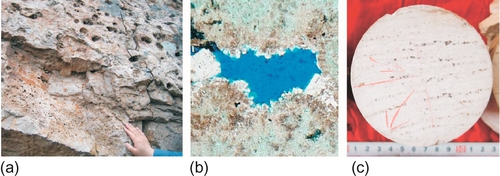
Vesicles are formed by the free escape of volatile constituents in the form of bubbles along the direction toward lower pressure after degassing from the magma. The vesicle shape is affected by many factors, such as pressure distribution in the magma, bubble escape pathways, and magma flow dynamics. In general, well-preserved vesicles are characterized by a simple and regular porous shape and a smooth pore wall, mostly in sub-rounded or ovoid shapes (Figure 11.2a); when the vesicles are filled by secondary minerals after formation, their shapes become complicated and may result in a rhombic shape (Figure 11.2b).
As affected by magma flow, the important difference between vesicles and intergranular pores lies in the directional arrangement of vesicles along the direction of magma flow.
4) Characteristics of size
The vesicle size and degree of vesicle development are affected by many factors, such as the composition, gathering speed, and escaping speed of volatile constituents, as well as magma viscosity and external pressure. Higher volatile concentration, faster gathering and escaping speeds, lower magma viscosity, and lower external pressure correspond to larger vesicles and better-developed vesicles. In the top subfacies of the effusive facies, vesicles are typically large (fist sized) and are well developed like honeycombs; in the middle subfacies of the effusive facies, vesicles are small (pinhole sized), poorly developed, and scattered; in the lower subfacies of the effusive facies, the vesicles sizes are in between those of the upper and middle subfacies (Figure 11.4). Volcanic lava is more compaction resistant than volcaniclastic rocks and thus can better preserve the vesicle porous spaces. The large pores observed in outcrops and cores are mostly vesicles.
2 Identification of intergranular pores
Intergranular pores are the product of explosive volcanic eruption. They are affected by the process of volcanic clastic formation, accumulation, and compaction, and their size, shape, and occurrence differ from those of vesicles. Intergranular pores in volcanic rocks are identified systematically by integrating the characteristics of lithology, lithofacies, structure, and texture of the rocks associated with intergranular pore development.
1) Characteristics of lithology and lithofacies
Intergranular pores are developed mainly in rocks of the explosive lithofacies (see Table 11.2), such as volcaniclastic rocks. Stronger explosions will produce better-developed intergranular pores. In the explosive facies, for example, the intergranular pores of the hot clastic flow subfacies are better developed than those of the splash subfacies. Additionally, in volcanic conduit facies, some intergranular pores are developed in the autoclastic brecciated lava formed by cryptoexplosion.
2) Characteristics of rock structure and texture
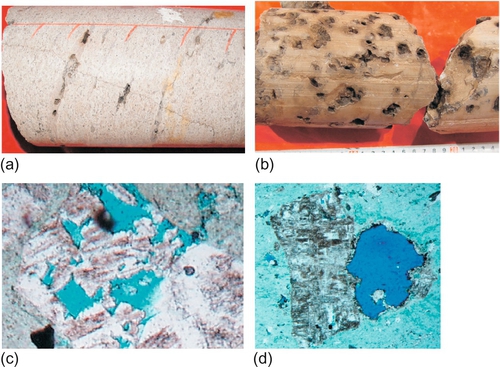
Volcanic explosion breaks the magma into volcanic debris of various sizes and ejects them out of volcanic conduits, and volcanic clastic rocks and their unique intergranular pores are formed by accumulation and compaction of the ejecta. Therefore, the structure and texture of volcaniclastic rocks may be used as indirect identification markers for intergranular pores. In volcanic agglomerates, the agglomeratic textures are developed and their reservoir spaces are dominated by large interclast pores. In volcanic breccia, breccia textures are developed. In autoclastic breccia lava, autoclastic textures are developed and their reservoir spaces are dominated by intergranular pores. In tuff, tuffaceous textures are developed and matrix micropores are dominant (Figure 11.3).

3) Shape characteristics
The shape of an intergranular pore is affected mainly by the shape, sorting, and textural maturity of volcanic debris. Because of the irregular shape of volcanic debris, poor sorting, and low textural maturity, the well-preserved intergranular pores usually have features of simple porous shape with distinct angles (see Figure 11.3), with larger intergranular pores having more irregular shapes. The interclast pores developed in volcanic agglomerate and volcanic breccia are mostly rhombic and stripe shaped, whereas the matrix micropores developed in tuff usually have a simple rhombic shape. Different from vesicles, intergranular pores normally do not show any directional pattern.
4) Size characteristics
The size of intergranular pores is affected by the type, size, sorting, and filling material of volcanic clastic rocks. Volcanic agglomerate and breccia with good sorting tend to be clast supported, forming large interclast pores. In contrast, poorly sorted agglomerates and breccia result in small grains or matrix filling in between the large clasts and hence smaller interclast pores. The matrix micropores developed in tuff are fairly small (see Table 11.1 and Figure 11.3).
3 Identification of dissolution pores
Dissolution pores are of secondary origin, formed by the dissolution of soluble components such as feldspar phenocrysts and volcanic ash in vesicles, intergranular pores, and matrix mass. Compared with vesicles and intergranular pores, the shapes of dissolution pores are fairly diverse and occur in a wide range of lithology and lithofacies. Dissolution pores can be identified systematically by integrating dissolution trace markers with features associated with changes in pore shape and size.
1) Characteristics of lithology and lithofacies
Dissolution occurs normally in places where primary pores and fractures are developed and high concentrations of solvable material are present, typically in the proximal location of volcanic conduits or near major deep faults. Therefore, the typical lithofacies for the development of dissolution pores include volcanic neck subfacies of the volcanic conduit facies, splash subfacies of the explosive facies, and top subfacies of the effusive facies, typified by volcanic clastic lava and volcanic lava, with volcanic clastic lava of the splash subfacies having mostly well developed dissolution features (see Table 11.2). Dissolution pores are developed also in the top subfacies of the effusive facies, lower subfacies of the effusive facies, hot clastic flow subfacies, fallout subfacies, and hot base surge subfacies of the explosive facies, and the degree of pore development depends on the burial depth, property, and activity intensity of formation water.
2) Markers of dissolution traces
Because of the differences in soluble components or incomplete dissolution, traces such as dissolution residues, dents, and pitches as well as dissolution embayment are commonly formed in dissolution pores (see Figure 11.4), providing important identification markers. From outcrops and cores from the volcanic gas reservoirs of the XX gas field, dissolution pores distributed along structural fractures can be observed, and black or grayish black dissolution residues can be found in pores (Figure 11.4a). Additionally, due to the dissolution of soluble components, the radius of dissolution pores tends to be enlarged and its shape becomes more irregular (Figure 11.4b). In cast thin sections, dissolution embayment formed by the incomplete dissolution of soluble components can be seen (Figure 11.4c), and regular porphyritic dissolution pores originating from complete dissolution of phenocrysts are visible (Figure 11.4d).
3) Shape characteristics
The shape of dissolution pores is affected mainly by the shape of primary pores, dissolution pathways, dissolution intensity, and distribution of soluble components. When a phenocryst dissolves completely, the cast pore thus formed has a fairly regular outline (Figure 11.4d), whereas that formed by partial dissolution of soluble components appears irregular, complicated, and varied (Figure 11.4a to c). Therefore, the shapes of dissolution pores are mostly sub-rounded, rhombic, embayed, and disseminated, rarely assuming a regular phenocryst shape.
4) Size features
The sizes of dissolution pores are affected by the sizes of primary pores and dissolution intensity. In general, their radiuses are larger than those of primary vesicles and intergranular pores, and they are more widespread. At present, the largest radius of dissolution pores observed in cores from the XX volcanic gas reservoir is up to 10 × 30 cm.
4 Fracture identification
Fractures refer to the sheetlike spaces in rocks, distinctly different from pores with an approximately equidimensional shape. Based on their origins, fractures in volcanic rocks can be divided into five types: contraction fractures, blast fractures, structural fractures, dissolution fractures, and sutured fractures. They have different sizes, shapes, and occurrence and are developed in different lithological and lithofacies settings. On the basis of these characteristics, various types of fractures in volcanic rocks can be effectively identified according to fracture-bearing lithology and lithofacies as well as their rock textures and structures.
1) Characteristics of lithology and lithofacies
Contraction fractures are produced from uneven magma cooling, especially in volcanic lava of the upper and lower subfacies of the effusive and volcanic conduit facies. Blast fractures are formed by gas-liquid explosion, developed mainly in volcanic clastic rocks of the explosive facies and cryptoexplosive breccia of the volcanic conduit facies. Structural fractures and dissolution fractures may be developed in various types of lithologies and lithofacies. Sutured fractures are found mainly in crystalline tuff in the hot base surge subfacies of the explosive facies.
2) Shape characteristics
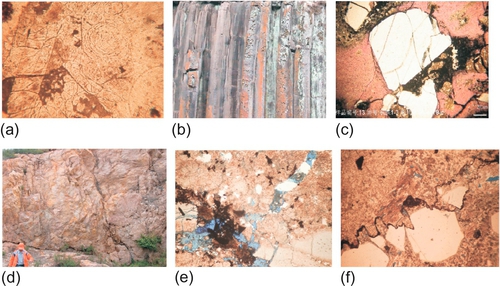
The shapes of fractures in volcanic rocks are diverse, with each fracture type having its own distinct morphological characteristics. Contraction fractures are affected by the distribution and variation of temperature during magma cooling, and they appear mostly as concentric circular and crevasse cracks (Figure 11.5a); large columnar joints near a volcanic conduit is regularly polygonal in cross section and flat linear in longitudinal section (Figure 11.5b). The shape of blast fractures is influenced by the intensity of gas-liquid explosion and the size and shape of phenocrysts, being generally netlike, with single fractures showing a flat or slightly curved linear pattern (Figure 11.5c). Structural fractures are formed from tectonic activities and the differential in the stress resistance of rocks, appearing in a linear pattern or grouped stripes, and a single fracture shows a flat or slightly curved linear pattern with a flat and regular fracture surface (Figure 11.5d). The shape of dissolution fractures is affected by the geometry of primary fractures and the dissolution pathways and intensity, and they manifest mostly netlike, crevasse-crack, flat to highly curved linear or stripe patterns, with various widths of fracture surfaces and irregular edges (Figure 11.5e). A sutured fracture is associated with the shape of its interface with the rock bed and pressure solution surfaces, mostly having a serrated or highly curved linear pattern with uneven fracture surfaces (Figure 11.5f).
3) Characteristics of fracture scales
Contraction fractures are normally small in scale, with a small width and short extension. However, contraction joint fractures near volcanic conduits may have large scales, with vertical extension up to tens of meters. Blast fractures are small in scale, with a small width and short extension. Structural fractures tend to be large in scale, wide, with a long extension. The size of dissolution fractures is related to the size of the primary fractures and the dissolution activity, characterized by a large scale, with a great width (wider than that of the primary one) and long extension. Sutured fractures may extend longer but are usually closed with a small scale; thus, they are of little significance in terms of accumulation and permeation capacity.
4) Occurrence characteristics
Primary fractures include small contraction fractures distributed stochastically, as well as large columnar joint fractures spreading in the direction of passages. The strike and trend of blast fractures are highly random and their occurrence has no obvious patterns. Structural fractures are controlled by the paleostress field, and their strikes and trends are regular as developed mostly in groups. In the volcanic reservoirs of the XX gas field, for example, high-angle structural fractures have a predominantly north-north-west (NNW) strike. The occurrence of dissolution fractures is influenced by the occurrence of primary ones. Most sutured fractures have low angles, with their occurrence basically consistent with that of the strata or lithofacies (Figure 11.5f).
5) Markers of dissolution traces
The dissolution traces—shown on fracture surfaces such as dissolution residues, dents and pitches, and embayments—constitute the main basis for the identification of dissolution fractures in volcanic rocks (Figure 11.5e).
5 Distribution characteristics of reservoir spaces
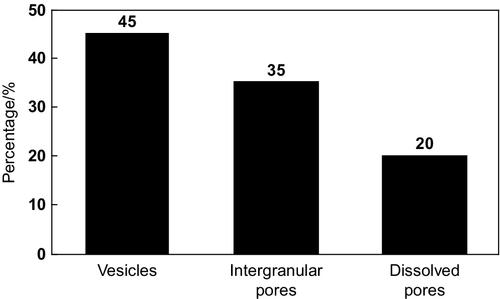
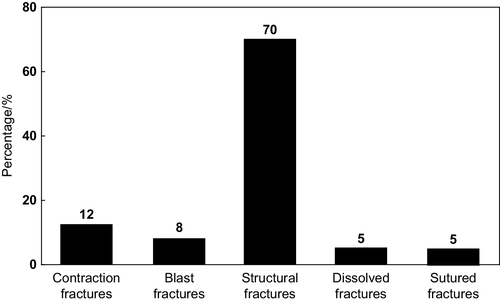
The identification results of volcanic gas reservoir spaces in the XX gas field revealed the following characteristics of classified reservoir spaces in volcanic gas reservoirs (see Table 11.1). (1) Pores are predominant in volcanic reservoir spaces, with a share of matrix porosity over 95% of the total porosity; fractures are well developed but make up less than 5% of the total porosity. (2) In these gas reservoirs, volcanic lava formed by center-fissured eruption is predominant and the effect of later dissolution is limited, so vesicles are mostly well developed in volcanic rocks, accounting for about 45% (Figure 11.6); intergranular pores rank second, accounting for about 35%; and dissolution pores are poorly developed, accounting for about 20%. (3) Among fractures in volcanic rocks, structural fractures are most common, accounting for about 70% (Figure 11.7); contraction fractures account for about 12%; blast, dissolution, and sutured fractures account for about 8%, 5%, and 5%, respectively.
11.2.3 Characterization of reservoir spaces in volcanic gas reservoirs
On the basis of the identification of classified reservoir spaces in volcanic gas reservoirs, the shape, scales, and accumulation capacity of these reservoir spaces are characterized further using methods of core observation, thin section examination, and experimental analysis.
1 Shape characterization of reservoir spaces
Cores provide important firsthand information for understanding reservoirs in the subsurface [10]. From core observation and description, the shapes of large reservoir spaces can be identified and confirmed visually. As to the small reservoir spaces, which cannot be observed directly and visually, Scanning Electric Microscope (SEM) uses cast thin sections to observe the shape of pores. For shape characterization of reservoir spaces, therefore, the two methods described earlier are integrated, and numerous cores and cast thin sections have been examined and analyzed to explain the characteristics of shape and distribution of various types of reservoir spaces.
1) Vesicles
Normally, volatile gas is expelled from magma as bubbles, which is affected by the flow of magma. As a result, vesicles show elongation and deformation along the flowing direction of magma, mostly having sub-rounded and ovoid shapes. After vesicles are formed, an irregular rhombic morphology would be produced if matrix filling occurred or filling and replacement by secondary minerals took place during later diagenetic processes (Table 11.3). In general, the nearly rounded vesicles are distributed mostly in the middle subfacies of the effusive facies, which is rarely affected by magma flow. Ovoid vesicles are distributed mainly in the top, upper, and lower subfacies of the effusive facies, and rhombic vesicles are usually distributed in the top and lower subfacies. In the XX gas field, ovoid vesicles are most common, accounting for about 50%, sub-rounded ones account for about 30%; and rhombic vesicles account for 20%.

2) Intergranular pores
Normally, volcanic debris tends to accumulate in situ, and therefore they have poor roundedness and sorting, leading to irregular-shaped intergranular pores. In comparison, well-sorted volcanic debris lead to rhombic intergranular pores with granular support; for moderate sorting, a striped pattern supported by multiple grains tends to be developed in intergranular pores; poor sorting is associated with a complicated dendritic pattern jointly supported by grains and matrix (Table 11.4). The rhombic and striped intergranular pores are usually developed in volcanic breccia of the fallout subfacies and in welded breccia of the hot clastic flow subfacies, both of the explosive facies; the dendritic intergranular pores tend to be developed in the tuffaceous breccia or brecciated tuff of the fallout subfacies; and the shape of micropores is relatively simple, most common in welded tuff of the hot clastic flow subfacies, crystalline tuff of the hot base surge subfacies, and tuff of the fallout subfacies. In the XX volcanic gas reservoir, rhombic intergranular pores are predominant, accounting for about 60%; dendritic ones account for about 25%; and striped ones account for only about 15%.

3) Dissolution pores
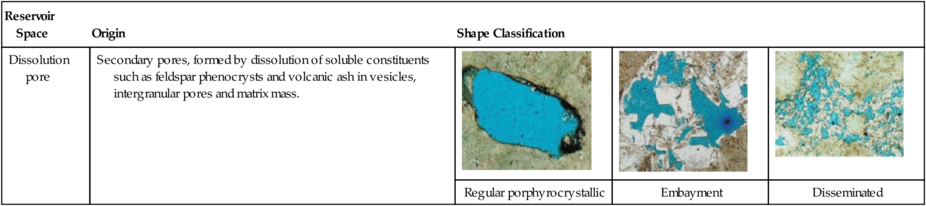
The shape of dissolution pores is affected mainly by dissolution and the property of soluble components. When phenocrysts are dissolved completely, the dissolution pores assume the regular phenocryst morphology; when secondary minerals in vesicles or intergranular pores are locally dissolved or the phenocrysts and matrix are partially dissolved, most of the dissolution pores appear as dissolution embayments; when volcanic ash is partially dissolved through weak dissolution activities, the dissolution pores usually have a disseminated and complex pattern (Table 11.5). Regular phenocryst dissolution pores are mostly developed in porphyrocrystallic tuff and rhyolite; dissolution embayments are widespread in various volcanic lava and volcanic clastic rocks; disseminated dissolution pores are most common in various volcanic tuff. In the XX volcanic gas reservoir, dissolution embayments are predominant, accounting for about 50%; disseminated ones account for about 35%; and regular porphyrocrystallic ones are poorly developed, accounting for only about 15%.
Table 11.5
Shape Classification of Dissolution Pores in Volcanic Gas Reservoirs
| Reservoir Space | Origin | Shape Classification | ||
| Dissolution pore | Secondary pores, formed by dissolution of soluble constituents such as feldspar phenocrysts and volcanic ash in vesicles, intergranular pores and matrix mass. |  | 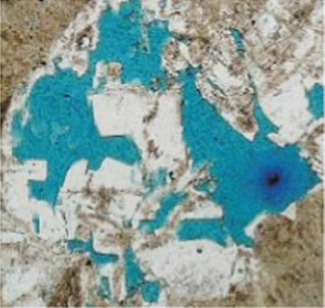 | 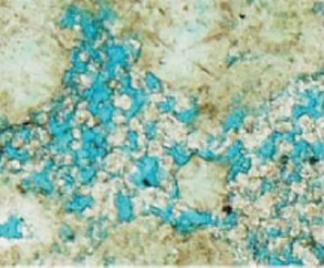 |
| Regular porphyrocrystallic | Embayment | Disseminated | ||
4) Fractures
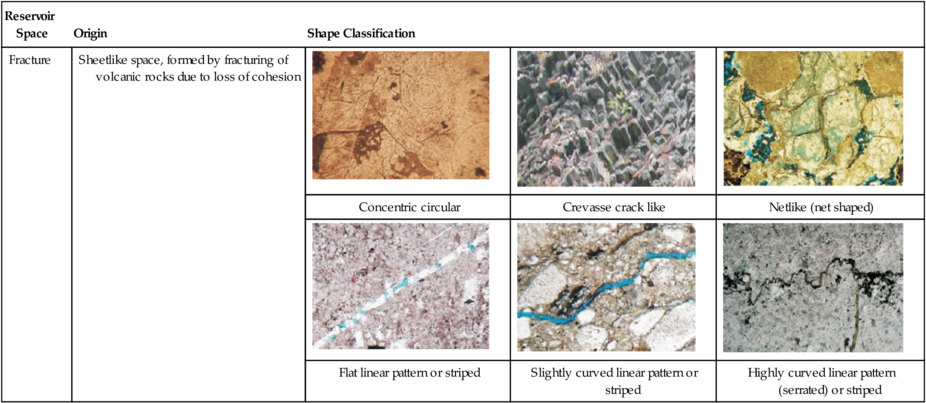
Outcrop observation, core description, and thin section examination indicate that the fracture shapes in volcanic reservoirs are closely related to their petrogenetic origins. Overall they can be divided into three types: concentric circular, crevasse cracklike, and netlike (or net shaped). Individual fractures manifest in three patterns: flat linear, slightly curved linear, and highly curved linear (or serrated) (Table 11.6). Significant differences exist among various fracture shapes. (1) The shape of contraction fractures follows the evolution pattern in crystallo-mineralogy, appearing mostly as concentric rings and crevasse cracks, whereas the large columnar joints near volcanic conduits are regular net shaped. (2) Blast fractures are formed by cryptoexplosions, manifesting as crevasse cracks and networks, and the individual fractures have a flat to slightly curved linear pattern. (3) Structural fractures exhibit flat to slightly curved linear and striped patterns mostly developed in groups. (4) The shape of dissolution fractures is complex and usually appears as crevasse cracks and networks, with individual fractures having slightly to highly curved linear or striped patterns. (5) Finally, sutured fractures are formed by compaction and pressure solution controlled by multiple factors, including rock bedding, tectonic stress field, and formation compressibility, and characterized by a highly curved linear (or serrated) pattern. In the XX volcanic gas reservoir, the predominance of structural fractures is associated with flat to slightly curved linear patterns, accounting for about 80%; the crevasse crack and netlike patterns account for about 12%; the highly curved linear and concentric circular patterns are poorly developed, accounting only for about 5% and 3%, respectively.
Table 11.6
Shape Classification of Fractures in Volcanic Gas Reservoirs
| Reservoir Space | Origin | Shape Classification | ||
| Fracture | Sheetlike space, formed by fracturing of volcanic rocks due to loss of cohesion |  | 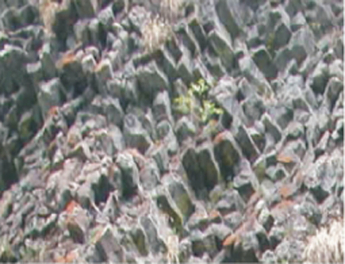 |  |
| Concentric circular | Crevasse crack like | Netlike (net shaped) | ||
 | 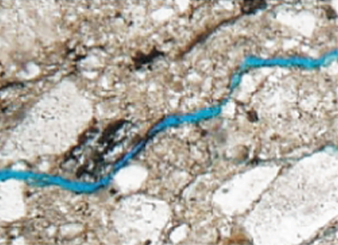 | 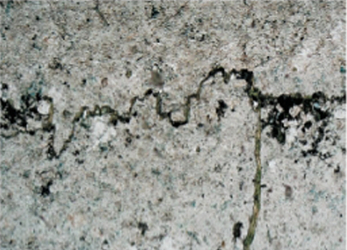 | ||
| Flat linear pattern or striped | Slightly curved linear pattern or striped | Highly curved linear pattern (serrated) or striped | ||
2 Size characterization of reservoir spaces
1) Pore sizes
Overall features
Pore sizes in volcanic gas reservoirs are characterized by integrating core observation, thin section examination, and constant-rate mercury injection.
Cores offer important firsthand information. Through visual observation, the characteristics of pore size, development, and distribution of the larger pores can be identified, so as to qualitatively characterize the features of pore size in volcanic rocks. In the XX gas field (Table 11.7), the pore radius in volcanic rocks ranges mainly from 0.1 mm to 1 mm up to a maximum of 300 mm. Small pores are mostly well developed, accounting for about 57%; macropores account for about 35%; cavities are poorly developed, accounting for only about 8%; and micropores cannot be observed visually.
Table 11.7
Characteristics of Pore Size in Volcanic Reservoirs (XX Gas Field)
| Characterization Method | Maximum Pore Radius, mm | Main Range, mm | Various Sizes of Pores, % | |||
| Cavity (> 2 mm) | Macropore (0.5-2 mm) | Small Pore (0.01-0.5 mm) | Micropore (< 0.01 mm) | |||
| Core observation | 300 | 0.1-1 | 8 | 35 | 57 | 0 |
| Cast thin section | 10 | 0.01-0.5 | 2 | 20 | 40 | 38 |
| Constant-rate mercury injection | 0.46 | 0.1-0.2 | 0 | 0 | 100 | 0 |
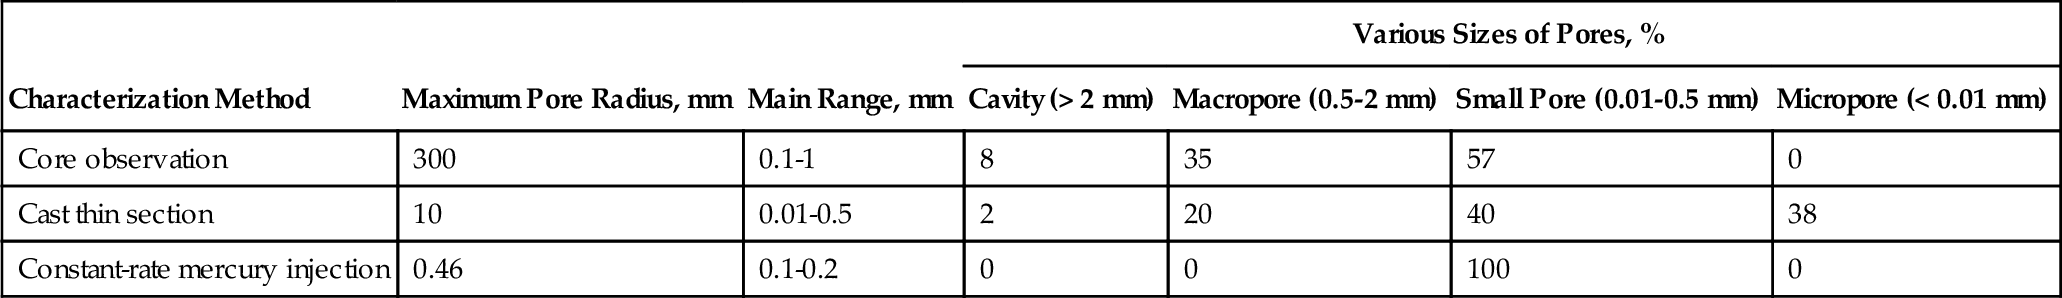
For the microscopic pores that cannot be observed visually, SEM examination is applied by using cast thin sections, allowing the characteristics of pore size, development, and distribution to be determined so as to semiquantitatively characterize the features of pore size in volcanic rocks. In the XX gas field (see Table 11.7), thin sections demonstrate that the pore radius in the volcanic rocks usually ranges from 0.01 mm to 0.5 mm, reaching a maximum of 10 mm. Small pores are mostly well developed, accounting for about 40%; micropores account for about 38%; macropores account for about 20%, and cavities account for about 2%.
Constant-rate mercury injection method
In this method, mercury is injected into pores at a constant low rate (normally as low as 0.00005 mL/min), allowing them to approach a quasi-static state. The moment mercury breaks through the throat restriction and enters into a pore space, pressure drops instantaneously and then builds up again when the entire pore is being filled, until mercury enters into the next pore (Figure 11.8). The measurements of pressure drop and rise during mercury injection are used to interpret pores and throats within the rock and to generate the capillary pressure curves of pores and throats as well as the characteristic parameters of microscopic porous structure such as distributions of pore radius, throat radius, and the ratio of pore radius to throat radius [11]. The analysis of 24 volcanic rock samples used for constant-rate mercury injection in the XX gas field (see Table 11.7) shows that the pore radius in the volcanic rock falls mainly in the range of 0.1 mm to 0.2 mm, up to a maximum of 0.46 mm, all being in the class of small pores.

In the three methods discussed, cores can provide information only on the distribution of large, visually recognizable pores. Thin sections can provide a better characterization of pore sizes in volcanic rocks, but the representative samples are inadequate. In constant-rate mercury injection, mercury is injected into pores in a quasi-static process, but a problem arises if mercury fails to enter some micropores and throats or if the representative samples are inadequate. Therefore, it has been necessary to integrate the three methods for the characterization. The analytical results indicate a wide range of pore sizes in volcanic rocks, but overall small pores are predominant, macropores and micropores rank the second, and cavities are developed only locally (see Table 11.7).
Sizes of various pore types
Pore sizes are highly variable in volcanic rocks due to their different origins (Table 11.8).
Table 11.8
Size Features of Various Pore Types in Volcanic Reservoirs (XX Gas Field)
| Pore Type | Maximum Pore Radius, mm | Main Range, mm | Different Sizes of Pores, % | |||
| Cavity (> 2 mm) | Macropore (0.5-2 mm) | Small Pore (0.01-0.5 mm) | Micropore (< 0.01 mm) | |||
| Vesicles | 200 | 0.1-1 | 10 | 45 | 40 | 5 |
| Intergranular pores | 50 | 0.01-0.5 | 6 | 22 | 43 | 29 |
| Dissolution pores | 300 | 0.1-0.2 | 10 | 50 | 32 | 8 |
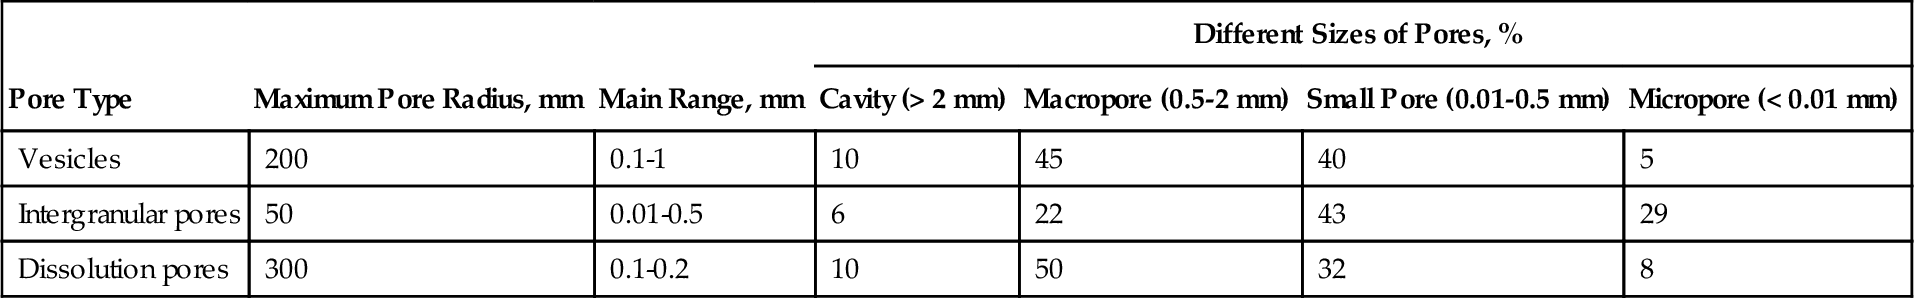
Volatile constituents are most prone to escape from the top of the flowing magma but are most stable in the middle. Therefore, vesicular cavities are mainly developed in volcanic lava of the top and upper subfacies of the effusive facies as well as breccia lava and tuffaceous lava in the splash subfacies of the explosive facies. Macrovesicles are predominant in volcanic lava in the upper and lower subfacies of the effusive facies. Small vesicles are common in tight volcanic lava in the middle subfacies of the effusive facies as well as welded tuff and welded breccia in the hot clastic flow subfacies of the explosive facies. Microvesicles are mainly formed in massive tight volcanic lava of the middle subfacies (see Table 11.1). In the XX gas field (see Table 11.8), the pore radius in volcanic rocks mainly ranges from 0.1 mm to 5 mm, reaching a maximum of 300 mm. On the whole, macropores are most common, accounting for about 45%; small pores account for about 40%; and vesicular cavities and micropores are poorly developed, accounting for about 10% and 5%, respectively.
A stronger explosion is correlated with larger volcanic debris and a larger radius and scale of intergranular pores. Therefore, intergranular pores are mainly distributed in volcanic agglomerate and volcanic breccia of fallout subfacies of the explosive facies. Macro-intergranular pores are distributed primarily in volcanic breccia of the fallout subfacies, welded breccia in hot clastic flow subfacies of the explosive facies, and autoclastic breccia lava of the volcanic conduit facies. Most small intergranular pores occur in volcanic breccia of the fallout subfacies as well as welded breccia and welded tuff of the hot clastic flow subfacies. Matrix micropores are found mostly in crystalline tuff of the fallout subfacies and welded tuff of the hot clastic flow subfacies (see Table 11.1). In the XX gas field (see Table 11.8), the intergranular pore radius in the volcanic rocks ranges primarily from 0.01 mm to 0.5 mm, reaching a maximum of 50 mm. In general, small intergranular pores are the most common, accounting for about 43%; matrix micropores and intergranular macropores rank second, accounting for about 29% and 22%, respectively; and intergranular cavities are poorly developed, accounting for only about 6%.
Larger primary pores and higher soluble contents reflect the stronger dissolution activity and larger radius and scale of dissolution pores. Dissolution cavities are normally developed in vesicular lava of top and upper subfacies of the effusive facies, brecciated lava of splash subfacies of the explosive facies, and volcanic breccia of fallout subfacies of the explosive facies. Most dissolution pores are distributed in vesicular lava of the upper subfacies, breccia lava of the splash subfacies, welded breccia of hot clastic flow subfacies of the explosive facies, volcanic breccia of the fallout subfacies, and autoclastic breccia lava of the volcanic conduit facies. Matrix dissolution pores are usually found in vesicular lava of lower subfacies of the effusive facies, tuffaceous lava of the splash subfacies, welded tuff of the hot clastic flow subfacies, crystalline tuff of hot base surge subfacies of the explosive facies, and fallout subfacies tuff (see Table 11.1 and Figure 11.9). In the XX gas field, the dissolution pore radius in the volcanic rocks usually ranges from 0.01 mm to 10 mm, reaching a maximum of 300 mm; macropores are mostly well developed, accounting for about 50%; small pores account for about 32%; and cavities and micropores are poorly developed, accounting for about 10% and 8%, respectively.

2) Fracture sizes
Core observation, cast thin section examination, and logging interpretation are usually used to characterize fracture sizes in volcanic reservoirs, taking into consideration the specific origin and morphology of various fractures (see Table 11.9 and Figure 11.10):
Table 11.9
Characteristics of Fracture Size in Volcanic Reservoirs (XX Gas Field)
| Characterization Methods | Maximum Fracture Width, mm | Main Range, mm | Different Fracture Sizes, % | |||
| Macro Fracture (> 10 mm) | Medium Fracture (1-10 mm) | Small Fracture (0.1-1 mm) | Micro Fracture (< 0.1 mm) | |||
| Core observation | 12.5 | 0.1-1 | 4 | 12 | 78 | 6 |
| Cast thin section | 2 | 0.01-0.5 | 0 | 10 | 50 | 40 |
| Log interpretation | 1.5 | 0.005-0.05 | 0 | 5 | 20 | 75 |

1. Core observation. In cores, the maximum fracture width in volcanic rocks of the XX gas field is 12.5 mm, and the fracture width ranges from 0.1 mm to 1 mm. Most fractures are in the small category, accounting for about 78%; medium factures rank second, accounting for about 12%; and micro- and macrofractures are poorly developed, accounting for 6% and 4%, respectively.
2. Cast thin section analysis. In cast thin sections, the maximum fracture width in volcanic rocks of the XX gas field is 2 mm, and the fracture width ranges from 0.01 to 0.5 mm. Most of fractures are of the small category, accounting for about 50%; microfractures are the next, accounting for about 40%; medium fractures are poorly developed, accounting for about 10%; and macrofractures are not observed.
3. Log interpretation. Fracture width is calculated through electrical imaging log color analysis and statistical models of conventional dual laterologs (see Chapter 6 for details). The log interpretation indicates that the maximum fracture width in volcanic rocks of the XX gas field is about 1.5 mm, and the fracture width ranges between 0.005 and 0.55 mm. Fractures of the micro category are dominant, accounting for about 75%; small fractures rank second, accounting for about 20%; medium fractures are poorly developed (about 5%); and macro fractures are not developed.
In the three methods discussed, core observation and cast thin section analysis are used as the chief means for characterizing fracture sizes in volcanic rocks under surface conditions, and log interpretation is applied for the characterization of subsurface data. Therefore, the integrated analysis shows that small fractures are predominant on the surface, whereas microfractures are mostly well developed in subsurface volcanic rocks.
3 Characterization of the accumulation capacity in reservoir spaces
Accumulation capacity is an important indicator for evaluating the sizes of various types of reservoir space and their fluid-bearing capacity. Two parameters—porosity and the maximum mercury intrusion saturation—are usually used to characterize the accumulation capacity of reservoir spaces in volcanic rocks.
1) Accumulation capacity of pores
Porosity and permeability tests, mercury injection experiments, and log interpretation information are used to characterize the overall accumulation capacity of pores in volcanic rocks and the accumulation capacity of various types of pores.
Overall accumulation capacity of pores
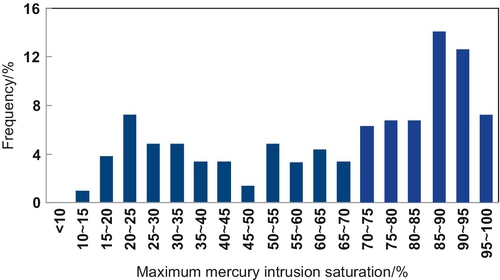
Because of their complex origins and variable shapes and sizes, the accumulation capacity of pores varies significantly. In the XX volcanic gas reservoir (Table 11.10, Figures 11.11 and 11.12), the porosity as revealed by whole core experiments of volcanic rocks ranges from 0.44% to 18.8%, mainly between 3% and 8%, with an average of 7.10%. The log interpretation indicates that the maximum effective porosity is 16.6%, the average is 6.5%, and the maximum mercury intrusion saturation has total range of 11% to 99%, a main range of either 15% to 40% or 70% to 100%, and an average of 65%, suggesting a generally strong but highly variable accumulation capacity of pores.
Table 11.10
Characteristics of the Accumulation Ability of Pores in Volcanic Reservoirs (XX Gas Field)
| Pore Type | Typical Rock | Logging Interpreted Effective Porosity, % | Experimental Porosity, % | Maximum Mercury Intrusion Saturation, % |
| Vesicle | Rhyolite | 5.14 | 6.75 | 65.42 |
| Intergranular pores | Rhyolitic volcanic breccia | 4.5 | 5.58 | 60.21 |
| Dissolution pores | Rhyolitic brecciated lava | 7.45 | 8.4 | 73.42 |
| All pores | Volcanic rocks | 6.5 | 7.1 | 65 |


Accumulation capacity of pores with various origins
Pores with different volcanic petrogeneses show great variation in accumulation capacity because of their different shapes and sizes (see Table 11.10). Dissolution pores have the highest values in effective log porosity (average 7.45%), experimental porosity (average 8.4%), and maximum mercury intrusion saturation (average 73.42%), thus they have the strongest accumulation capacity. Vesicles have moderate values in effective log porosity (average 5.14%), experimental porosity (average 6.75%), and maximum mercury intrusion saturation (average 65.42%), hence they have a moderate accumulation capacity. Intergranular pores have the lowest values in effective log porosity (average 4.5%), experimental porosity (average 5.58%), and maximum mercury intrusion saturation (average 60.21%), and thus they have the lowest accumulation capacity.
Accumulation capacity of pores with different sizes
Pores with different sizes in volcanic rocks have different levels of accumulation capacity (Table 11.11).
Table 11.11
Statistics on the Accumulation Ability of Various Types of Pores in Volcanic Gas Reservoirs (XX Gas Field)
| Pore Type | Subfacies | Effective Log Porosity, % | Experimental Porosity,% | Maximum Mercury Intrusion Saturation, % | |
| Vesicle | Macro vesicles | Top subfacies of effusive facies Upper subfacies of effusive facies Lower subfacies of effusive facies Splash subfacies of explosive facies | 5.16 | 7.14 | 65.02 |
| Small vesicles | Middle subfacies of effusive facies Hot clastic flow subfacies of explosive facies | 3.17 | 5.56 | 51.69 | |
| Intergranular pore | Macro intergranular pores | Fallout subfacies of explosive facies Hot clastic flow subfacies of explosive facies | 5.35 | 5.87 | 69.81 |
| Small intergranular pores | Fallout subfacies of explosive facies Hot base surge subfacies of explosive facies | 3.87 | 5.29 | 46.66 | |
| Dissolution pores | Dissolution pores | Top subfacies of effusive facies Upper subfacies of effusive facies Splash subfacies of explosive facies Fallout subfacies of explosive facies | 6.63 | 8.62 | 75.06 |
| Matrix dissolution pores | Lower subfacies of effusive facies Hot clastic flow subfacies of explosive facies Hot base surge subfacies of explosive facies Volcanic conduit facies | 5.31 | 6.96 | 65.49 | |

Macrovesicles (including vesicular cavities) are mostly developed in top, upper, and lower subfacies of the effusive facies and splash subfacies of the explosive facies. The complete escape of volatiles results in large sizes and well-developed vesicles, and thus favorable petrophysical properties and accumulation capacity. Most small vesicles (including micropores) are developed in the middle subfacies (effusive facies) and hot clastic flow subfacies (explosive facies). The incomplete escape of volatiles results in small sizes and poorly developed vesicles, and consequently rather poor petrophysical properties and accumulation capacity. In the XX volcanic gas reservoir, macrovesicles have relatively high values in effective log porosity, experimental porosity, and maximum mercury intrusion, at 5.16%, 7.14%, and 65.02%, respectively. Small vesicles have relatively low values in effective log porosity, experimental porosity, and maximum mercury intrusion, at 3.17%, 5.56%, and 51.69%, respectively, indicating that macrovesicles have a notably stronger accumulation capacity than small vesicles.
Macro-intergranular pores (including intergranular cavities) are mainly developed in fallout and hot clastic flow subfacies of the explosive facies. In these grain-supported volcanic breccia rocks, the intergranular pores are well developed, with a large radius, good petrophysical property, and strong accumulation capacity. Most small intergranular pores (including matrix micropores) are common in the fallout and hot base surge subfacies. Because smaller breccia grains and matrix usually provide support among breccia bodies, intergranular pores have a small radius and are poorly developed, characterized by poor petrophysical properties and a relatively weak accumulation capacity. In the XX gas field, the macro-intergranular pores have relatively high values of effective log porosity, experimental porosity, and maximum mercury intrusion, at 5.35%, 5.87%, and 69.81%, respectively. The small intergranular pores have relatively low values of effective log porosity, experimental porosity, and maximum mercury intrusion, at 3.87%, 5.29%, and 46.66%, respectively, indicating that macro-intergranular pores have a stronger accumulation capacity.
Dissolution pores with a large radius (including dissolution cavities) are formed mainly in top and upper subfacies of the effusive facies, as well as splash and fallout subfacies of the explosive facies. Because primary pores and fractures are well developed through the actions of surface water and underground water, dissolution pores tend to have good petrophysical properties and strong accumulation capacity. The matrix dissolution pores (including some dissolution pores) with a small radius are distributed mainly in the volcanic conduit facies, lower subfacies of the effusive facies, and hot clastic flow and hot base surge subfacies of the explosive facies. Because of the poorly developed primary pores and fractures, limited fluid and dissolution activity, and small radius, matrix dissolution pores tend to have relatively poor petrophysical properties low accumulation capacity. In the XX gas field, the dissolution pores in volcanic rocks have relatively high values of effective log porosity, experimental porosity, and maximum mercury intrusion, at 6.63%, 8.62%, and 75.06%, respectively. These values are lower for matrix dissolution pores, at 5.31%, 6.96%, and 65.49%, respectively. This indicates that dissolution pores with a large radius have a higher accumulation capacity.
After further comparative analysis (see Table 11.11), it can be observed that dissolution pores have the strongest accumulation capacity among the six types of pores in three categories, macrovesicles and matrix dissolution pores rank second, and the accumulation capacity of small intergranular pores is the weakest.
2) Accumulation capacity of fractures
Fracture accumulation capacity is characterized through core description and log interpretation:
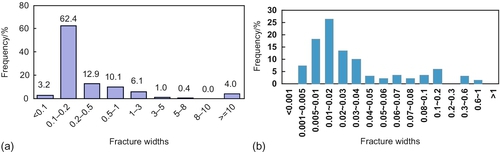
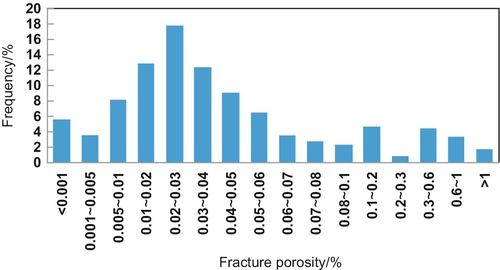
1. Core description. With cores, the fracture width and length are measured to calculate the ratio of fracture area to core surface area so as to obtain the surface porosity of fractures. In the XX gas field, fracture description for over 1400 m cores shows that (Figure 11.13) the maximum surface porosity of fractures in the volcanic gas reservoirs is 2.7%, and the surface porosity of fractures ranges from 0.02% to 0.6%, with an average of 0.28%, accounting for about 3.9% of the total reservoir porosity.
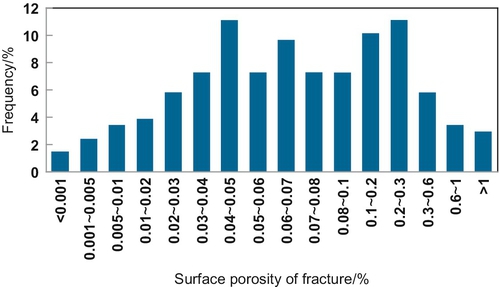
2. Log interpretation. Fracture porosity can be derived from electrical imaging log analysis and the statistical models of conventional dual laterologs (see Chapter 6 for details). In the XX volcanic gas reservoirs, log interpretations based on more than 50 wells are used to determine fracture porosity. The results (Figure 11.14) indicate that the maximum fracture porosity in volcanic gas reservoirs is 1.9%, and the fracture porosity ranges from 0.01% to 0.07%, averaging 0.06%, thereby accounting for about 0.8% of the total reservoir porosity.
From the preceding discussion, one can conclude that (1) in volcanic reservoirs, the overall accumulation capacity of fractures is limited, and the subsurface accumulation ability of fractures is lower because of their low compaction resistance; (2) the fracture accumulation capacity varies greatly because of the complex origins and highly variable types and sizes, and the fracture accumulation ability varies greatly; (3) among various types of fractures, structural fractures tend to be well developed, with a large width, and they have the strongest accumulation capacity; the accumulation capacity of dissolution fractures ranks second; the accumulation capacity of contraction fractures and blast fractures are relatively weak; most sutured fractures are closed and have no effect on the accumulation-permeation.
11.3 Characterization of throats in volcanic gas reservoirs
Throats refer to the narrow passages connecting various types of reservoir spaces, which control the permeation capacity of volcanic reservoirs. Following the throat classification scheme, throats in volcanic reservoirs are identified and the shape, size, and permeation capacity are characterized for each throat type by means of thin section examination, mercury injection analysis, and constant-rate mercury injection analysis.
11.3.1 Classification of throats in volcanic gas reservoirs
Little research has been conducted on throats in volcanic reservoirs, thus there is no commonly accepted classification scheme for throats in volcanic reservoirs so far. In this book, a classification scheme is proposed for throats in volcanic reservoirs (see Tables 11.1 and 11.12) by taking into account the peculiarity and complexity of throats, as well as their origins, shape, radius, and length. First, throats in volcanic reservoirs are divided into three basic types in terms of origin: pore-contraction throats, dissolution throats, and fractured throats. They are divided into two types in terms of shape: tubular throats and sheetlike throats. Then, in terms of radius [12], throats are divided into large throats (≥ 0.5 μm), medium throats (0.25 to 0.5 μm), small throats (0.1 to 0.25 μm), and microthroats (< 0.1 μm), and into two types in terms of length: long and short throats. Finally, the large and medium throats are grouped as the large category (≥ 0.25 μm) and the small and microthroats are grouped as small throats (< 0.25 μm) for convenience. As a result, this study recognizes eight types of throats (see Table 11.12).
Table 11.12
Classification and Characteristics of Throats in Volcanic Gas Reservoirs (XX Gas Field)
| Throat Type | Throat Characteristics | Throat Characteristics | ||||||||||||
| Genetic Classification | Shape Classification | Size Classification | Throat Permeation Ability | Typical Lithology | Typical Lithofacies | Reservoir Space | Accumulation -Permeation Pattern | Deliverability | ||||||
| Radius, μm | Length | Type | Type | Shape | Accumulation Ability | |||||||||
| Matrix throat | Pore-contraction | Tubular | ≥ 0.25 | Long | Large-long | Fairly strong | Volcanic agglomerate, volcanic breccia | Fallout subfacies of explosive facies | Intergranular cavity, macro intergranular pore | Rhombic, stripe shaped | Fairly strong | Intergranular porous | Medium, high | |
| Short | Large-short | Strong | Vesicular lava, volcanic breccia | Upper subfacies of effusive facies, fallout subfacies of explosive facies | Vesicular cavity, macro vesicle, macro intergranular pore | Elliptic, rhombic | Strong | Vesicular, intergranular porous | High | |||||
| < 0.25 | Long | Small-long | Weak | Volcanic breccia | Fallout subfacies of explosive facies | Small intergranular pore | Rhombic, stripe shaped | Medium, weak | Intergranular porous | Low | ||||
| Short | Small-short | Fairly weak | Vesicular lava, welded tuff, crystalline tuff | Lower subfacies of effusive facies, hot clastic flow subfacies of explosive facies, hot base surge subfacies of explosive facies | Small vesicle, microvesicle, matrix micropore | Nearly round, elliptic, rhombic | Fairly weak | Vesicular, intergranular porous, microporous | Medium, low | |||||
| Dissolution | Irregular | ≥ 0.25 | Long | Large-long | Fairly strong | Vesicular lava, breccia lava, volcanic breccia | Top subfacies of effusive facies, splash subfacies of explosive facies, fallout subfacies of explosive facies | Dissolution cavity, dissolution pore | Elliptic, porphyrocrystic, rhombic | Fairly strong | Vesicular | Medium, high | ||
| Short | Large-short | Strong | Vesicular lava, welded tuff, crystalline tuff | Upper subfacies of effusive facies, hot clastic flow subfacies of explosive facies, hot base surge subfacies of explosive facies | Dissolution pore, matrix dissolution pore | Rhombic, harbor shaped, disseminated | Strong | Intergranular porous | High | |||||
| Fractured throat | Structural fractures | Sheetlike space, linear in group | Normally ≥ 0.25 | Long | Large-long | Strong | Various volcanic rocks | Various lithofacies | Various pores | Various shapes | Weak-strong | Fractured-porous | Medium, high | |
| Dissolution fractures | Sheetlike space, crevasse crack or linear pattern | High | ||||||||||||
| Contraction fracture | Columnar joints | Sheetlike space, crevasse crack pattern | Medium, strong | |||||||||||
| Contraction fractures | Sheetlike space, concentric circular or crevasse crack pattern | Volcanic lava | Volcanic conduit facies | Macro vesicle, small vesicle | Nearly round, elliptic | Medium, strong | Fractured-vesicular | Medium, high | ||||||
| Blast fractures | Sheetlike space, flat-slightly curved linear pattern | Normally < 0.25 | Small-long | Fairly strong | Volcanic lava | Effusive facies | Vesicle | Elliptic, rhombic | Medium, strong | Fractured-vesicular | Medium, high | |||
| Volcanic breccia, autoclastic breccia lava | Explosive facies, volcanic conduit facies | Intergranular pore | Rhombic, stripe shaped, dendritic | Medium | Fractured-intergranular porous | Medium, low | ||||||||

1 Pore-contraction throats
Pore-contraction throats refer to the throats formed by pore contraction between vesicles or intergranular pores, and they are widespread in volcanic reservoirs. Throats between vesicles have two origins: (1) the throat is formed at the contracted part of a vesicle, and (2) the throat is developed within a vesicle or between vesicles when contraction occurs due to secondary mineral growth (e.g., quartz). For the pore-contraction throats between intergranular pores, they are formed from the accumulation and compaction of volcanic debris. Pore-contraction throats usually have a tubular shape. Most throats that originate from vesicular contraction are regular in shape, whereas those that originate from debris accumulation and compaction and crystal growth are more complicated. The radius and length of pore-contraction throats vary greatly; they can be divided into four types: large long, large short, small long, and small short (Figure 11.15).

2 Dissolution throats
Dissolution throats are formed by dissolution after primary throats and matrix mass. A dissolution throat is a major type between dissolution pores, with two origins: (1) the soluble components in a pore-contraction throat are dissolved and the original throat is restored; and (2) the soluble components in the matrix are dissolved and a new throat is generated. The dissolution throat usually follows the shape of its primary throat but may become irregularly shaped due to dissolution. The radius of dissolution throats tends to be larger than that of the original ones, and most are large throats. Therefore, dissolution throats mostly fall into the large and long type and large and short type based on their radius and length.
3 Fractured throats
Fractured throats refer to fractures that become pathways among vesicles, intergranular pores, and dissolution pores, playing the role of pore communication. Fractured throats are formed by rock contraction, gas-liquid explosion, tectonic activities, and dissolution, and they usually have a sheetlike configuration. Because a fracture has two dimension that are far greater than the third (with a ratio greater than 10), fractured throats are divided into two types according to their width and extension length: the large and long type, and the small and long type. Throats that originate from structural fractures, dissolution fractures, and large columnar joint fractures are mostly of the large-long type, whereas those that originate from contraction fractures and blast fractures are generally of the small-long type (see Table 11.12).
11.3.2 Identification of throats in volcanic gas reservoirs
The throat classification scheme is used as a basis for establishing the identification markers of various throat types (Table 11.13). By integrated use of cast thin section examination, mercury injection, and constant-rate mercury injection, the throats in volcanic reservoirs are identified level by level in combination with core observation and description. This enhances our understanding of the basic geological characteristics of throats in volcanic reservoirs and provides a basis for characterizing the shape, size, and permeation capacity of throats.
Table 11.13
Identification Markers of Throats in Volcanic Reservoirs
| Identification Markers of Throats in Reservoirs | |||||||||
| Type of Reservoir Space | Lithology | Lithofacies | Rock Structure/Texture | Pore Type | Shape | Throat Radius, μm | Throat Length | Dissolution Trace | |
| Pore- contraction | Large-long | Volcanic agglomerate, volcanic breccia | Fallout subfacies of explosive facies | Volcanic agglomerate texture, volcanic breccia texture | Intergranular cavities, macro-intergranular pores | Large-long tubular, sandglass-like outline | ≥ 0.25 | Long | N/A |
| Large-short | Vesicular lava, volcanic breccia | Upper subfacies of effusive facies, fallout subfacies of explosive facies | Rhyolitic structure, spherulitic texture, volcanic breccia texture | Vesicular cavities, macrovesicles, macro-intergranular pores | Large-short tubular, dumbbell-like outline | Short | N/A | ||
| Small-long | Vesicular lava, volcanic breccia | Upper subfacies of effusive facies, fallout subfacies of explosive facies | Rhyolitic structure, volcanic breccia texture | Macrovesicles, small intergranular pores | Small-long tubular, sandglass-like outline | < 0.25 | Long | N/A | |
| Small-short | Fine crystal lava, tight volcanic lava, welded tuff, crystal tuff | Lower subfacies of effusive facies, middle subfacies of effusive facies, hot clastic flow subfacies of explosive facies, hot base surge subfacies of explosive facies | Aplitic texture, massive structure, welded texture, tuffaceous texture | Small vesicles, microvesicles, matrix micropores | Small-short tubular, dumbbell-like outline | Short | N/A | ||
| Dissolution | Large-long | Vesicular lava, breccia lava, volcanic breccia | Top subfacies of effusive facies, splash subfacies of explosive facies, fallout subfacies of explosive facies | Rhyolitic structure, welded texture, volcanic breccia texture | Dissolution cavities, dissolution pores | Irregular tubular, sandglass-like outline, dumbbell-like outline | ≥ 0.25 | Long | Dissolution residues, dissolution dents, pitches, and embayment |
| Large-short | Vesicular lava, welded tuff, crystalline tuff | Upper subfacies of effusive facies, hot clastic flow subfacies of explosive facies, hot base surge subfacies of explosive facies | Rhyolitic structure, welded texture, tuffaceous texture | Dissolution pores, matrix dissolution pores | Irregular tubular, thorny outline | Short | |||
| Large-long | Structural fractures | Various volcanic rocks | Various lithofacies | Various structures and textures | Various pores | Sheetlike space, linear pattern | ≥ 0.25 | Long | N/A |
| Dissolution fractures | Under control of primary fracture | Available | |||||||
| Columnar joint fractures | Volcanic lava | Volcanic conduit facies | Rhyolitic structure, columnar joint | Macrovesicle, small vesicle | Crevasse crack like | N/A | |||
| Small-long | Contraction fractures | Volcanic lava | Effusive facies | Rhyolitic structure, pellet structure, felsitic texture | Vesicles | Concentric circular, crevasse crack like | < 0.25 | N/A | |
| Blast fractures | Volcanic clastic, autoclastic breccia lava | Explosive facies, volcanic conduit facies | Volcanic clastic texture, cryptobreccia texture | Intergranular pores | Flat- slightly curved linear shape | N/A | |||

1 Identification of pore-contraction throats
Pore-contraction throats, formed variously from volcanic debris accumulation and compaction, degassing of volatiles in magma, and secondary crystal growth, are the constricted part of vesicles or intergranular pores. Therefore, these types of throats have distinct shapes and sizes and are developed in specific reservoir spaces and specific lithologies and lithofacies. Pore-contraction throats can be effectively identified based on their origin, shape, and size and by taking into account the characteristics of reservoir space, lithology, lithofacies, and the structure and texture of throat-bearing rocks.
1) Characteristics of lithology, lithofacies, rock structures, and textures
Pore-contraction throats are mainly developed in volcanic lava of the effusive facies and volcanic clastic rock of the explosive facies, and various throat types are developed in different lithology, lithofacies, rock structures, and textures (see Table 11.13). Large-long throats are developed mainly in volcanic agglomerate and volcanic breccia of fallout subfacies of the explosive facies, where the rocks typically have volcanic an agglomerate texture and a volcanic breccia texture. Large-short throats are developed mainly in vesicular lava of upper subfacies of the effusive facies as well as volcanic breccia of the fallout subfacies, with common spherulitic texture, volcanic breccia texture, and rhyolitic structure. Small-long throats are most common in volcanic breccia of the fallout subfacies, with a typical volcanic breccia structure. Small-short throats are developed in aplitic lava of the lower subfacies, tight volcanic lava of the middle subfacies, welded tuff of the hot clastic flow subfacies, and crystalline tuff of the hot base surge subfacies, with a typical aplitic texture, welded texture, and tuffaceous texture, as well as a massive structure.
2) Characteristics of pore types
Pore-contraction throats occur mainly between vesicles or intergranular pores and their radiuses are associated with the pore size (see Table 11.13). Large-long throats are developed primarily between intergranular cavities or macro-intergranular pores; large-short throats are most common among vesicular cavities, macrovesicles, and macro-intergranular pores; small-long throats are found mainly between small intergranular pores; and small-short throats are found among small vesicles, microvesicles, and matrix micropores.
3) Characteristics of throat shape and size
In terms of their complex origins and variable radii and length, pore-contraction throats can be divided into four types: large long, large short, small long, and small short (Figure 11.16a and b). Large-long throats are primarily developed between intergranular pores with a large radius and are in the shape of sandglass-like tubes (Figure 11.16a). Large-short throats are most common between vesicles or intergranular pores with a large radius and are in the shape of dumbbells (Figure 11.16b). Small-long throats are found commonly between intergranular pores with a small radius and are in the shape of slender sandglasses. Small-short throats are developed between vesicles and matrix micropores with a small radius and are in the shape of minute dumbbells.
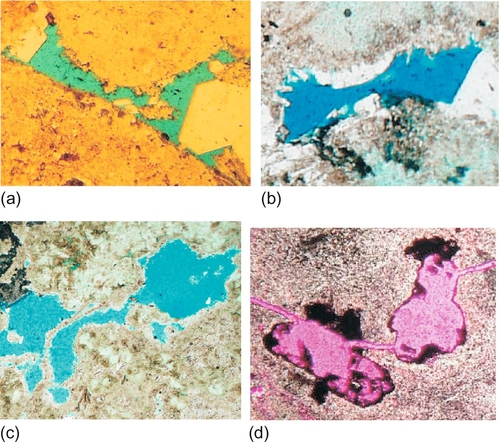
2 Identification of dissolution throats
Compared with pore-contraction throats, dissolution throats are of complex origins and variable morphology, developed in a wide range of lithologies and lithofacies. Therefore, dissolution throats can be effectively identified based on throat shape and size as well as dissolution trace markers in combination with the lithology, lithofacies, structure, and texture of the rocks in which the throats are developed.
1) Characteristics of lithology, lithofacies, rock structures, and textures
Dissolution throats are developed in the dissolution-prone part of the rock. They can be divided into a large-long type and a large-short type. The former is most commonly developed in vesicular lava of top subfacies of the effusive facies, breccia lava of splash subfacies of the explosive facies, and volcanic breccia of fallout subfacies of the explosive facies, with typical welded and volcanic breccia textures and a rhyolitic structure. Large-short throats are primarily developed in vesicular lava of upper subfacies of the effusive facies, welded tuff of hot clastic flow subfacies of the explosive facies, and crystalline tuff of hot base surge subfacies of the explosive facies and are characterized by welded and tuffaceous textures and a rhyolitic structure.
2) Characteristics of pore types
Dissolution throats are developed between dissolution pores, and their radii are related to the sizes of dissolution pores (see Table 11.13). Large-long throats are usually developed between dissolution cavities and dissolution pores with a large radius, whereas large-short ones are usually developed between dissolution pores and matrix dissolution pores with a large radius.
3) Characteristics of throat shape
Dissolution tends to enlarge the radius of the original throat by selectively dissolving the soluble components such as feldspars and volcanic ash. As a result, dissolution throats are characterized by a large throat, rough inner wall, and irregular shape (Figure 11.16c). Large-long throats usually have irregular, tubular, sandglass, or dumbbell shapes, whereas large-short throats have irregular, tubular, or thorny shapes.
4) Markers of dissolution traces
Dissolution traces such as dissolution residues (mostly secondary minerals such as kaolinite), dissolution dents, pitches, and embayments are important identification markers for dissolution throats.
3 Identification of fractured throats
Fractured throats are formed from rock contraction, cryptoexplosion, and tectonic activities, and they differ from matrix throats in that they have their own distinct origins and shapes. Therefore, fractured throats can be identified systematically based on their origins, shapes, and sizes, in combination with the characteristics of lithology, lithofacies, structure, and texture of the rocks in which fractures are developed.
1) Characteristics of lithologies, lithofacies, rock structures, and textures
Volcanic rock fractures may be developed in various lithology types, but different types of fractures correspond to different characteristics of lithologies, lithofacies, structures, and textures (see Table 11.13). The throats originating from structural or dissolution fractures occur in a variety of volcanic lithofacies. Those originating from columnar joint fractures are mainly developed in volcanic lava of the volcanic conduit facies with typical a rhyolitic structure and columnar joint. Throats originating from contraction fractures are found mostly in volcanic lava of the effusive facies, with typical spherulitic and felsitic textures and a rhyolitic structure. Those originating from blast fractures are most common in volcanic clastic rocks of the explosive facies and autoclastic breccia lava of the volcanic conduit facies, and they have volcanic clastic textures (e.g., agglomerate texture, volcanic breccia texture, and tuffaceous texture) and a cryptoexplosive breccia texture.
2) Characteristics of pore types
Throats originating from structural and dissolution fractures may be developed between various pores. Those originating from columnar joint fractures are primarily developed between macrovesicles or microvesicles. Throats originating from contraction fractures usually occur between various types of vesicles. Those formed by blast fractures are common between various types of intergranular pores.
3) Characteristics of throat shape
Most fractured throats appear as sheetlike spaces with a linear outline, so they are long-fractured types. In the three types of large-long throats, throats associated with structural fractures are sheetlike spaces with a linear outline. The shapes of throats in dissolution fractures are influenced by primary fractures, but the smooth walls become rough and the outlines change to irregular. Throats originating from columnar joint fractures are represented by crevasse cracks. In the two kinds of small-long throats, those originating from contraction fractures appear as concentric circles and crevasse cracks, whereas those in blast fractures mostly have a flat to slightly curved linear pattern.
4) Markers of dissolution traces
In all fractured throats, the typical markers of dissolution traces are present in the large-long throats of dissolution fracture origin, but these markers are absent from other fractured throats.
11.3.3 Characterization of throats in volcanic reservoirs
On the basis of classified identification, using cast thin section examination, rock porosity and permeability tests, conventional mercury injection; and constant-rate mercury injection analysis, the shapes, sizes, and permeation capacity of throats in volcanic reservoirs are characterized following the technical process that progresses from qualitative to quantitative characterization.
1 Characterization of throat shape
Because throat has a small radius, cast thin section examination is mainly used for SEM observation of the shape and distribution of various types of throats in volcanic reservoirs. This provides a basis for the characterization of microstructures in volcanic reservoirs.
1) Pore-contraction throats
These throats are the constricted parts between vesicles or intergranular pores and normally have a tubular shape. The vesicle contraction throats usually have the large-short and small-short tubular features, with a sandglass-like outline (Table 11.14b and d). Crystal growth throats are characterized by a rough inner wall and an irregular shape, usually of the small-long tubular category, with a sandglass outline. Most contracted throats in intergranular pores are of the large-long and small-long types, with a dumbbell outline (Table 11.15a and c). In the XX gas field, where volcanic lava is the major lithology in the volcanic reservoir, vesicles with a small radius are predominant in pores. Small-short throats are usually the well-developed type of pore-contraction throat, accounting for about 55%; the large-short type accounts for about 20%; the small-long type accounts for about 15%; and the large-long type accounts for about 10%.
Table 11.14
Shape Classification of Pore-Contraction Throats in Volcanic Reservoirs
| Throat Type | Origin | Shape Type | |
| Pore- contraction throat | Formed by contraction of intergranular pores or vesicles | 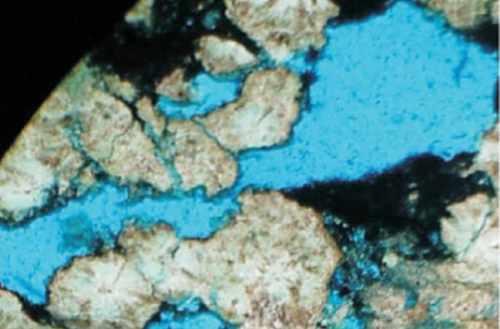 | 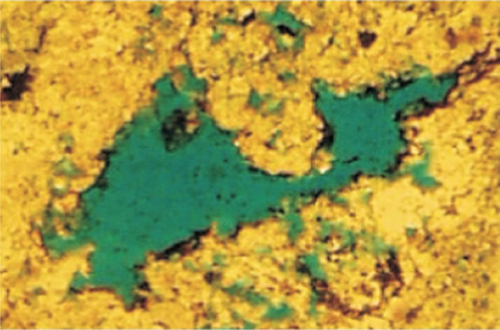 |
| (a) Large-long tubular, sandglass like (volcanic breccia). | (b) Large-short tubular and dumbbell like (rhyolite). | ||
 |  | ||
| (c) Small-long tubular, sandglass like (volcanic breccia). | (d) Small-short tubular and dumbbell like (rhyolite). | ||
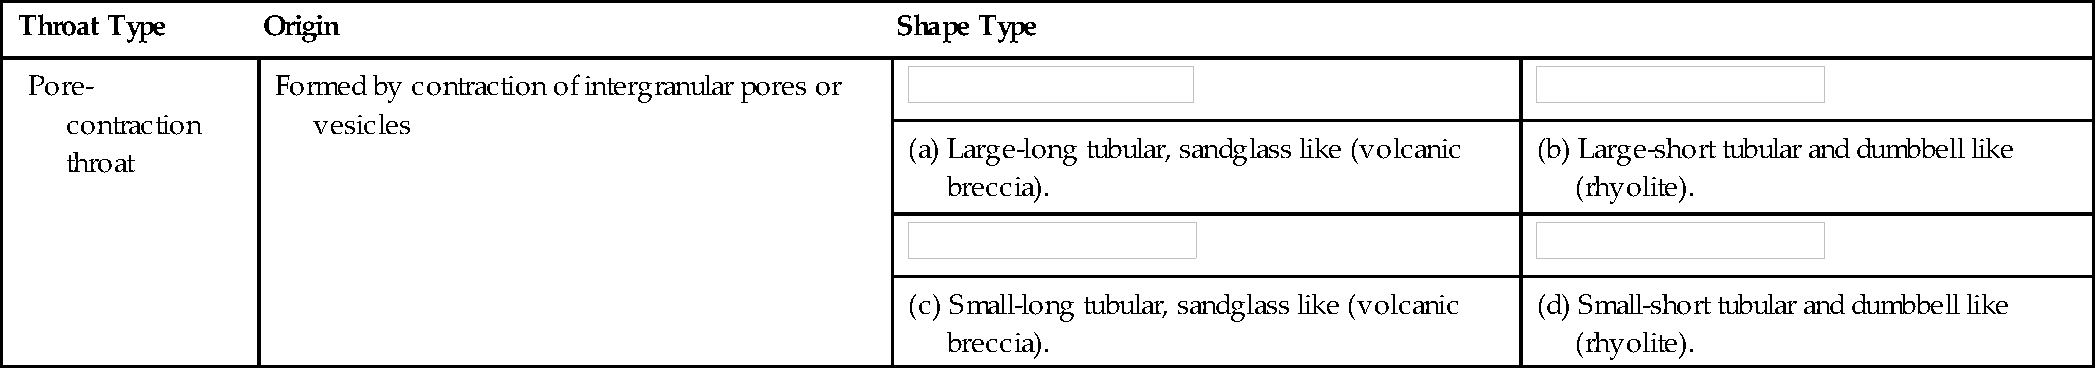
Table 11.15
Shape Classification of Dissolution Throats in Volcanic Reservoirs
| Throat Type | Origin | Shape Type (Irregular Tubular) | ||
| Dissolution throat | Through dissolution, pore-contraction throats are reformed, or the soluble components are dissolved in matrix | 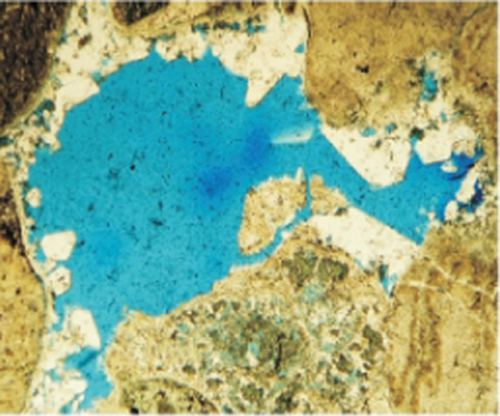 | 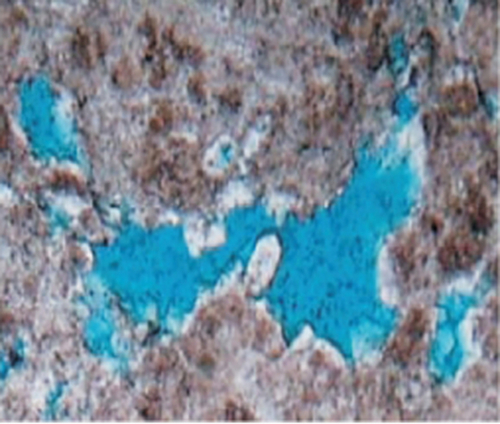 | 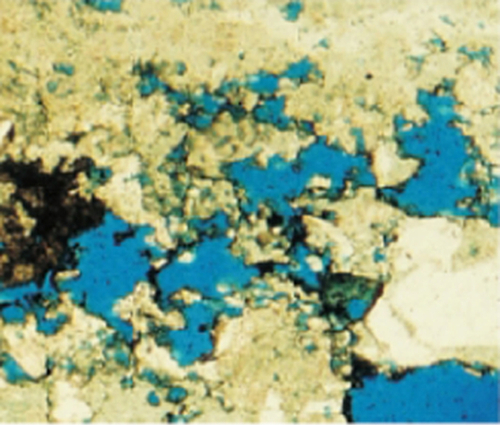 |
| (a) Large-long type, sandglass-like in outline. | (b) Large-short type, dumbbell-like in outline. | (c) Large-short type, thorny in outline. | ||
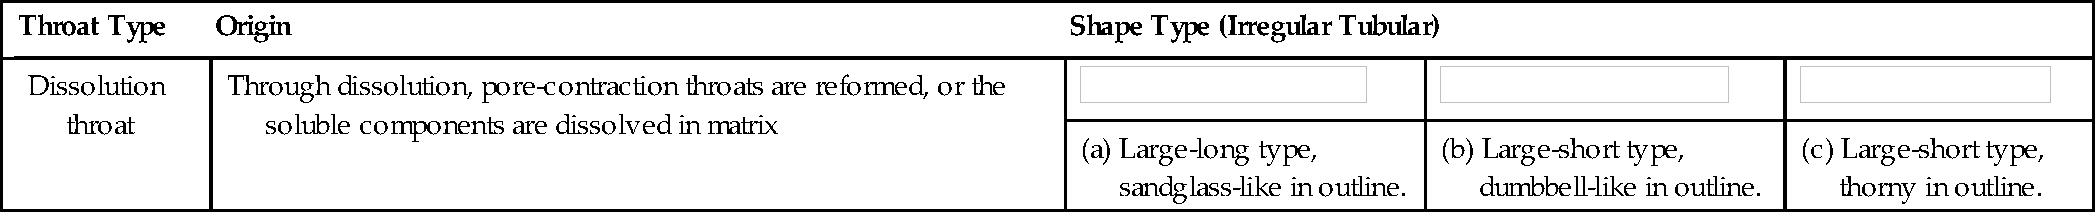
2) Dissolution throats
These throats are formed by dissolution that reshapes the pore-contraction throats or by dissolution of the soluble components in a matrix. Due to selective dissolution of feldspar and volcanic ash, most dissolution throats have an irregular tubular shape, but completion dissolution of phenocrysts may result in regular-shaped throats. In the two types of dissolution throats, the large-long type is sandglass shaped or dumbbell-like in outline, whereas the large-short type tends to have a thornlike outline. In the XX gas field, vesicles with a small radius, intergranular pores, and matrix micropores are predominant in the volcanic reservoir and the dissolution is relatively weak; as a result, the large-short dissolution throats are dominant, accounting for about 70%, whereas the large-long type accounts for 30%.
3) Fractured throats
These are largely sheetlike throats. In the large-long type formed by large fractures, throats originating from structural fractures have a large size and a linear pattern in plan view and may be developed in various types of pores (Table 11.16a). Those associated with dissolution fractures have larger sizes than those of precursory fractures, as their shape is generally controlled by the precursory fractures, but the inner wall tends to become rough with an irregular the outline, and they may occur in various types of pores. The throats originating from columnar joint fractures are large in size, manifesting as crevasse cracks in the cross section and a linear pattern in the longitudinal section, and they develop mainly between macrovesicles or small vesicles in volcanic lava of the volcanic conduit facies. In the small-long throats originating from small fractures, those originating from contraction fractures are characterized by concentric rings and crevasse cracks, and they develop between various types of vesicles in volcanic lava of the effusive facies (Table 11.16b); those originating from blast fractures have the smallest size, usually showing a flat to slightly curved linear pattern, and they are found commonly between various types of intergranular pores in volcanic clastic rocks of the explosive facies and autoclastic breccia lava of the volcanic conduit facies (Table 11.16c).
Table 11.16
Shape Classification of Fractured Throats in Volcanic Reservoirs
| Throat Type | Origin | Shape Type (Sheetlike Space) | ||
| Fractured throat | Fracture plays a role in pore communication and results in fractured throats |  | 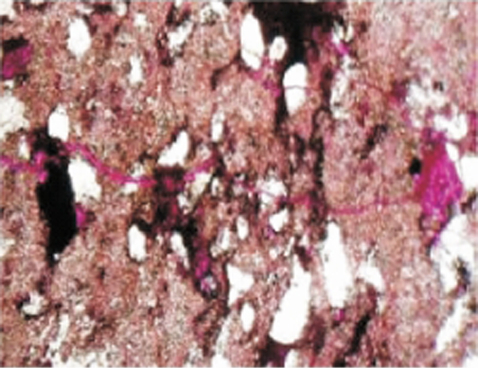 |  |
| (a) Large-long type (structural fracture), linear pattern. | (b) Small-long type (contraction fracture), linear pattern. | (c) Small-long type, as crevasse cracks. | ||

2 Characterization of throat size in reservoirs
Throat size determines the fluid flow capacity of a reservoir. In terms of throat features in volcanic reservoirs, the size characteristics of various types of throats can be clarified by integrating core observation, cast thin section examination, capillary pressure curve analysis, constant-rate mercury injection analysis, and log interpretation. This provides a basis for characterizing the accumulation-permeation capacity of throats.
1) Core observation and cast thin section examination
Core observation is an effective method for examining large-sized pores and throats. Because of their generally small size, matrix throats are difficult to observe visually, so core observation is used mainly to determine the size and distribution characteristics of fractures. In the XX gas field, the width of open fractures connecting pores can reach a maximum of 6000 μm, but it mainly ranges from 60 to 600 μm with an average of 300 μm. Therefore, the largest radius of a fractured throat (large-long type) is 3000 μm, primarily ranging from 30 to 300 μm with an average of 150 μm, all of which are macrothroats (> 0.5 μm).
SEM examination of cast thin sections is important for studying the evolution of pores and fractures in reservoirs and for evaluating the types and characteristics of pores, throats, and fractures. Through SEM observation and measurement, pore-contraction throats, dissolution throats, and fractured throats can be effectively distinguished in cast thin sections, and the radii of larger throats can be determined semiquantitatively. In the XX gas field, more than 50 pieces of cast thin sections of volcanic rocks were examined and analyzed semiquantitatively to achieve a preliminary understanding of the characteristics of throat size in the volcanic reservoir: (1) the throat radius in reservoir matrix (including pore-contraction throats and dissolution throats) is normally 0.1 to 6 μm; (2) the radius of fractured throat (0.5 to 15 μm) is much larger than that of matrix throat.
2) Mercury injection
Mercury injection experiments measure the mercury volumes injected into a core plug under different pressures; the capillary pressure curves are derived and then the throat size and pore volume controlled by the throats are calculated using the J function [13]. Through processing and statistical analysis of a large number of capillary pressure curves, the size and distribution characteristics of various types of throats in a volcanic reservoir matrix can be assessed.
In the XX gas field, capillary pressure curves were analyzed with conventional mercury injection information derived from 206 pieces of volcanic rock core samples, and the radius distributions of various types of matrix throat were obtained (Table 11.17). The largest matrix throat radius is 0.64 μm and the radii range from 0.005 to 0.4 μm with an average of 0.07 μm (Figure 11.17a). In terms of size, microthroats are dominant (accounting for about 76.6%), small throats rank second (accounting for about 18%), and medium throats and large throats are poorly developed (accounting for about 4.9% and 0.5%, respectively) (Figure 11.17b). In matrix throats, the pore-contraction throats have the largest radius at 0.38 μm, with the radius values ranging from 0.008 to 0.2 μm and averaging 0.06 μm; in terms of size, microthroats are dominant (accounting for about 83.9%), small throats account for about 13.4%, medium throats account for only about 2.7%, and large throats are not developed (Figure 11.17c). The dissolution throats have a maximum radius of 0.64 μm, with the radii ranging from 0.01 to 0.4 μm and averaging 0.11 μm; in terms of size, microthroats are dominant (accounting for about 57.9%), small throats account for about 29.8%, medium throats account for only about 10.5%, and large throats are poorly developed (accounting for about 1.8%) (Figure 11.17d).
Table 11.17
Statistics on Throat Sizes in Volcanic Gas Reservoirs (XX Gas Field)
| Characterization Method | Matrix Throat Radius, μm | Pore-Contraction Throat Radius, μm | Dissolution Throat Radius, μm | Fractured Throat Radius, μm | ||||||||
| Max | Range | Min | Max | Range | Min | Max | Range | Min | Max | Range | Min | |
| Core observation | 3000 | 30-300 | 150 | |||||||||
| Mercury injection | 0.64 | 0.008-0.4 | 0.07 | 0.38 | 0.008-0.2 | 0.06 | 0.64 | 0.01-0.4 | 0.11 | |||
| Constant-rate mercury injection | 5.4 | 0.16-1.2 | 0.6 | |||||||||
| Log interpretation | 750 | 2.5-25 | 14 | |||||||||

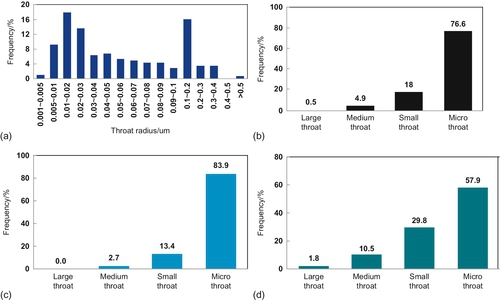
3) Constant-rate mercury injection
In this method, mercury is injected into rock pores in a process of quasi-static state. Pore and throat are identified by the pressure drop that occurs when mercury breaks through the throat, and the characteristic parameters of microscopic porous structure in rocks, such as distributions of pore radius and throat radius controlled by large throats (≥ 0.1 μm), can be derived. In the XX gas field, 24 pieces of volcanic rock sample were analyzed in the constant-rate mercury injection experiments. The results (Figure 11.18 and Table 11.17) indicate that the maximum radius of a matrix throat in the volcanic reservoir is 5.4 μm, with the radius values distributed from 0.16 to 1.2 μm and averaging 0.6 μm; medium throats are dominant, accounting for about 41.7%; small throats rank second, accounting for about 33.3%; and very few large throats are developed (about 25%). Because mercury injection is a quasi-static process, micropores cannot be detected.
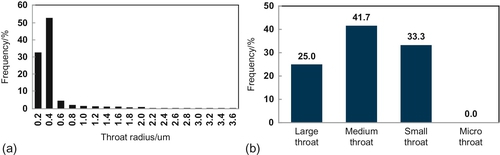
4) Log interpretation
In this method, fracture width is calculated by means of FMI imaging logs and conventional dual laterologs, and the radius range of fractured throats is also obtained. The results (see Table 11.17) of log interpretation for the XX gas field reveal that the maximum radius of a fractured throat in the volcanic reservoir is 750 μm, with a range of 2.5 to 25 μm and an average of 14 μm, all falling under the category of large throats.
The preceding discussion suggests that (1) the throat radius in volcanic gas reservoirs has a wide range of values, including various throats developed from macro- to microscales; (2) the radius of a matrix throat is small, and microthroats and small throats are the dominant types of matrix throats; the radius of a dissolution throat is usually larger than that of a pore-contraction throat; and (3) the radius of a fractured throat is considerably larger than that of a matrix throat, and fractures play an important role for the permeability in volcanic reservoirs.
3 Characterization of reservoir permeation capacity
Permeation capacity is an important indicator for evaluating the sizes of various types of throats and their fluid flow properties. Permeability and displacement pressure are two parameters normally used to characterize the permeation capacity of throats in volcanic reservoirs.
1) Permeation capacity of matrix throats
By integrated use of core porosity and permeability tests, mercury injection experiments, and log interpretations, the overall permeation capacity of matrix throats and various individual types of matrix throats in volcanic reservoirs are characterized.
Overall permeation capacity of reservoir matrix
In volcanic reservoirs, matrix throats have complex origins and highly variable shapes and radius sizes, resulting in significant variations in their permeation capacities. In the XX gas field (Figure 11.19 and Table 11.18), the volcanic rock cores have a maximum permeability of 17.3 mD, ranging from 0.02 to 0.2 mD with an average of 0.14 mD. The matrix permeability derived from logging interpretation has a maximum of 3.2 mD, with a range of 0.01 to 0.15 mD and an average 0.07 mD. The displacement pressure derived from mercury injection experiments has a wide distribution, with an average of 9.77 MPa. It is thus confirmed that the matrix permeation capacity in the volcanic reservoir is relatively weak and varies significantly.

Table 11.18
Statistics on the Permeation Capacity of Various Types of Throats in Volcanic Gas Reservoirs (XX Gas Field)
| Throat Type | Typical Rock | Matrix Permeability Derived from Logging, mD | Experimental Matrix Permeability, mD | Expulsion Pressure, MPa |
| Pore-contraction throat | Rhyolitic volcanic breccia | 0.05 | 0.08 | 10.57 |
| Dissolution throat | Rhyolitic breccia lava | 0.16 | 0.28 | 8.06 |
| Matrix throat | All volcanic rocks | 0.07 | 0.15 | 9.77 |

Permeation capacity of various types of throats by origin
The two types of matrix throat—that is, the pore-contraction throats and dissolution throats—have different origins, shapes, and sizes, leading to different permeation capacities (see Table 11.18). For pore-contraction throats, the matrix permeabilities derived from logs and experiments are 0.05 mD and 0.08 mD, respectively, and the displacement pressure is 10.57 MPa; whereas these values for dissolution throats are 0.08 mD, 0.28 mD, and 8.06 MPa, respectively. This suggests a relatively good permeation capacity for dissolution throats.
Permeation capacity of various types of throats by size
Throats of different sizes and lengths have different permeation capacities. In general, a larger throat size corresponds to a stronger permeation capacity. In the pore-contraction throat example (Table 11.19) from the XX gas field, the matrix permeability of large-short throats is the highest (average 0.124 mD) and their displacement pressure is the lowest (average 9.16 MPa), indicating the strongest permeation capacity. The matrix permeability of large-long throats is fairly high (average 0.108 mD) and their displacement pressure is fairly low (average 9.86 MPa), showing a relatively good permeation capacity. The matrix permeability of small-long throats is fairly low (average 0.048 mD) and their displacement pressure is high (average 12.31 MPa), showing a weak permeation capacity. Finally, the matrix permeability of small-short throats is the lowest (average 0.032 mD) and their displacement pressure the highest (average 16.17 MPa), representing the weakest permeation capacity.
Table 11.19
Statistics on the Permeation Ability of Various Types of Throats in the Volcanic Reservoirs of XX Gas Field (in Terms of Subfacies)
| Throat Type | Typical Subfacies | Matrix Permeability, mD | Displacement Pressure, MPa | |
| Pore-contraction throat | Large-short | Upper subfacies of effusive facies | 0.124 | 9.16 |
| Large-long | Fallout subfacies of explosive facies | 0.108 | 9.86 | |
| Small-long | Fallout subfacies of explosive facies | 0.048 | 12.31 | |
| Small-short | Lower subfacies of effusive facies Hot base surge subfacies of explosive facies | 0.032 | 16.17 | |

2) Permeation capacity of fractured throats
In light of the fracture complexity of volcanic rocks, the permeation ability of fractured throats is characterized using core description and log interpretation, with two parameters: radius of fractured throat and fracture permeability:
1. Radius of fractured throat. As Table 11.17 shows, the radius of visually identifiable fractured throats ranges from 30 to 300 μm and averages 150 μm, more than 2000 times that of matrix throats; and the radius of fractured throats derived from log interpretation ranges from 2.5 to 25 μm and averages 14 μm, being 20 to 200 times that of matrix throats. In general, therefore, the radius of a fractured throat is far larger than that of a matrix throat.
2. Fracture permeability. Herein, it refers specifically to the permeability of fractured reservoirs. In the XX gas field, the total permeability of the volcanic reservoir falls ranges from 0.02 to 59.65 mD with an average of 2.18 mD; the matrix permeability ranges from 0.02 to 5.09 mD with an average of 0.07 mD; and the maximum fracture permeability is 59.46 mD with an average of 2.11 mD. In general, fracture permeability is 30 times that of the matrix permeability, constituting up to 97% of the total permeability of this reservoir. Therefore, fracture is a crucial factor for the enhancement of permeation capacity and therefore the production in volcanic gas reservoirs.
There are many types of fractures in volcanic reservoirs, with different fracture types having different origins and fracture sizes, and the throats that originate from different fracture types having various permeation capacities. In general, structural fractures are wide and extensive, so that the throats originating from structural fractures have a strong permeation capacity. Dissolution fractures enlarge the width of their precursory fractures and enhance the fluid flow capacity; therefore, the throats associated with dissolution fractures also tend to have a strong permeation capacity. Columnar joint fractures near volcanic conduits are fairly wide and extend far; consequently, the throats derived from columnar joint fractures have a strong permeation capacity. In contrast, contraction and blast fractures tend to have a small width, short extension, and poor pore connections, so their permeation capacity is relatively weak; sutured fractures are basically closed and are irrelevant in terms of permeation.
11.4 Characterization of Accumulation-Permeation patterns in volcanic reservoirs
In this study, accumulation-permeation (hereafter abbreviated as A-P) pattern refers to the dynamic combination mode of reservoir spaces and throats. The types and characteristics of A-P patterns determine the accumulation-permeation capacity of volcanic reservoirs and directly influence their deliverability and stable production rate. By taking into account the geological features of volcanic gas reservoirs, the A-P patterns are classified, and the lithology, lithofacies, pore-throat-fracture assemblage, accumulation ability, permeation ability, and deliverability characteristics of different A-P patterns are clarified on the basis of reservoir space and throat characterization. This provides a basis for assessing the control of A-P patterns on gas reservoir deliverability.
11.4.1 Classification of accumulation-permeation patterns in volcanic gas reservoirs
Attempts have been made to study accumulation-permeation (A-P) patterns in metamorphic and carbonate reservoirs. For example, Bai and colleagues [14] proposed four types of A-P patterns on the basis of their work on the A-P patterns of buried-hill oil reservoirs in the Bohai Gulf, and they determined that various A-P patterns exhibit different production characteristics. Chen and coworkers [15] recognized six A-P patterns for fractured porous oil reservoirs in their study on the Lower Ordovician fractured porous carbonate oil reservoir in the Tahe oil field of the Tarim basin, and they concluded that the recovery characteristics of such oil-producing reservoirs were closely related to the A-P patterns of the accumulation body encountered by drilling. Considering the complex origins of highly variable reservoir spaces and throats in volcanic gas reservoirs, this study recognizes eight types of A-P patterns in two categories (Table 11.20) in the XX volcanic gas reservoir in terms of the dynamic assemblage of various reservoir spaces and throats, based on the characterization of reservoir spaces and throats, with reference to the previous research results, and taking into account the formation and evolution of reservoir spaces and throats in volcanic gas reservoirs.
Table 11.20
Major Accumulation-Permeation (A-P) Patterns and Characteristics of Deep Volcanic Reservoirs in the Songliao Basin
| Classification of A-P Patterns | Characteristics of A-P Pattern | Characteristics of A-P Pattern | A-P Pattern | Typical Schematic A-P Pattern | ||||||||
| No. | Pattern Type | Pore Type | Throat Type | Lithology | Lithofacies | Fracture Features | Accumulation Ability | Permeation Ability | Deliverability Character | Representative Blocks | ||
| 1 | Single pattern | Vesicular | Vesicles | Pore-contraction (large-short, small-short) | Vesicular lava | Top subfacies of effusive facies, upper subfacies of effusive facies | Poorly developed | High | Moderate | Natural deliverability, postfracturing high production | XX2-1 | 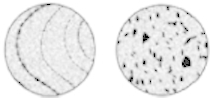 |
| 2 | Intergranular porous | Intergranular pores | Pore-contraction (large-short, small-short, large-long, small-long) | Volcanic breccia, welded breccia | Fallout subfacies of explosive facies, hot clastic flow subfacies of explosive facies | Poorly developed | Moderate | Moderate–low | Postfracturing moderate–low production | XX1 | 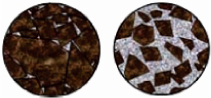 | |
| 3 | Microporous | Matrix micropores | Pore-contraction (small-short) | Crystal tuff, welded tuff | Hot clastic flow subfacies of explosive facies, hot base surge subfacies of explosive facies | Poorly developed | Moderate–low | Low | Postfracturing low production | XX1 |  | |
| 4 | Fractured | Sporadic vesicles | Fractured | Tight volcanic rock | Lower subfacies of effusive facies, middle subfacies of effusive facies, hot base surge subfacies of explosive facies | Structural fractures, contraction fractures | Low | High | Dry zone | XX9 and XX231 |  | |
| 5 | Combined pattern | Fractured - vesicular | Vesicles | Pore-contraction (large-short, small-short), fractured | Vesicular lava, breccia lava | Top subfacies of effusive facies, upper subfacies of effusive facies, splash subfacies of explosive facies | Structural fractures, contraction fractures | High | Moderate–high | Natural high production–postfracturing moderate production | XX8, XX9, CC1 and XX21 | 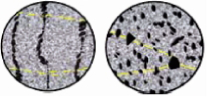 |
| 6 | Fractured –intergranular porous | Intergranular pores | Pore-contraction (large-short, small-short, large-long, small-long), fractured | Volcanic breccia, welded breccia | Fallout subfacies of explosive facies, hot clastic flow subfacies of explosive facies | Structural fractures | Moderate | Moderate–high | Postfracturing high–moderate production | XX1 and XX21 | 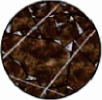 | |
| 7 | Fractured - microporous | Micropores | Pore-contraction (small-short), fractured | Welded tuff, crystalline tuff | Hot clastic flow subfacies of explosive facies, hot base surge subfacies of explosive facies | Structural fractures, blast fractures | Moderate–low | Moderate | Postfracturing high–moderate production | XX1 |  | |
| 8 | Fractured-dissolution-porous | Primary pores and dissolution pores | Dissolution, fractured | Various volcanic rock | Various lithofacies | Structural fractures, contraction fractures, blast fractures | Varied greatly | Moderate–high | Postfracturing high–moderate production | XX8, CC1 and XX28 |  | |

1 Single accumulation-permeation (A-P) pattern
A single A-P pattern denotes that the reservoir spaces are simple and that throats and reservoir spaces are related in origin. In light of the genetic classification and assemblage relationship of reservoir spaces and throats, the single pattern in volcanic gas reservoirs includes four types: vesicular, intergranular porous, microporous, and fractured. Because of the differences in pore types, throat types, and characteristics of lithology and lithofacies, different types of A-P patterns have different accumulation-permeation capacities, resulting in distinct dynamic characteristics of deliverability and stable production capability in volcanic reservoirs (see Table 11.20):
1. Vesicular A-P pattern. This pattern is mainly developed in vesicular lava of top and upper subfacies of the effusive facies; vesicles with a large radius are the predominant reservoir space, characterized by a bead-string-like distribution; most throats are of the large-short type formed from vesicle contraction, and the small-short type ranks second. Fractures are poorly developed. Hence, this pattern provides a high accumulation capacity and moderate permeation capacity.
2. Intergranular porous A-P pattern. This pattern is mainly formed in volcanic breccia of fallout subfacies of explosive facies and welded breccia of hot clastic flow subfacies of explosive facies. Intergranular pores with a large radius are predominant in reservoir spaces and most throats originate from intergranular pore contraction, and large and long, large and short, small and long, and small and short throats are all developed; fractures are poorly developed. Therefore, this pattern has features of moderate accumulation ability and moderate or poor permeation ability.
3. Microporous A-P pattern. This pattern occurs primarily in welded tuff of hot clastic flow subfacies of the explosive facies and crystal tuff of hot base surge subfacies of the explosive facies. The reservoir space is dominated by matrix micropores with a small radius. The small-short types of throats that originated from matrix micropore contraction are predominant; fractures are poorly developed. Thus, this pattern usually has relatively poor accumulation and permeation capacities.
4. Fractured A-P pattern. This pattern is found mainly in tight volcanic rocks of lower and middle subfacies of the effusive facies as well as hot base surge subfacies of the explosive facies. Structural and contraction fractures are predominant, making up the major reservoir spaces and seepage pathways. Most of the matrix pores are scattered small vesicles, microvesicles, and matrix micropores. Fractured throats are predominant, including the large-long throat type formed from large fractures as well as the small-long throat type that originates from small fractures. Therefore, this pattern is characterized by poor accumulation capacity but good permeation capacity.
2 Combined A-P pattern
In a combined A-P pattern, various pores act as reservoir spaces and matrix throats, and fractured throats act as seepage pathways. Because the permeation capacity of fractured throats is much higher than that of matrix throats, the matrix throats in combined pattern have a smaller contribution to the permeation capacity of reservoirs. In light of the genetic types of reservoir spaces, the combined A-P patterns fall into four types: fractured-vesicular, fractured–intergranular porous, fractured-microporous, and fractured–dissolution-porous. In different types of combined A-P patterns, there are differences in pore types, fracture types, lithology, and lithofacies, and consequently there are differences in accumulation capacity, permeation capacity, and reservoir deliverability (see Table 11.20):
1. Fractured-vesicular A-P pattern. This A-P pattern is developed mainly in vesicular lava of the top and upper subfacies of the effusive facies. The reservoir space is dominated by vesicles with a large radius, featuring a bead-string-like distribution. Most of the throats are of the vesicle contraction and fractured types. Vesicle contraction throats include the large-short and small-short categories, whereas fractured throats include the large-long and small-long categories. Most fractures are well developed and are of the structural and contraction types. Hence, the fractured-vesicular A-P pattern has good accumulation and permeation capacities.
2. Fractured–intergranular porous A-P pattern. This A-P pattern is mainly formed in volcanic breccia of fallout subfacies of the explosive facies and welded breccia of hot clastic flow subfacies of the explosive facies. Most of the reservoir spaces are intergranular pores with a large radius. Intergranular pore-contraction throats and fractured throats are dominant, with large-long, large-short, small-long, and small-short types of throats developed. Structural fractures are predominant and well developed. The fractured–intergranular porous A-P pattern, therefore, has a moderate accumulation capacity and a fairly good permeation capacity.
3. Fractured-microporous A-P pattern. This A-P pattern is found primarily in welded tuff of hot clastic flow subfacies of the explosive facies and crystalline tuff of hot base surge subfacies of the explosive facies. Most of the reservoir spaces are matrix micropores with a small radius. Pore-contraction throats and fractured throats are predominant, usually including the large-long, small-long, and small-short types. Structural and blast fractures are common and well developed. As a result, this A-P pattern usually has a moderate-low accumulation capacity and a moderate permeation capacity.
4. Fractured–dissolution-porous A-P pattern. This A-P pattern occurs mainly in volcanic rocks of various lithofacies. The reservoir spaces are primarily composed of dissolution pores of variable radii, including dissolution cavities, dissolution pores, and matrix dissolution pores. Dissolution and fractured throats are predominant. Structural contraction and blast fractures are well developed. Therefore, this pattern has a moderate-strong accumulation capacity and a good permeation capacity.
11.4.2 Characterization of accumulation-permeation (A-P) patterns in volcanic gas reservoirs
The accumulation capacity of various A-P patterns is characterized in terms of porosity, probe radius, and other parameters; the permeation capacity is characterized by permeability; the deliverability is characterized by production and open flow potential; and the stable production capability of various A-P patterns is characterized by gas production per pressure drop and stable production duration. The control of A-P patterns on deliverability and the stable production capability of gas-producing reservoirs is assessed on the basis of classification; systematic analyses of static and dynamic data derived from cores, thin sections, logs, gas tests, pilot production tests, and practical productions; and by comparing the accumulation capacity, permeation capacity, and deliverability characteristics of various A-P patterns (Table 11.21). This will provide guidance for developing technical procedures regarding volcanic gas reservoirs.
Table 11.21
Characteristics of Volcanic Reservoirs with Different Accumulation-Permeation (A-P) Patterns
| Classification of A-P Pattern | Typical Well/Horizon | Accumulation Capacity | Permeation Capacity | Deliverability Characteristics | Stable Production Potential | |||||||||
| Well and Horizon No. | Lithology | Lithofacies | Reservoir Space | Fracture and Development | Effective Porosity, % | Radius of Investigation, m | Total Permeability, mD | Gas-Testing Production, 104 m3/d | Production Test Yield, 104 m3/d | Open Flow Potential, 104 m3/d | Gas Production per Pressure Drawdown, 104 m3/MPa | Estimated Period of Stable Production, Years | ||
| Single pattern | Vesicular | Horizon No. 93 in Well XSS2-1 | Vesicular rhyolite | Upper subfacies of effusive facies | Macrovesicles | Poor | 13.2 | 65 m (inner), infinite (outer) | 0.74 | 15.1 (natural) | 12.15 | 40.93 | 7839 | 10 |
| Intergranular porous | Horizons No. 166 and 170I in Well XX3 | Welded breccia | Hot clastic flow subfacies of explosive facies | Small intergranular pores | Poor | 5.51 | 67.6 m | 0.12 | 0.08 (natural), 5.27 (fracturing) | — | 7.49 | — | — | |
| Microporous | Horizon No. 129 in Well XX1-4 | Crystal tuff | Hot base surge subfacies of explosive facies | Matrix micropores | Poor | 4.87 | 213.5 m | 0.08 | 0.26 (natural), 12.86 (fracturing) | 6.4 | 19.49 | — | 3 | |
| Fractured | Horizon No. 224 in Well XX21 | Tight rhyolite | Middle subfacies of effusive facies | Microvesicles | Structural fracture, contraction fracture, blast fracture | 1.44 | 426 m | 8.09 | Horizon No. 223: 3.0 (natural), 40.76 (fracturing) | 12.02 | 55.18 | 448.7 | 4 | |
| Combined pattern | Fractured -vesicular | Horizons No. 59II and 60 IV in Well XX9 | Vesicular rhyolite | Upper subfacies of effusive facies | Small vesicles | Structural fracture, contraction fracture | 6.3 | 19.8 (boundary 10,27 (boundary 2) | 1.19 | 0.05 (60 IV natural), 0.03 (59 II natural), 20.9 (commingled, fracturing) | 5.24 | 23.16 | 86.3 | 4 |
| Fractured -intergranular porous | Horizon No. 150 in Well XX1 | Volcanic breccia | Fallout subfacies of explosive facies | Intergranular pores | Structural fracture, blast fracture | 8.6 | 205 m (inner), infinite (outer) | 3.71 | 53 (fracturing) | 14.07 | 118 | 2630.4 | 7 | |
| Fractured-microporous | Horizon No.141-I in Well XX8-107 | Crystalline tuff | Hot base surge subfacies of explosive facies | Matrix micropores | Poorly | 6.31 | 53 m | 0.42 | 0.17 (natural), 9.7 (fracturing) | 7.6 | 11.24 | — | — | |
| Fractured –dissolution-porous | Horizon No. 74XI in Well XX8 | Breccia lava | Volcanic neck subfacies of volcanic conduit facies | Dissolution pores | Structural fracture, dissolution fracture | 16.7 | 330 m | 25.2 | 22.6 (natural) | 10.11 | 43.81 | 1792.8 | 6 | |
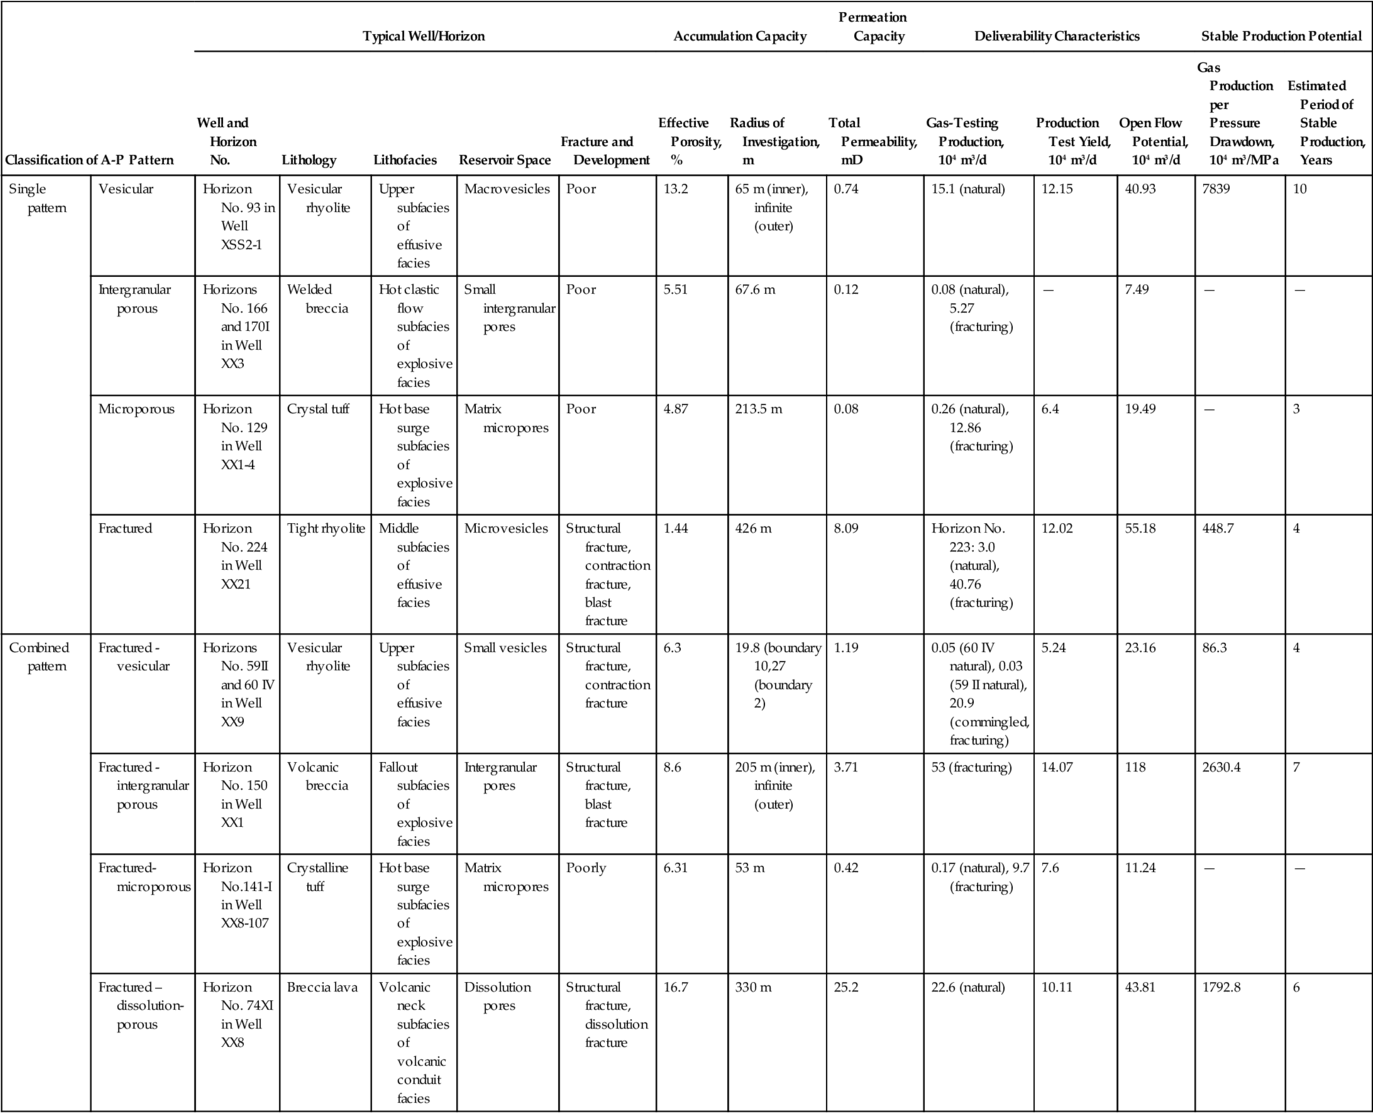
1 Vesicular A-P pattern
A vesicular A-P pattern is developed mainly in volcanic lava of the effusive facies. Its accumulation capacity is primarily affected by vesicle size and the degrees of vesicle development, as well as reservoir extension, whereas the permeation capacity is influenced by the radius of vesicle contraction throats and pore-throat configuration. From the middle-lower subfacies to the upper-top subfacies of the effusive facies, the radii of vesicles and throats increase because of the increased degassing of volatile constituents, with better developed and better communicated vesicles, resulting in improved accumulation-permeation capacity, deliverability, and stable production capability for the reservoirs.
Horizon No. 93 in Well XSS2-1 has a typical vesicular A-P pattern, characterized by vesicular rhyolite of the upper subfacies of the effusive facies. Its reservoir space is dominated by macrovesicles with a bead-string-like distribution. Most of the throats are of the large-short type that originated from vesicle contraction, exhibiting good communication between pores. Fracture is not observed in cores (Figure 11.20a). In this horizon, the effective porosity is 13.2%, the average permeability is 0.74 mD, and the probe radius for the inner zone is 65 m from well test interpretation with an infinite outer zone, indicating a good accumulation capacity but a moderate permeation capacity. During gas testing, the natural deliverability was 15.1 × 10⁴ m3/d, with a pilot production yield of 12.15 × 10⁴ m3/d and open flow potential of 40.93 × 10⁴ m3/d. After stream injection, a stable production of 9 to 15.7 × 10⁴ m3/d is maintained, with a slow pressure decline and a gas production per pressure drop at 7839 × 104 m3/MPa. So far, the cumulative gas production has been 0.6 × 10⁸ m3, and the stable production duration is estimated to be 10 years (Figure 11.20b and Table 11.21). Therefore, these rocks of the upper and top subfacies with a vesicular A-P pattern have good accumulation-permeation capacities, high production levels, and a strong potential for stable production.

2 Intergranular porous A-P pattern
This A-P pattern occurs primarily in large-grained volcanic clastic rocks of the explosive facies. Its accumulation-permeation ability is affected by many factors, such as the clastic grain size, sorting, accumulation, and compaction. Large and well-sorted grains, strong grain support, and weaker compaction usually correspond to large, well-developed, and well-connected intergranular pores and, consequently, a strong accumulation-permeation capacity. Due to weak resistance against compaction, matrix filling usually occurs within the intergranular pores. Under deep burial conditions, therefore, the intergranular porous A-P pattern tends to have poor accumulation-permeation capacities, deliverability, and stable production potential.
In Well XX3, horizons No. 165, 166, and 170-I have a typical intergranular porous A-P pattern, hosted in welded tuff of the hot clastic flow subfacies. The reservoir space is predominantly composed of intergranular pores with a small radius. Most of the throats belong to the small-long category and originated from contraction of intergranular pores. Fractures are not developed, resulting in poor communication between pores (Figure 11.21a). In this reservoir interval, the average effective porosity is 5.51%, average permeability is 0.12 mD, and the probe radius is 67.6 m, indicating a poor accumulation and permeation capacity. Gas testing in the interval produced the following results: natural deliverability 0.08 × 10⁴ m3/d, deliverability up to 5.27 × 10⁴ m3/d after fracturing, and open flow potential 7.49 × 10⁴ m3/d (see Table 11.21). The discharge curve in production tests (Figure 11.21b) shows that this reservoir interval has a certain level of capacity for stable production, at a low yield of 2 to 3 × 10⁴ m3/d.

3 Microporous A-P pattern
A microporous A-P pattern occurs mainly in welded tuff of the hot clastic flow subfacies and crystalline tuff of the hot base surge subfacies. The reservoir space is dominated by matrix micropores and their associated small-short throats, resulting in poor accumulation and permeation capacities. Generally speaking, the volcanic reservoir with this A-P pattern has no natural deliverability, although a medium-low yield and relatively weak stable production can be achieved by fracturing.
Horizon No. 129 in Well XX1-4 has this type of A-P pattern, found in rhyolitic breccia and crystalline tuff of the hot base surge subfacies. The reservoir space is dominated by matrix micropores, connected by small-short throats that originated from the contraction of matrix micropores, without fractures (Figure11.22a). In this horizon, the average effective porosity is 4.87%, the average permeability is 0.08 mD, and the probe radius is 213.5 m, showing a moderate accumulation capacity but poor permeation capacity. After gas testing, natural production reached 0.28 × 10⁴ m3/d, and postfracturing production rose to 12.64 × 10⁴ m3/d; the yield during production testing was 6.4 × 10⁴ m3/d, and open flow potential was 19.49 × 10⁴ m3/d. After stream injection, it produced intermittently at a yield of 3.4 to 6.43 × 1 04 m3/d, showing a rapid pressure drop when the well was open and a slow pressure buildup after shut-in. So far, the cumulative gas production has been up to 0.12 × 10⁸ m3 (Figure 11.22b and Table 11.21). This suggests that the microporous A-P pattern has poor accumulation-permeation capacity, low deliverability, and weak stable production potential.

4 Fractured A-P pattern
This pattern may be developed in various types of lithologies and lithofacies. Fractures are predominant in reservoir spaces and seepage pathways, characterized by poor accumulation capacity but good permeation capacity. The characteristics of the production performance of volcanic reservoirs with a fractured A-P pattern show that a certain level of production can be obtained at the initial stage when the reservoir is opened, but it declines rapidly and fails to maintain at a stable level. Therefore, a volcanic reservoir with this A-P pattern is rarely opened directly; instead, the reservoir is put into development indirectly by opening overlying and underlying pay zones.
Horizon No. 224 (3737 to 3822 m) in Well XX21 is a typical example of a fractured reservoir that occurs in tight rhyolite of the middle subfacies of the effusive facies. Vesicles are absent but structural, blast, and contraction fractures are developed (Figure 11.23a). In this horizon, the average effective porosity is 1.44 %, and the average permeability is 8.09 mD, making it a low-porosity and high-permeability reservoir. No gas tests or production tests have been conducted in this horizon. However, in its overlying formation, No. 223 (3656 to 3737 m, with an effective porosity of 4% to 8%, and permeability of 0.1 to 8 mD), a natural deliverability of 3 × 10⁴ m3/d was obtained during gas testing, postfracturing production rose to 41.96 × 10⁴ m3/d, and the open flow capacity was 55.18 × 10⁴ m3/d (see Table 11.21). In horizon No. 223, the yield during production testing was stabilized at 12 × 104 m3/d; the pressure dropped rapidly but built up quickly after shut-in, and then increased gradually to approach a stable level (Figure 11.23b). This implies that some of the initial deliverability of No. 223 horizon is the contribution from the fractures in horizons No. 223 and No. 224, and the rapid production decline is consistent with the deliverability characteristics of a fractured A-P pattern.
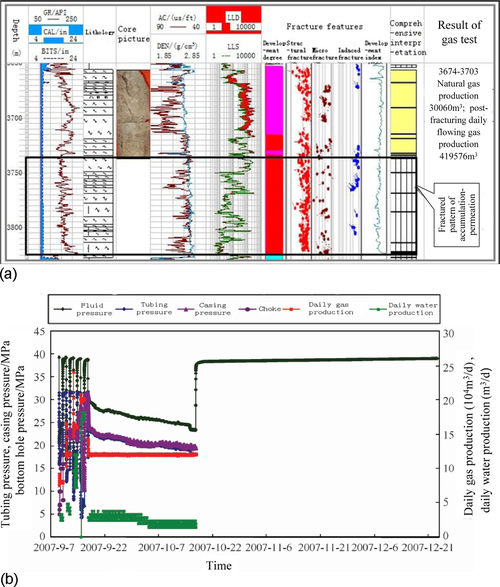
5 Fractured-vesicular A-P pattern
This A-P pattern is primarily developed in vesicular rhyolite of the top and upper subfacies of the effusive facies as well as breccia lava of the splash subfacies of the explosive facies. Its accumulation capacity is mainly controlled by the vesicular development and reservoir extension. The permeation capacity is affected by many factors such as fracture types and their degree of development, the radius of vesicle contraction throat, and the assemblage relationships of fractures and vesicles. This A-P pattern generally has a moderate accumulation-permeation capacity, and the volcanic reservoir of this pattern has a moderate deliverability and some stable production potential.
Horizons No. 59 II (3592 to 3600 m) and No. 60 IV (3665 to 3675 m) of Well XX9 consist of the upper subfacies vesicular rhyolite of the effusive facies. Reservoir spaces are predominantly the uniformly distributed small vesicles with well-developed structural and contraction fractures well connected by fractured and vesicle contraction throats, representing a typical fractured-vesicular A-P pattern (Figure 11.24a). In these formations, the average effective porosity is 6.3%, the average permeability is 1.19 mD, and the probe radius is 19.8 to 27 m, indicating a moderate accumulation and permeation capacity. Gas tests produced the following results: natural deliverability 0.05 × 10⁴ m3/d, postfracturing production 20.9 × 10⁴ m3/d, and open flow potential 23.16 × 10⁴ m3/d; after production commenced, the yield was maintained at 6 × 10⁴ m3/d, pressure dropped quickly and built up rapidly after well shut-in, and the gas production per pressure drop was 86.3 × 10⁴ m3/d/MPa. So far, the cumulative gas production has been 0.3 × 10⁸ m3, with the stable production period estimated at four years. This demonstrates that these reservoirs have a moderate accumulation-permeation capacity but a relatively low to poor potential for stable production (Figure 11.24b and Table 11.21).
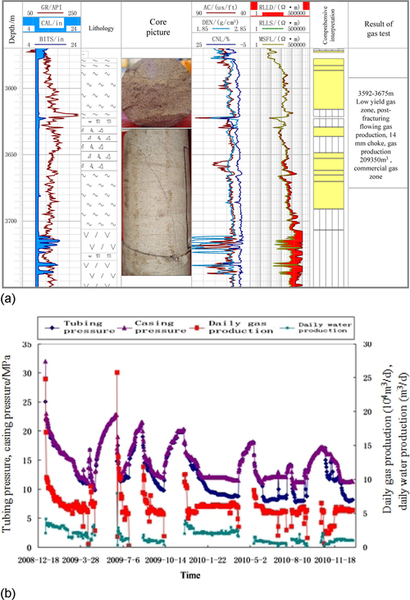
6 Fractured–intergranular porous A-P pattern
This A-P pattern occurs mainly in volcanic breccia of the fallout subfacies and welded breccia of the hot clastic flow subfacies, both of the explosive facies. Its accumulation capacity is affected by the degree of intergranular pore development and reservoir extension, whereas the permeation capacity is affected by multiple factors such as fracture types and their development, throat radius, and the assemblage relationships of fractures and intergranular pores. When intergranular pores and fractures are well developed, the reservoir permeation capacity is enhanced by fractures. Volcanic reservoirs with this A-P pattern tend to have high deliverability, a slow production decline, and strong potential for stable production.
Horizon No. 150 in Well XX1 is a volcanic breccia of the fallout subfacies, with large grain sizes. The reservoir space is dominated by intergranular pores of medium radius, with structural and blast fractures and intergranular pore-contraction throats and fractured throats. These features point to a typical fractured–intergranular porous A-P pattern (Figure 11.25a). In this reservoir, the average effective porosity is 8.6%, average permeability is 3.71 mD, and the probe radius is 205 m, suggesting good accumulation-permeation capacity. In this horizon, a deliverability of 53 × 104 m3/d was obtained during gas testing after fracturing, the yield of production testing was 14.07 × 10⁴ m3/d, and the open flow potential was 118 × 104 m3/d. After stream injection, it reached a production level of 12 to 24 × 104 m3/d, with a slow pressure drop; the gas production per pressure drop was up to 2630.4 × 104 m3/MPa. So far, the cumulative gas production has reached 2.5 × 10⁸ m3, with the stable production period estimated at seven years (see Table 11.21).

7 Fractured-microporous A-P pattern
This A-P pattern is found primarily in crystalline tuff of the hot base surge subfacies and welded tuff of the hot crystal flow subfacies (both of the explosive facies). Its accumulation capacity depends on the development of matrix micropores and the reservoir extension, whereas the ability of permeation is affected by the type, development, and distribution of fractures. Because fractures can improve the reservoir permeation capacity, a volcanic reservoir with this A-P pattern tends to have a high initial production, but rapid production decline, and poor potential for stable production.
Horizon No. 141-I in Well XX6-107 is characterized by the fractured-microporous A-P pattern, comprising rhyolitic breccia and crystalline tuff of the hot base surge subfacies. Matrix micropores are predominant in the reservoir spaces, with well-developed structural and blast fractures (Figure 11.26a). In this horizon, the average effective porosity is 6.31%, average permeability is 0.42 mD, and the probing radius is 53 m, indicating a fairly poor accumulation and permeation capacity. During gas testing, a natural deliverability of 0.17 × 10⁴ m3/d was obtained, postfracturing gas testing production rose to 9.7 × 10⁴ m3/d, the pilot gas production was 7.6 × 10⁴ m3/d, and open flow potential was 11.24 × 10⁴ m3/d. After production commenced intermittently, the pressure declined rapidly and built up slowly after well shut-in, indicating insufficient gas deliverability and a very low potential for stable production (Figure 11.26b and Table 11.21).
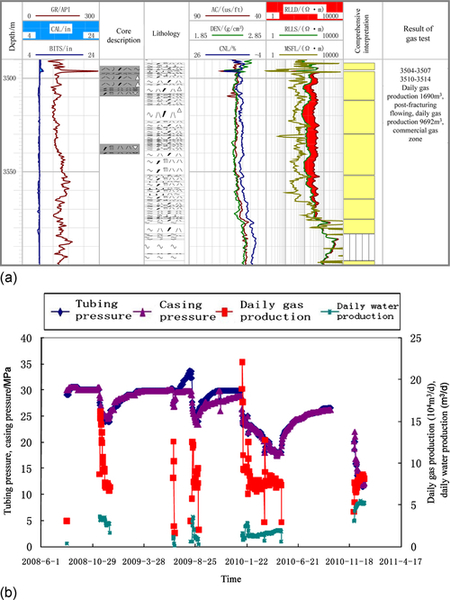
8 Fractured–dissolution-porous A-P pattern
This A-P pattern may occur in various volcanic rocks, especially common in the splash subfacies of the explosive facies, volcanic neck subfacies of the volcanic conduit facies, and top and upper subfacies of the effusive facies. The accumulation capacity of this pattern is controlled mainly by the development of dissolution pores and some primary pores, whereas the permeation capacity is controlled by the type and development of fractures, the radius of dissolution throats, and the assemblage relationships of fractures and dissolution pores. Dissolution increases the pore and throat sizes, whereas fractures further improve the reservoir permeation capacity. As a result, the fractured–dissolution-porous A-P pattern is generally characterized by good petrophysical properties, good communication between pores, and strong accumulation-permeation capacity. The volcanic reservoir with this A-P pattern generally has a high natural deliverability.
In Well XX8, horizon No. 74 XI consists of brecciated lava of the volcanic neck subfacies. Dissolution pores among large-sized grains are predominant in reservoir spaces, with additional vesicles and minor intergranular pores. Structural fractures, contraction fractures, and dissolution fractures can be seen in cores and are well developed. Due to its favorable pore-fracture association, the fractures play a large role in pore communication. These features denote a typical fractured–dissolution-porous A-P pattern (Figure11.27a). In this horizon, the average effective porosity is 16.7%, average permeability is 25.2 mD, and the probe radius is 36.6 m, indicating a fairly good accumulation-permeation capacity. During gas testing in this horizon, the natural deliverability reached 22.6 × 10⁴ m3/d and the open flow potential was 43.81 × 10⁴ m3/d. Due to its high CO2 content (up to 24.52%), this well has not been put on stream so far. Production testing for more than three months (Figure 11.27b) produced a yield value of 10 to 15 × 104 m3/d, with a stable pressure and a high ratio of gas yield per pressure drop at 1792.8 × 104 m3/MPa. These processes encountered a problem of upward breakthrough of bottom water along fractures. So far, the cumulative gas production has reached 0.12 × 10⁸ m3, and the stable production period is estimated to be six years (see Table 11.21).
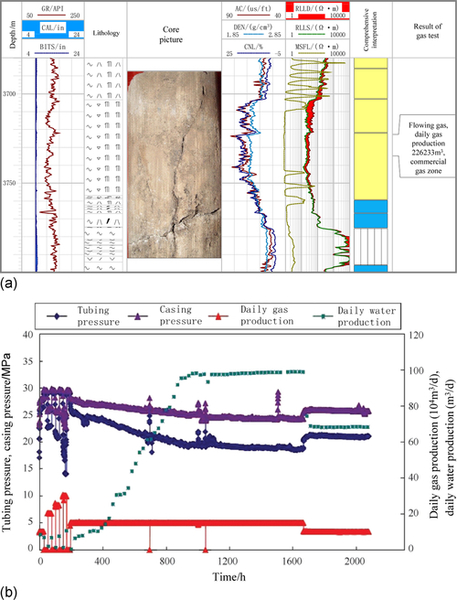
In summary, among the eight A-P patterns discussed, the fractured–dissolution-porous pattern has the highest accumulation-permeation capacity, the highest natural deliverability, and the best stable production potential; the vesicular, fractured-vesicular, and fractured–intergranular porous A-P patterns rank next; and the microporous pattern has the poorest properties.
11.5 Characterization of the microproducing capacity for volcanic gas reservoirs
On the basis of characterized reservoir spaces and throats, various methods are used to determine the cutoff thresholds of reservoir throats, and the grading standard for throats and permeability is established with reference to the classification scheme of effective reservoirs. The microproducing capacity of volcanic gas reservoirs is evaluated by characterizing the pore volumes and mobile fluid volumes controlled by different grades of throat radius, permeability, and displacement pressure. It will provide a basis for evaluating the producing capacity of reserves in different categories.
11.5.1 Throat cutoff thresholds of volcanic gas reservoirs
The throat cutoff threshold, also known as critical throat, refers to the minimum throat radius in a volcanic gas reservoir, at which natural gas can flow through. Below the threshold, the throats do not allow fluid flow, and this will not contribute to reservoir permeability [16]. Considering the geological features of volcanic gas reservoirs, three methods— including irreducible water film thickness analysis, the empirical formula, and the centrifuge experiment—are used to systematically determine the throat cutoff value in volcanic gas reservoirs.
1 Irreducible water film thickness analysis
A layer of stable irreducible water film is absorbed on the inner wall of pores and throats, which is difficult to remove under the pressure differential of the gas layer [17]. According to the adsorption theory, the sum of irreducible water film thickness on the inner wall and the motion diameter of the natural gas molecule (10 −4 to 10 −3 μm) is the throat diameter cutoff threshold for gas production.
In the laboratory, the thickness of irreducible water film is determined by the following procedures [18]. A core is taken from the net gas pay zones with oil-based drilling fluid, and then the microwave method or extraction method is used to measure the irreducible water volume in these cores. For the same core samples, high-pressure (over 400 MPa) mercury injection and adsorption methods are used to measure the specific surface of pores and throats. The irreducible water volume divided by the specific surface of pores and throats is the thickness of the irreducible water film. At present, the experiment to measure the thickness of irreducible water film is not yet performed for volcanic reservoirs. Therefore, the measurement results in carbonate reservoirs are used for reference. In the Sinian dolomite reservoirs of the Weiyuan gas field, the thickness of irreducible water film under different porosity conditions is measured. The cutoff value of the throat radius in effective reservoirs is calculated on the basis of the molecular diameter of natural gas at 0.001 μm (Table 11.22). As Table 11.22 shows, when porosity is in the range of 3% to 4%, the average thickness of irreducible water film is 0.0113 μm. Twice the water film thickness plus the molecular diameter of natural gas is 0.0235 μm—that is, when the throat diameter is less than 0.0235 μm, it will be difficult for natural gas molecule to flow through the throat. Therefore, the cutoff of the throat radius is half of the diameter—that is, about 0.0118 μm.
Table 11.22
Statistics on the Relationships between Porosity and Irreducible Water Film Thickness in Sinian Dolomite in the Weiyuan Gas Field [15]
| Porosity/% | < 1 | 1-1.5 | 1.5-2 | 2-3 | 3-4 | 4-5 | 5-6 |
| Average thickness of irreducible water film/μm | 0.0047 | 0.0057 | 0.0087 | 0.0106 | 0.0113 | 0.0148 | 0.0217 |
| Twice the water film thickness + the natural gas molecular diameter/μm | 0.0104 | 0.0124 | 0.0184 | 0.0220 | 0.0235 | 0.0305 | 0.0444 |
| Cutoff of the throat radius/μm | 0.0052 | 0.0062 | 0.0092 | 0.0111 | 0.0118 | 0.0153 | 0.0222 |
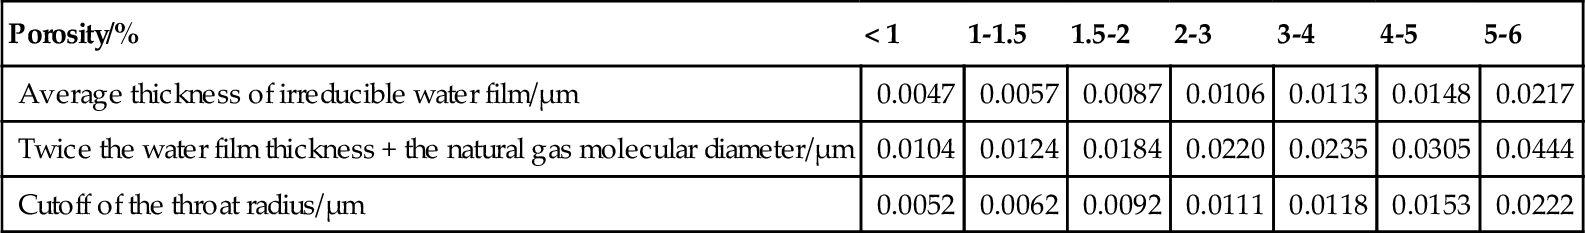
The porosity cutoff for volcanic gas reservoirs in the XX gas field determined by dynamic analysis and empirical statistics is about 3% to 4%. With reference to the thickness of the irreducible water film in the Sinian dolomite reservoir, the throat radius cutoff for volcanic gas reservoirs in this gas field is determined to be 0.01 μm.
2 Empirical formula method
Xiang and colleagues [19] studied the water film thickness in tight sandstone gas reservoirs. Based on the theoretical equation of water film thickness in a soil grain surface, the equation to calculate the core water film thickness is derived as follows:
Where,
di, water film thickness in core, μm;
ϕe, core porosity;
Swi, irreducible water saturation in core;
Aspecific, specific surface area of rock, m2/g;
ρ, rock density, g/cm3.
With reference to this empirical formula and the characteristics of volcanic gas reservoirs, the irreducible water film thickness in volcanic gas reservoirs is calculated to determine the throat cutoff in reservoirs.
The experimental data on relative permeability in 46 core samples from the XX volcanic gas reservoir revealed that the reservoir porosity is 2.5% to 16.9 %, irreducible water saturation is 32.61% to 53.02%, rock density is 2.13 to 2.65 g/cm3, and the specific surface area of rock is 3.25 m2/g [20]. Using Equation 11.5.1, the irreducible water film thickness is calculated to be 0.0106 to 0.061 μm. If the motion diameter of natural gas molecules is 0.001 μm, the throat radius cutoff will fall in the range of 0.0113 to 0.0615 μm. According to the calculation, the relationship between core porosity and water film thickness is plotted in Figure 11.28, and the cutoff distribution of the throat radius under different porosities is determined (Table 11.23). Based on these results as well as the porosity cutoff for volcanic gas reservoirs in the XX gas field determined by other methods, the thickness of irreducible water film is determined to be 0.0141 to 0.0161 μm, and the cutoff of the throat radius is 0.0146 to 0.0166 μm, with the average taken at 0.015 μm.

Table 11.23
Statistics on the Relationships between Porosity and Irreducible Water Film Thickness in Volcanic Rocks (XX Gas Field)
| Porosity/% | 2.5-3 | 3-5 | 5-8 | 8-10 | 10-12 | 12-15 | 15-17 |
| Average thickness of irreducible water film/μm | 0.0106 | 0.0183 | 0.0262 | 0.0367 | 0.0434 | 0.0436 | 0.0613 |
| Twice of water film thickness + natural gas molecular diameter/μm | 0.0222 | 0.0376 | 0.0534 | 0.0744 | 0.0878 | 0.0882 | 0.1236 |
| Cutoff of throat radius/μm | 0.0111 | 0.0188 | 0.0267 | 0.0372 | 0.0439 | 0.0441 | 0.0618 |
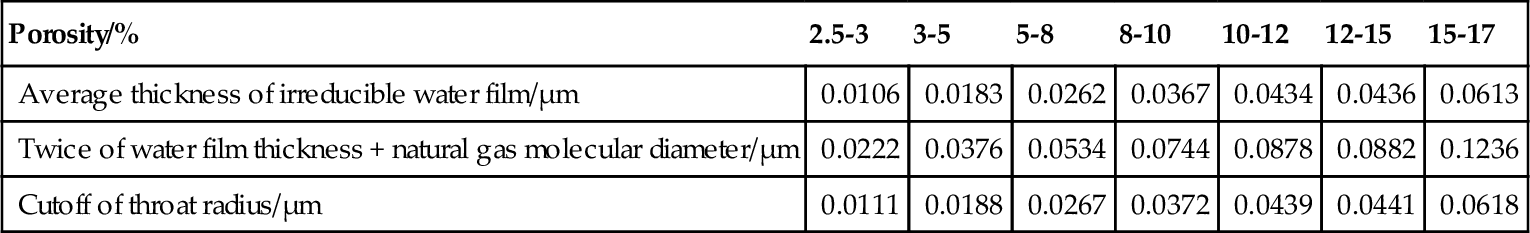
3 Centrifuge experiment method
For different sized throats, the centrifugal force required for fluid separation in a centrifuge experiment is different. According to the relationship between centrifugal force and throat radius, the centrifuge experiment can be used to determine the throat radius cutoff threshold.
Based on the capillary force formula, the relationship between centrifuge force and throat radius for a volcanic rock core sample is expressed by the following equation:

Where:
r, throat radius, μm;
σ, water - gas interfacial tension, mN/m, taking 72 mN/m;
θ, wetting angle (= 0°)
Yang and coworkers [21] selected 12 volcanic core samples from the XX gas field and used six of them to perform a centrifuge experiment and to measure the residual water saturation after the centrifuge process was measured (Table 11.24). The results are used to plot the relationship between centrifugal force and residual water saturation (Figure 11.29). The plot shows that the residual water saturation decreases with the increase of centrifugal force; when the centrifugal force is more than 2.07 MPa, the range of variation in residual water saturation narrows down. In these experiments, the characteristics of mobile (movable) water saturation controlled by different throats were obtained (Figure 11.30). The mobile (movable) water saturation decreases with the decrease in throat radius. At a throat radius of 0.04 μm, the saturation of mobile water is only 1.14% on average. However, the residual water saturation (55.24% on average) is slightly more than the irreducible water saturation (52.46% on average). This indicates that the throat with a radius smaller than 0.04 μm still controls 2.78% of the mobile water. In these experiments, no data are available to describe what occurs when the centrifugal force is higher than 3.45 MPa, so the trend of change is unclear for that range. It is believed that the cutoff of the throat radius in volcanic gas reservoirs shall be less than 0.04 μm.
Table 11.24
Measurements of Residual Water Saturation in Core Samples at Different Centrifugal Forces (from Yang Zhengming)
| Sample Number | Residual Water Saturation after Different Centrifugal Forces Are Applied/% | Irreducible Water Saturation Derived from NMR Experiments | ||||||
| No Centrifugal Force Is Applied | 0.35 MPa | 0.69 MPa | 1.38 MPa | 2.07 MPa | 2.76 MPa | 3.45 MPa | ||
| 2 | 100 | 53.13 | 86.92 | 71.99 | 61.64 | 55.66 | 54.5 | 53.13 |
| 6 | 100 | 31.77 | 59.14 | 48.47 | 43.17 | 40.06 | 38.67 | 31.77 |
| 10 | 100 | 50.52 | 74.34 | 61.82 | 54.91 | 51.83 | 51.1 | 50.52 |
| 30 | 100 | 39.07 | 70.12 | 52.86 | 45.59 | 42.16 | 40.88 | 39.07 |
| 55 | 100 | 47.90 | 74.74 | 61.31 | 54.39 | 49.8 | 48.87 | 47.90 |
| 63 | 100 | 72.77 | 96.79 | 90.48 | 80.91 | 76.3 | 74.64 | 72.77 |
| 68 | 100 | 66.94 | 98.03 | 88.65 | 75.96 | 73.46 | 73.1 | 66.94 |
| 73 | 100 | 50.74 | 79.07 | 63.75 | 55.9 | 53 | 52.22 | 50.74 |
| 95 | 100 | 42.80 | 84.15 | 62 | 53.72 | 49.31 | 48.14 | 42.80 |
| 103 | 100 | 68.91 | 91.47 | 83.27 | 76.61 | 72.25 | 70.31 | 68.91 |

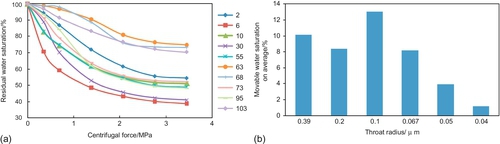
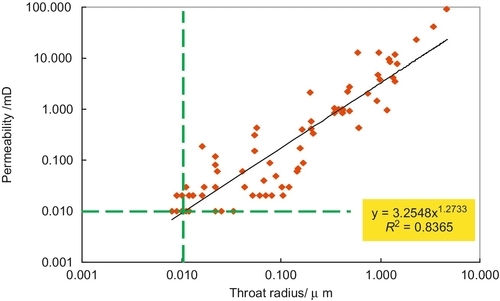
4 Throat cutoff threshold in volcanic reservoirs
Among the three methods used to determine throat cutoff values (Table 11.25), water film thickness analysis and the empirical formula method are based on the adsorption theory, which involves integrating the method of experiment and empirical formula, respectively, to determine the irreducible water film thickness under different porosity conditions and then combining the result with the natural gas molecular diameter to determine the minimum throat radius that will allow natural gas flow. The throat cutoff values determined by these two methods are relatively close (0.01 to 0.015 μm). According to the centrifuge experiment and the capillary force equation, the residual water saturations under different centrifugal forces are measured to characterize the mobile water saturation controlled by throats of different sizes. The throat cutoff threshold is determined by comparison with the irreducible water saturation determined by Nuclear-Magnetic Resonance (NMR) experiment. The comprehensive analysis suggests that when the throat radius is more than 0.04 μm and the centrifugal force is lower than 3.45 MPa, most of the mobile fluid may be produced; when the throat radius is between 0.01 to 0.04 μm, increased centrifugal force will produce part of the mobile fluid; when the throat radius is less than 0.01 μm, no mobile fluid exists in the reservoir. Therefore, the throat radius cutoff threshold in volcanic gas reservoirs is determined to be 0.01 μm.
Table 11.25
Comparison of Throat Radius Cutoffs in Volcanic Gas Reservoirs Determined by Different Methods (XX Gas Field)
| Method | Irreducible Water Film Thickness Analysis | Empirical Formula Method | Centrifuge Experiment Method | Cutoff Determined after Comprehensive Analysis |
| Cutoff of throat radius/μm | 0.01 | 0.015 | < 0.04 | 0.01 |

11.5.2 Permeability cutoff and permeability classification in volcanic gas reservoirs
The throat radius determines the microflow capacity. The permeability determines the macroscopic producing capacity, with the two factors related with each other. In order to characterize the effective pore volume and mobile fluid volume in volcanic gas reservoirs from different perspectives, the relationship between reservoir permeability and throat radius is established using mercury injection data, and consequently the permeability cutoff is determined. The throat radius and permeability classification standard for different types of reservoirs are established by combination with the classification standard for effective reservoirs in volcanic rocks.
Figure 11.30 shows the crossplot of reservoir permeability versus throat radius, based on the mercury injection data from the XX gas field. The plot shows that rock permeability is positively correlated to throat radius. With reference to the throat radius cutoff value (0.01 μm), the permeability cutoff is determined to be about 0.01 mD. Furthermore, the classification standard for throat radius and permeability in volcanic gas reservoirs and the corresponding relationships between them are further established according to the classification and evaluation standard for effective reservoirs in volcanic gas reservoirs (Table 11.26).

11.5.3 Characterization of effective pore volume in volcanic gas reservoirs
Effective pore volume refers to the pore volume connected by throats with a radius greater than the cutoff threshold (> 0.01 μm). It is often expressed by the percentage of effective pore volume to the total pore volume. Volcanic reservoirs have a high degree of heterogeneity at the microscopic scale. Throat, permeability, and displacement pressure at different levels control different effective pore volumes.
1 Effective pore volume controlled by different throats and permeability
In general, a larger pore volume associated with large throats corresponds to a higher reservoir permeability and better reservoir fluid-producing capacity. The following information on pore volumes controlled by different throats has been obtained using mercury injection test data of volcanic gas reservoirs in the CC gas field (Table 11.27):
Table 11.27
Pore Volumes Controlled by Different Throats and Permeability (CC Gas Field)
| Parameter | Range | Total | |||
| Throat radius/μm | > 0.25 | 0.25 ~ 0.05 | 0.05 ~ 0.01 | ||
| Matrix permeability/mD | > 0.1 | 0.1 ~ 0.015 | 0.015 ~ 0.01 | ||
| Pore volume controlled by different throats or permeability/% | Type I reservoir | 41.97 | 36.73 | 3.83 | 82.53 |
| Type II reservoir | 17.52 | 39.62 | 7.16 | 64.30 | |
| Type III reservoir | 1.98 | 39.26 | 11.12 | 52.36 | |
| Volcanic reservoir | 20.49 | 38.54 | 7.37 | 66.40 | |

1. The effective throats (radius > 0.01 μm) in volcanic rocks control 66.40% of pore volume. Among these, the throats with a radius of 0.25 to 0.05 μm control the most pore volume (accounting for 38.54%), the throats with a radius larger than 0.25 μm control 20.49%, and the throats with a radius of 0.05 to 0.01 μm control the least amount of pore volume (7.37%). This implies that most of the volcanic gas reservoir pores in this gas field are controlled by larger throats.
2. A better reservoir type has a larger pore volume controlled by effective throats. The effective throats in types I, II, and III reservoirs control 82.53%, 64.3%, and 52.36% of pore volumes, respectively. With the improvement of reservoir type, the pore volumes controlled by effective throats increase notably.
3. A better reservoir type has a larger effective pore volume controlled by large throats. For a type I reservoir, the effective pore volume controlled by throats with a radius larger than 0.25 μm is the largest (accounting for 41.97%), followed by throats with a radius of 0.25 to 0.05 μm (36.73%). For type II reservoirs, the effective pore volume controlled by throats with a radius of 0.25 to 0.05 μm is the largest (accounting for 39.62%), and throats with a radius of more than 0.25 μm account for 17.52%. For type III reservoirs, the effective pore volume controlled by throats with a radius of 0.25 to 0.05 μm is the largest (39.26%), followed by throats with a radius of 0.05 to 0.01 μm (11.12%).
Matrix permeability is correlated to throat radius (see Figure 11.30). The pore volume controlled by different grades of permeability has the same characteristics as the pore volume controlled by different throats (see Table 11.27): (1) the effective volcanic reservoirs control 66.40% of the pore volume, which is higher than that controlled by matrix permeability over 0.015 Md; (2) a better reservoir type will have a larger effective pore volume controlled by high matrix permeability.
2 Effective pore volume controlled by different displacement pressures
A mercury injection test is performed to characterize the pore volume controlled by different displacement pressures, which can provide a basis for determining the appropriate production pressure differential for gas reservoir development. The displacement pressure of volcanic reservoirs has a good correlation with the throat radius (Figure 11.31). The effective pore volume controlled by different displacement pressures has the same characteristics of effective pore volume controlled by different grades of throats (Figure 11.32, Table 11.28):

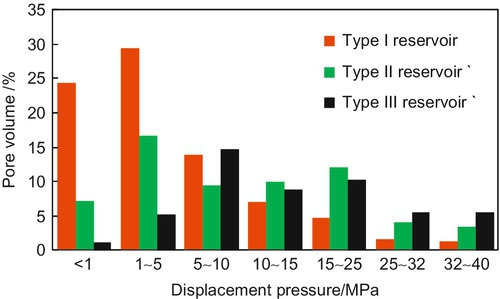
Table 11.28
Effective Pore Volume Controlled by Different Displacement Pressures (CC Gas Field)
| Parameter | Distribution Ranges | Total | |||||||
| Displacement Pressure/MPa | < 1 | 1-5 | 5-10 | 10-15 | 15-20 | 25-32 | 32-40 | ||
| Pore volume controlled by different displacement pressures/% | Type I reservoir | 24.34 | 29.37 | 13.83 | 6.99 | 4.70 | 1.59 | 1.38 | 82.20 |
| Type II reservoir | 7.25 | 16.62 | 9.53 | 9.96 | 12.05 | 4.13 | 3.36 | 62.90 | |
| Type III reservoir | 1.15 | 5.22 | 14.69 | 8.82 | 10.28 | 5.59 | 5.61 | 51.36 | |
| Volcanic reservoir | 10.91 | 17.07 | 12.68 | 8.59 | 9.01 | 3.77 | 3.45 | 65.48 | |
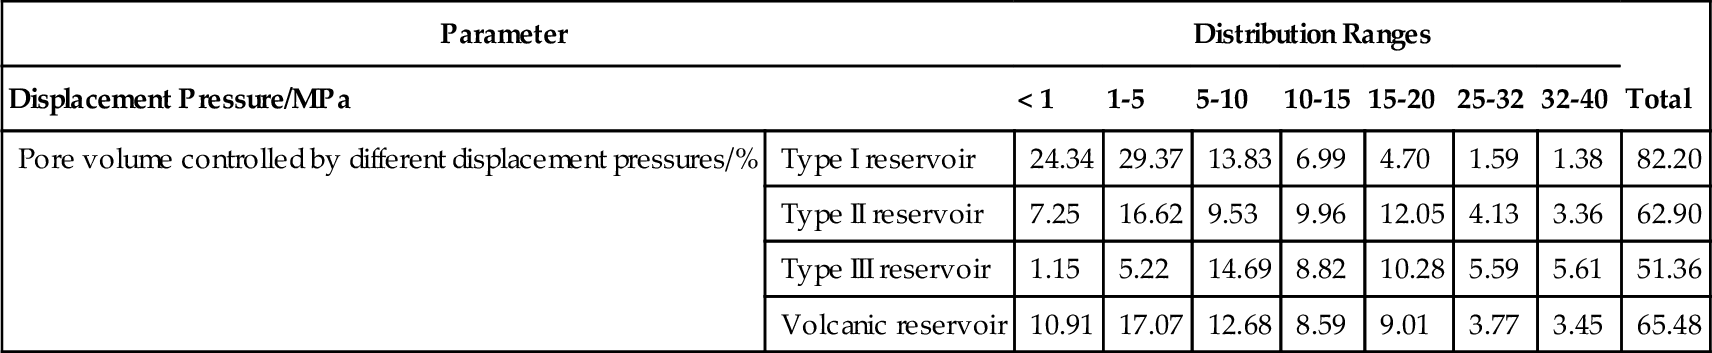
1. When displacement pressure is greater than 40 MPa, the effective pore volume in volcanic reservoirs accounts for 65.48% of total pore volume; when displacement pressure is less than 1, 5, 10, 15, and 25 MPa, the effective pore volumes controlled by displacement pressure are 10.91%, 27.98%, 40.67%, 49.26%, and 58.26%, respectively. This suggests that a lower displacement pressure controls the effective pore volume in volcanic reservoirs.
2. A better reservoir will have a larger effective pore volume controlled by a lower displacement pressure. For a type I reservoir, more than half of the effective pore volume (53.71%) is associated with a displacement pressure < 5 MPa; for a type II reservoir, more than half of the effective pore volume (33.40%) is controlled by a displacement pressure < 10 MPa, with the main controlling pressure ranging from 1 to 25 MPa; for a type III reservoir, most of the effective pore volume (29.88%) is controlled by a displacement pressure < 15 MPa, with the main controlling pressure ranging from 5 to 25 MPa.
11.5.4 Characterization of the microproducing capacity of volcanic gas reservoirs
The producing capacity of reservoir fluid is the key for assessing the potential for natural gas reservoir development [22]. It is usually characterized by the mobile (movable) fluid volume, which refers to the pore volume occupied by mobile fluid, usually expressed by the percentage of total pore volume that is occupied by mobile fluid. Considering the complexity of volcanic reservoirs, NMR tests and mercury injection tests are combined to quantitatively characterize the mobile fluid volume controlled by different throats, different permeability values, and different displacement pressure values, so as to evaluate the microproducing capacity of volcanic gas reservoirs.
1 Mobile fluid volume controlled by different throats and permeabilities
Throats control the fluid flow capacity of reservoirs. The saturation of mobile fluid in reservoirs is positively correlated to the throat radius (Figure 11.33). In the XX gas field, NMR tests and mercury injection tests are combined to quantitatively characterize the mobile fluid volume controlled by different throats (Figure 11.34, Table 11.29). The tests show the following results:
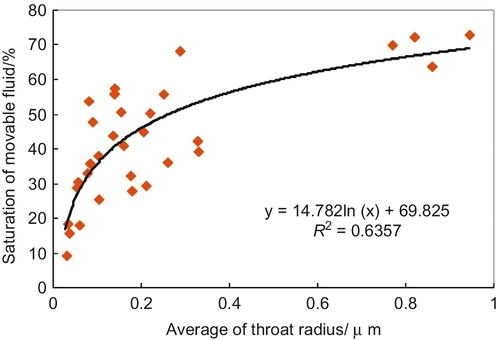

Table 11.29
Comparison of Mobile Fluid Saturation Controlled by Different Throats (XX Gas Field)
| Parameter | Distribution Range | Total | ||||||
| Throat radius/μm | > 0.75 | 0.75-0.5 | 0.5-0.25 | 0.25-0.1 | 0.1-0.05 | 0.05-0.01 | ||
| Matrix permeability/mD | > 2.3 | 2.3-1.3 | 1.3-0.5 | 0.5-0.2 | 0.2-0.07 | 0.07-0.01 | ||
| Mobile fluid volume controlled by different throats/% | Type I reservoir | 21.38 | 8.38 | 22.47 | 12.96 | 0.00 | 0.00 | 65.19 |
| Type II reservoir | 4.66 | 1.38 | 9.15 | 26.55 | 4.92 | 0.75 | 47.40 | |
| Type III reservoir | 4.56 | 0.52 | 2.06 | 7.46 | 8.05 | 1.78 | 24.43 | |
| Volcanic reservoir | 10.20 | 3.43 | 11.23 | 15.66 | 4.32 | 0.84 | 45.67 | |
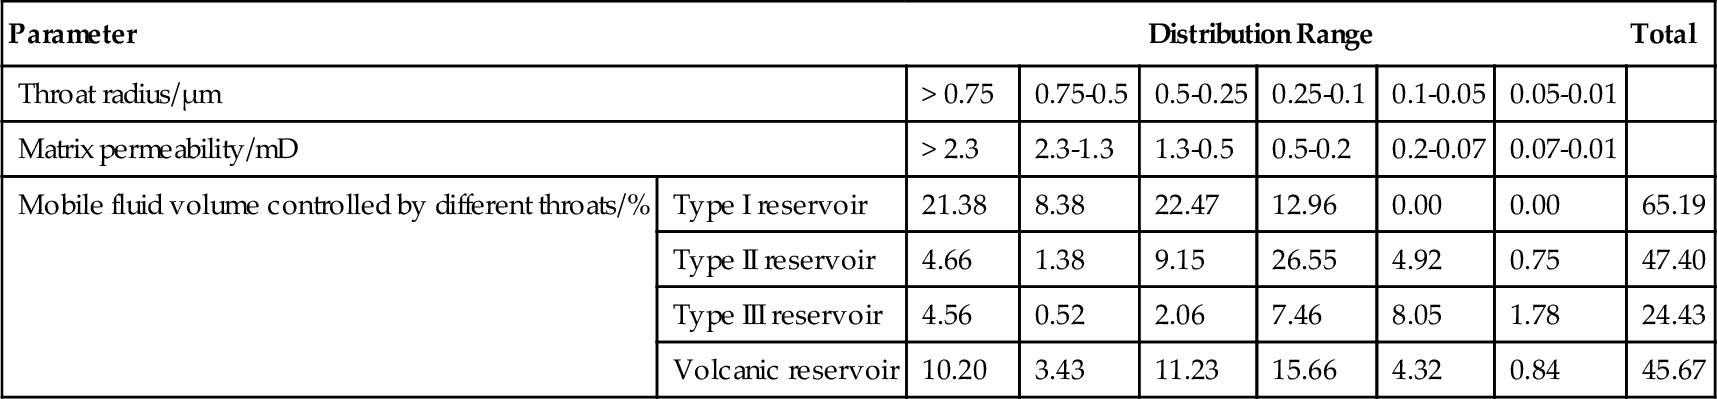
1. The effective throats (> 0.01 μm) control 45.67% of mobile fluid volume, among which throats with a radius of 0.1 μm control 40.51% of mobile fluid volume. This indicates that the mobile fluid volume in volcanic reservoirs is small, controlled by larger throats.
2. A better reservoir corresponds to a larger mobile fluid volume controlled by effective throats. The effective throats in type I, type II, and type III reservoirs control 65.19%, 47.40%, and 24.43%, respectively, of mobile fluid volume. The mobile fluid volume controlled by effective throats increases notably with better reservoir properties.
3. A better reservoir also corresponds to a larger movable fluid volume controlled by large throats. In type I reservoirs, the mobile fluid volume controlled by throats with a radius that is > 0.75 μm and in the 0.5 to 0.25 μm range is the largest (21.38%, 22.47%, respectively), and that controlled by throats with a radius of 0.25 to 0.1 μm ranks second (12.96%). In type II reservoirs, the mobile fluid volume controlled by throats with a radius of 0.25 to 0.1 μm is the largest (26.55%), and that controlled by throats with a radius of 0.5 to 0.25 μm ranks next (15.18%). In type III reservoirs, the movable fluid volume controlled by throats with a radius of 0.1 to 0.05 μm is the largest (8.05%), and that controlled by throats with a radius of 0.25 to 0.1 μm ranks second (7.46%).
Similarly, the mobile fluid volume controlled by different permeabilities is analogous to that controlled by different throats (see Table 11.29): (1) the effective reservoirs in volcanic rocks control 45.67% of the movable fluid volume, among which the movable fluid volume controlled by a matrix permeability higher than 0.1 mD is the largest (40.51%); and (2) the better the reservoir, the larger the mobile fluid volume controlled by a high matrix permeability.
2 Mobile fluid volume controlled by different displacement pressures
Mobile fluid saturation is well correlated to the displacement pressure (Figure 11.35). Lower displacement pressure in a volcanic reservoir corresponds to a higher movable fluid saturation. The mobile fluid volume controlled by different displacement pressures is related to the reservoir types (see Figure 11.36, Table 11.30):
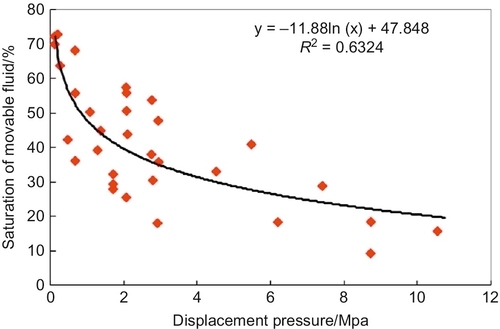
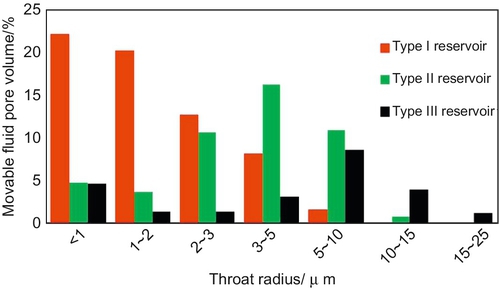
Table 11.30
Mobile Fluid Volume Controlled by Different Displacement Pressures (XX Gas Field)
| Parameter | Distribution Ranges | Total | |||||||
| Displacement Pressure/MPa | < 1 | 1-2 | 2-3 | 3-5 | 5-10 | 10-15 | 15-25 | ||
| Mobile fluid volume controlled by different expulsion pressures/% | Type I reservoir | 22.21 | 20.25 | 12.79 | 8.26 | 1.68 | 0.00 | 0.00 | 65.19 |
| Type II reservoir | 4.78 | 3.75 | 10.73 | 16.32 | 11.03 | 0.79 | 0.00 | 47.40 | |
| Type III reservoir | 4.63 | 1.37 | 1.39 | 3.22 | 8.66 | 3.95 | 1.20 | 24.43 | |
| Volcanic reservoir | 10.54 | 8.45 | 8.31 | 9.26 | 7.12 | 1.58 | 0.40 | 45.67 | |

1. In the XX gas field, the mobile fluid volume in volcanic reservoirs is about 45.67%, and the displacement pressure is less than 25 MPa. When the displacement pressure is less than 1, 3, 5, 10, and 15 MPa, the mobile fluid volume controlled by the displacement pressure is 10.54%, 27.3%, 36.57%, 43.69%, and 45.27%, respectively. Most movable fluid is distributed in reservoirs with displacement pressures less than 10 MPa.
2. A better reservoir has a larger mobile fluid volume controlled by low displacement pressure and better mobility of the reservoir fluid. For type I reservoirs, displacement pressures at ranges less than 2 MPa and 3 MPa correspond to 42.46% and 55.25% mobile fluid, respectively; for type II reservoirs, most mobile fluid (38.08%) corresponds to displacement pressures of 2 to 10 MPa. In type III reservoirs, most of the mobile fluid (15.83%) is related to displacement pressures of 3 to 15 MPa. Therefore, the better the reservoir, the more mobile the reservoir fluid, and the lower the production pressure differential required.
Considering the complexity of microtexture in volcanic gas reservoirs, this chapter has focused on the characterization of reservoir spaces and the shapes, sizes, and accumulation-permeation capacity of throats, using the methods of core observation, thin section examination, laboratory testing, log interpretation, and dynamic analysis. On the basis of these studies, the characteristics of effective pore volume and mobile fluid volume controlled by different throats, permeabilities, and displacement pressures are analyzed. Ultimately, the volcanic gas reservoir microtexture characterization is developed, which provides technical support for evaluating the producing capacity of different types of effective reservoirs. For the volcanic gas reservoir in the XX gas field (Table 11.31), NMR tests and mercury tests show the following features:
Table 11.31
Analysis of the Producing Capacity of Different Types of Volcanic Gas Reservoirs (XX Gas Field)
| Reservoir Type and Characteristics | Reserves Proportion/% | Evaluation of Producing Ability | ||||
| Reservoir Types | Matrix Permeability/mD | Throat Radius/μm | Effective Pore Volume/% | Movable Fluid Volume/% | ||
| Type I reservoir | > 0.1 | > 0.25 | 93.78 | 65.19 | 10 | Recoverable under present economic and technological conditions |
| Type II reservoir | 0.015-0.1 | 0.25-0.05 | 82.69 | 47.40 | 30 | Recoverable by applying new technology |
| Type III reservoir | 0.01-0.015 | 0.05-0.01 | 61.75 | 24.43 | 35 | Recoverable through new R and D technology |
| 25 | Difficult to develop at present | |||||
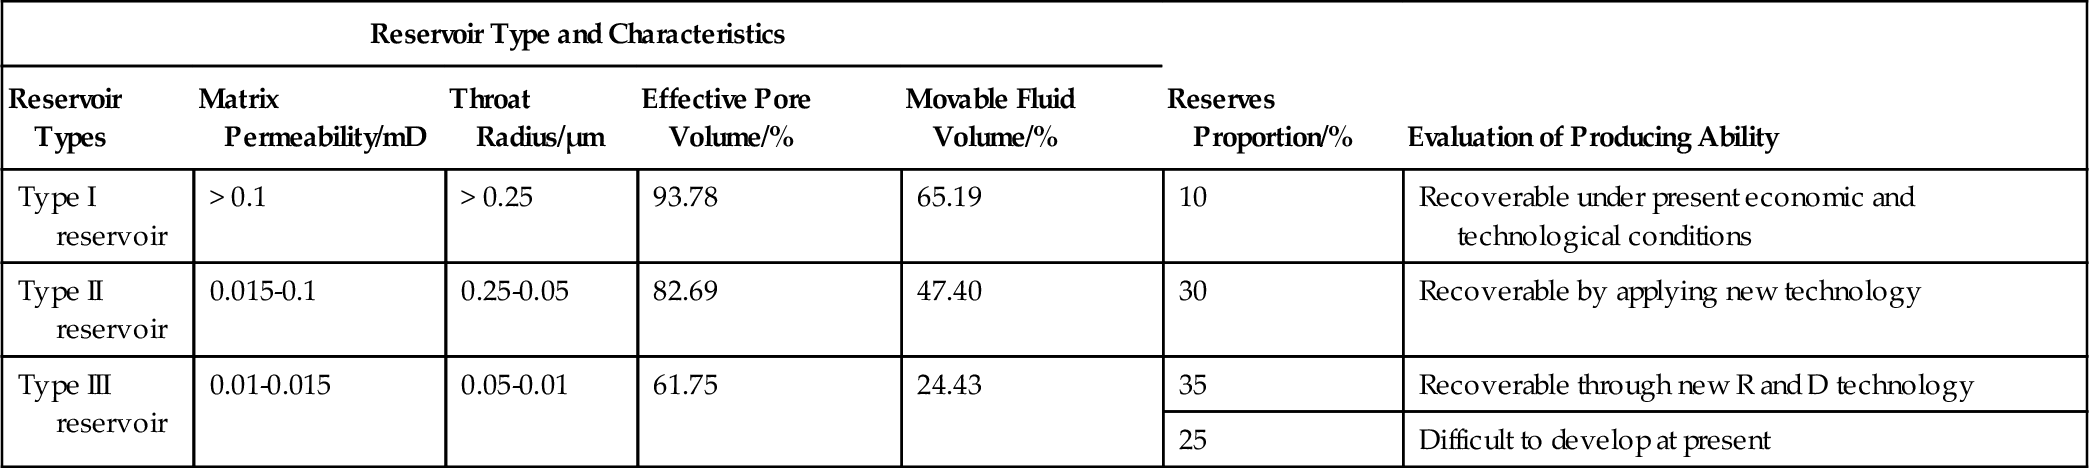
1. In a type I reservoir in this gas field, the effective pore volume accounts for 93.78% of the total pore volume, and the mobile fluid volume accounts for 65.19% of the total pore volume. The reservoir fluid has high seepage and good producing capacities. Its natural gas reserves (about 10% of the proven in situ gas) can be recovered effectively under present economic and technological conditions.
2. In a type II reservoir, the effective pore volume accounts for 82.69% of the total pore volume, and the mobile fluid volume accounts for 47.40% of the total pore volume. The reservoir fluid has medium seepage and relatively good producing capacities. Its natural gas reserves (about 30%) can be recovered effectively by applying new technologies such as staged fracturing in horizontal wells.
3. In a type III reservoir, the effective pore volume accounts for 61.75% of the total pore volume, and the mobile fluid volume accounts for 24.43% of the total pore volume. The reservoir fluid has poor seepage and producing capacities. For its natural gas reserves (about 60% of the proven in situ gas), about 35% can be recovered effectively by applying new research and development technologies, but the remaining 25% will be difficult to extract at present.