Characterization of Accumulation-Permeation Units in Volcanic Gas Reservoirs
The accumulation-permeation (hereafter abbreviated as A-P) unit is the fundamental and main object in the development of volcanic gas reservoirs. The concept of A-P units in volcanic gas reservoirs is presented here for the first time by comparisons with the flow units in clastic rocks and accumulation units in carbonate rocks. By establishing identification markers, single-well data are used to identify A-P units. In terms of well identification and in combination with seismic data of single-well calibration, seismic data are used to predict the profile, planar, and spatial distribution patterns of A-P units. In these studies, the outcrop, morphology, superposition relationships, connectivity, and permeability of A-P units are characterized on the basis of outcrop and seismic data and dense well pattern data, and the distribution of A-P units is revealed. This can guide the optimization of well location, the design of horizontal well trajectory, and the preparation of development technology policy.
10.1 Concept and characterization of accumulation-permeation units
10.1.1 Concept of the accumulation-permeation unit
Concept is the essential cognition of objectives formed in human mind [1]. The concept of A-P units is helpful for establishing their identification models and revealing their distribution patterns. According to the characteristics of A-P units in volcanic gas reservoirs and comparisons with the flow units of clastic rocks and reservoir units of carbonate rocks, the concept of A-P unit is formed by refining their spatial distribution, petrophysical properties, and accumulation and permeability capacities.
1 Flow unit
The concept of the flow unit in clastic rocks was originally proposed to meet the need of detailed description and prediction of complicated reservoirs and the characterization of dynamic and static oil and gas reservoirs in studies on the formation and distribution of residual oil. In 1984, Hearn and coworkers first defined flow units as vertically and laterally continuous accumulation zones with similar permeability, porosity and bedding-plane characteristics [2]. In 1987, Ebanks presented flow units as vertically and laterally continuous reservoir rock bodies with similar geological and petrophysical rock properties, which influence fluid flow [3]. In 1993, Amacfule and colleagues defined flow units as layers with similar hydraulic characteristics within given rocks [4]. Qiu and associates considered flow units to be naturally formed fluid flow pathways that resulted when injected water displaced oil along geological structures due to reservoir heterogeneity, barrier, and bypassing conditions [5]. Mu and coworkers treated a flow unit as an accumulation unit with homogeneous permeability and water-flooding characteristics, bounded by discontinuous thin barriers, various sedimentary microinterfaces, minor faults, and permeability differences [6]. Jiao referred to flow units as building blocks within a sedimentary system, which are subdivided by subsurface hydrodynamic conditions [7], and Liu considered flow units to be special accumulation bodies that are continuous spatially, have similar petrophysical features and fluid flow characteristics, and are bounded by lithological or petrophysical barriers [8].
In summary, a flow unit has homogeneous petrophysical, hydrodynamic, and fluid flow properties, with defined barriers or boundaries, and a set of flow units can be the same time units or sedimentary units or the combination of different time units or sedimentary units.
2 Reservoir unit and fracture-cavity unit
The concept of the reservoir unit is derived from correlations of carbonate reservoirs with heterogeneous fractures and cavities. In the book How to Understand Reservoir compiled by Yuan (1979), the concept of the reservoir unit was defined for the first time as the basic lithological association that can form oil and gas sealing conditions in vertical profiles [9]. A reservoir unit comprises the reservoir, pay zone, cap rock, and basal bed. Among these, the pay zone and cap rock are the crucial components; the former determines the production capacity of a reservoir unit, and the latter determines its sealing capacity; the two components coexist in the entity of the reservoir unit. The concept of the reservoir unit is widely used to correlate carbonate hydrocarbon reservoirs, such as in works by Chen [10], Xiong [11], Wu [12], and Chen [13].
In 2006, Jiao and Du summarized the development results of fracture-cavity carbonate reservoirs in the Tahe oilfield and presented the concept of the fracture-cavity system and unit in order to characterize karst fracture-cavity reservoirs and their internal fluid connectivity [14,15]. A fracture-cavity system refers to the karst fracture-cavity zones or an assemblage of pores, cavities, and fractures in the same karst framework, and various systems are separated by continuous tight bodies. A fracture-cavity unit also refers to a hydrodynamic unit or connected body with a uniform pressure system, which comprises single or multiple dissolution cavities connected by a fracture network and isolated by relatively tight or low-permeability dissolution interfaces or closed fractures. A fracture-cavity system may be composed of single or multiple fracture-cavity units.
In summary, a reservoir unit comprises continuous reservoir bodies, tight dissolution or lithological boundaries, and closed fractures, developed in fracture-cavity carbonate reservoirs.
3 Accumulation permeation unit (A-P unit)
The concept of the A-P unit is proposed for the first time in this study for predicting the distribution of effective A-P bodies during the development of volcanic gas reservoirs. Similar to clastic flow units, carbonate reservoir units, and fracture-cavity units, a volcanic A-P unit comprises effective A-P bodies and peripheral flow-resistance zones, and the unit is an independent hydrodynamic system with similar fluid flow characteristics. Therefore, a volcanic A-P unit is defined as a volcanic rock unit with the same petrogenetic origin, a continuous distribution, and uniform hydrodynamic system, which is isolated by impermeable flow-resistant zones and is capable of accumulating fluid and allowing fluid to flow effectively within the unit. Under the control of volcanic rock architecture, most A-P units are developed in the same volcanic edifice, the same eruption period, and even the same lithofacies unit. A-P units may be connected by open faults, structural fractures, or columnar joint fractures; alternatively, they form a large communicated body via vertical or lateral contact.
10.1.2 Challenges in characterizing accumulation-permeation units (A-P units)
Due to their usually small scale, complex architecture, and superposition relationships, A-P units are difficult to identify and characterize in the following two aspects.
1 Complex internal structures and small-scale A-P units pose problems for their seismic identification
Rich single-well data can reflect the change in various volcanic A-P characteristics, and it is easy to identify the A-P unit in single wells. However, the small scale, limited lateral extension, and low seismic resolution, together with complex volcanic internal structures (architecture), significantly hamper the seismic identification of an A-P unit, making it difficult to identify A-P units using seismic data.
2 Complicated shape and superposition relationships and strong internal heterogeneity make it difficult to characterize A-P units quantitatively
It is generally a challenging task to characterize the highly variable types, complex shapes, and complex superposition relationships and reservoir spaces of A-P units in a volcanic gas reservoir. In addition, due to the poorly defined superposition relationships and short production periods, the production performance data cannot clearly reflect interwell interference or coherence parameters, leading to difficulties in characterizing the connectivity of A-P units. Due to the rapid change or strong heterogeneity of volcanic reservoirs, the determination A-P capacity of A-P units outside the well points is usually fraught with high uncertainty, making it difficult to accurately characterize their accumulation-permeation capacity.
10.1.3 Technical solutions
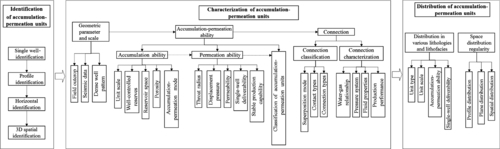
To meet the challenges of characterizing A-P units, the technical process for identification and characterization is set up in accordance with the principle of proceeding from single-well to profile, then to plane and space, applying integrated methods of static and dynamic analyses (Figure 10.1). The complete set of A-P unit characterization techniques thus developed provides a basis for ascertaining the distribution patterns of A-P units.
1 Identification of A-P units
Lithology, lithofacies, accumulation-permeation capacity, and logging response characteristics are used for establishing identification markers of volcanic A-P layers, barriers, and interbeds, for identifying the interface of A-P layers; and for dividing A-P units in wells. With this process, the identification methods used to determine multiwell profiles, seismic reflection profiles, and inversion profiles are used to establish a profile identification model for A-P units and to reveal their profile distribution characteristics. Furthermore, sensitive attributes are extracted and analyzed to predict the planar distribution of A-P units. Finally, various methods—such as interface tracking based on seismic framework profile, spatial determination of volume attributes, and analysis of inversion data volumes—are used to predict the spatial distribution of A-P units and lay the foundation for the quantitative characterization of A-P units.
2 Characterization of A-P units
This process includes the characterization of geometry, scale, connectivity, and the accumulation-permeation capacity of A-P units:
1. Based on outcrop surveys, seismic data interpretation, and dense well grid analysis, the geometry and superposition relationships of the A-P unit are ascertained to quantitatively characterize their geometric parameters.
2. The superposition relationships or stacking patterns of A-P units are classified on the basis of their contact relationships and connection modes. Moreover, faults, fractures, water-gas relationships, fluid properties, pressure systems, and the production performance of A-P units are analyzed comprehensively to characterize their connectivity.
3. Based on the optimization of characterization parameters of accumulation-permeation capacity, the classification criteria for A-P units of volcanic gas reservoirs are established to characterize their accumulation-permeation capacity based on various parameters.
3 Distribution of A-P units
The distribution characteristics of A-P units in various lithofacies are evaluated on the basis of their types, scale, and accumulation-permeation capacity as well as well deliverability. According to the correlation of geological profiles, identification results of seismic profiles, and planar attributes and 3D space, the distribution of A-P units in 3D space is delineated to guide effective reservoir prediction. This provides the basis for optimization of well location, trajectory design of horizontal wells, and preparation of development technology policies.
10.2 Identification and prediction of accumulation-permeation units
To resolve the difficulties in identifying and predicting volcanic A-P units, the distribution characteristics of these units in volcanic gas reservoirs are clarified on the basis of static and dynamic data (including core, logging, seismic, gas tests; and pilot production data), in combination with single-well and profile identification, planar; and 3D spatial prediction. This provides the basis for characterizing A-P units.
10.2.1 Single-well identification
Based on the established identification marks of volcanic A-P units, single-well data are used to identify volcanic A-P layers, barriers, and interbeds and to divide A-P units in wells. This provides the basis for profile identification.
1 Identification markers of A-P units
A-P layers, along with their top and bottom barriers, are the key components of A-P units. Based on the geological characteristics of volcanic A-P units, barriers, and interbeds, the identification markers for the accumulation-permeation capacity of A-P units are established through the analysis of logging response characteristics. This provides the basis for the identifying A-P units in wells.
1) Geological characteristics of A-P units
A-P units are distributed in all lithologies and lithofacies; however, reservoir spaces in different lithologies and lithofacies are highly variable and of different petrogenetic origins, leading to varying degrees of reservoir space development and distribution characteristics of volcanic A-P layers (Table 10.1).
Table 10.1
Geological Characteristics of Volcanic A-P Layers, Barriers, and Interbeds
| Stratum Type | Lithofacies Type | Typical Subfacies | Typical Lithology | Reservoir Space |
| A-P layer | Effusive facies | Top, upper, and lower | Vesicular lava | Vesicles |
| Explosive facies | Hot clastic flow, fallout, and splash | (Welded) tuff and (welded) breccia | Intergranular pores | |
| Volcanic conduit facies | Volcanic neck and cryptoexplosive breccia | Vesicular lava and autoclastic brecciated lava | Vesicles and fractures | |
| Subvolcanic facies | Outer-zone and mesozone | Orthophyre and granite porphyry | Interstitial pores and dissolution pores | |
| Volcanic sedimentary facies | Xenoclast-bearing | Sedimentary volcanic breccia and sedimentary tuff | Intergranular pores | |
| Barriers and interbed | Effusive facies | Middle | Tight volcanic lava | Underdeveloped pores and fractures |
| Explosive facies | Hot base surge | Crystalline tuff | ||
| Volcanic conduit facies | Volcanic neck | Tight volcanic lava | ||
| Subvolcanic facies | Inner-zone and mesozone | Orthophyre and granite porphyry | ||
| Volcanic sedimentary facies | Coal-bearing tuff and retransported | Tuffaceous siltstone, tuffaceous mudstone and coal |
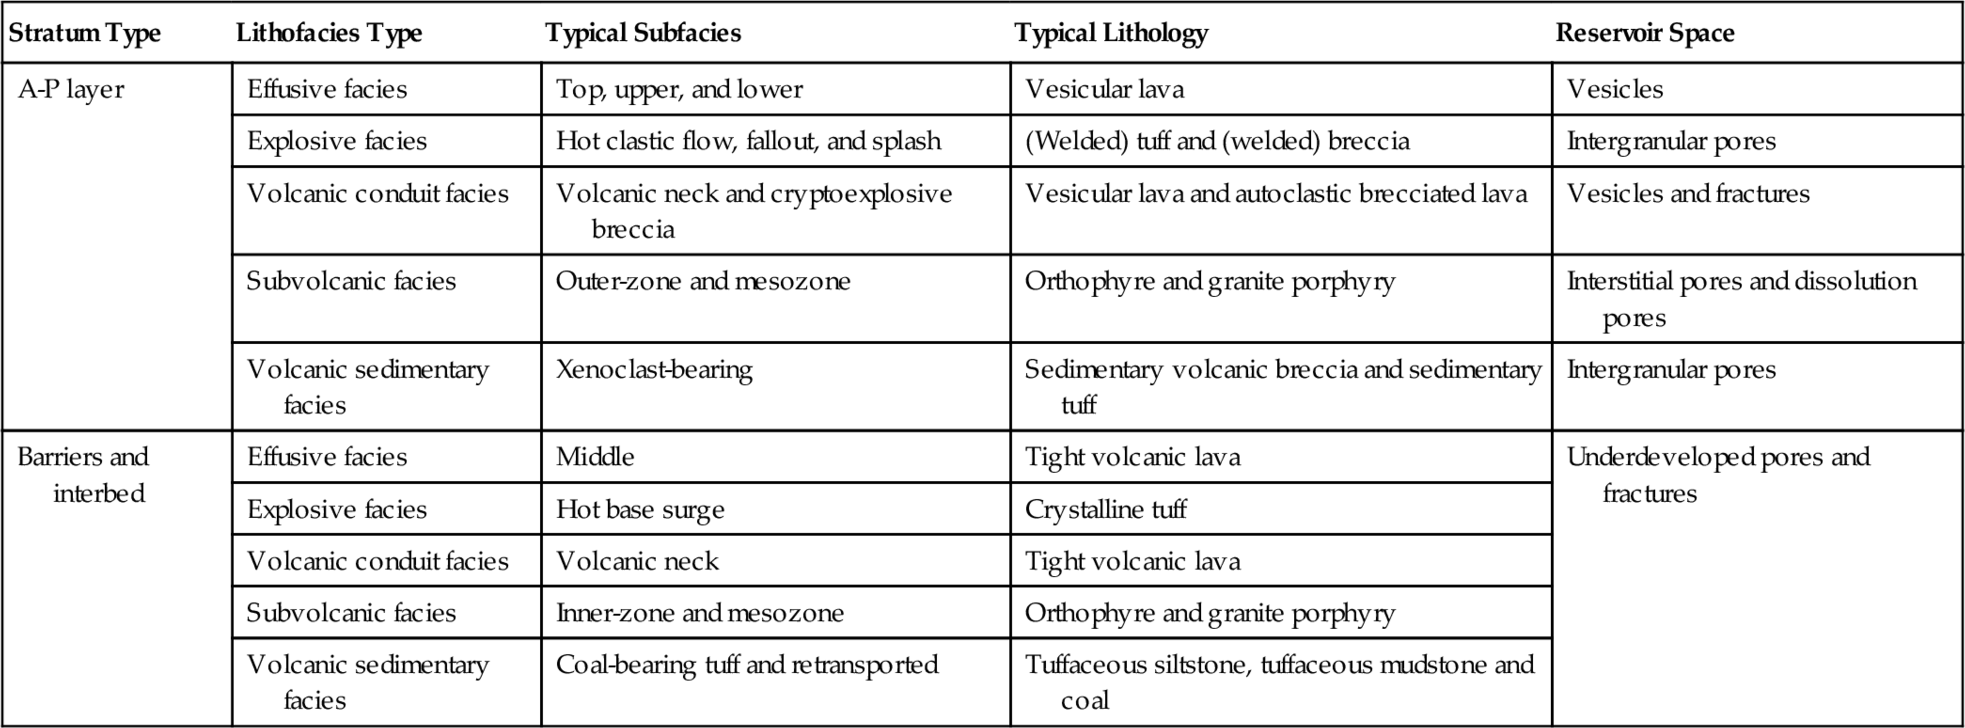
1. Effusive facies A-P unit. Vesicles are the primary reservoir space. A-P layers are developed predominantly in the top, upper, and lower subfacies, with vesicular lava being the main lithology. Barriers and interbeds are developed mainly in the middle subfacies, lithologically represented by tight volcanic lava.
2. Explosive facies A-P unit. Intergranular pores are the main reservoir space. A-P layers are mainly developed in the hot clastic flow, fallout, and the splash subfacies, represented by welded tuff and breccia, crystalline tuff, and volcanic breccia. Barriers and interbeds are mainly developed in the hot base surge subfacies, lithologically dominated by crystalline tuff.
3. Volcanic conduit facies A-P unit. Vesicles and fractures are the main reservoir space in volcanic rocks of the conduit facies. A-P layers are developed mainly in the volcanic neck and cryptoexplosive breccia subfacies, and the representative lithology is vesicular lava and autoclastic brecciated lava. Barriers and interbeds are developed mainly in the volcanic neck subfacies, lithologically typical of tight volcanic lava.
4. Subvolcanic facies A-P unit. Interstitial pores and dissolution pores are the primary reservoir space in volcanic rocks of subvolcanic facies. A-P layers are developed mainly in the inner-zone and mesozone subfacies, and the lithology is typically weathered and dissolution-affected orthophyre and granite porphyry. Barriers and interbeds are developed mainly in the inner-zone subfacies, and the representative lithology is tight orthophyre and granitic porphyry.
5. Volcanic sedimentary A-P unit. Intergranular pores are the primary reservoir space in volcanic sedimentary facies. A-P layers are developed mainly in the xenoclast-bearing subfacies, represented by sedimentary volcanic breccia and sedimentary tuff. Barriers and interbeds are developed mainly in the coal-bearing tuff and transported subfacies, dominated lithologically by tuffaceous siltstone, tuffaceous mudstone, and coal.
2) Identification markers of accumulation capacity
Accumulation capacity is used to assess the size of the effective reservoir space of an A-P unit and is related to the scale and petrophysical properties of the unit. In general, it is evaluated on the basis of effective porosity that reflects reservoir properties in wells. As a result, accumulation capacity is identified with the three-porosity curves of nuclear magnetic logging and conventional logging (Table 10.2).
Table 10.2
Identification Markers of the Accumulation Capacity of Volcanic A-P Layers, Barriers, and Interbeds
| Stratum Type | Rock Type | T2 Spectrogram of Nuclear Magnetic Logging | Conventional Logging | |||||
| Total Area of Irreducible Fluid Spectrum | Total Area of Mobile Fluid Spectrum | Density Logging | Acoustic Survey | Neutron Logging | Curve Shape | Smooth Level | ||
| A-P layer | Volcanic rock | Small | Large | Moderate | Moderate | Moderate | Box shape | Smooth to microserrated |
| Sedimentary volcanic rock | Large | Moderate | Moderate to low | Moderate to high | Moderate to high | Bell and funnel shape | Dentoid | |
| Barrier and interbed | Volcanic rock | Small | Small | High | Low | Low | Box shape | Microserrated to dentoid |
| Sedimentary volcanic rock | Large | Small | Low | High | High | Finger, bell and funnel shape | Serrated | |

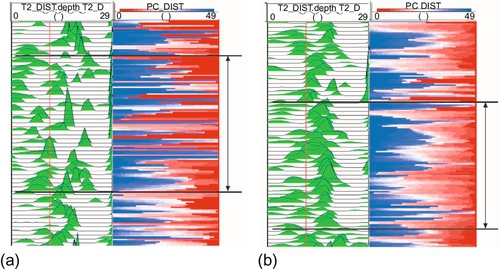
Identification markers in nuclear magnetic logging
In terms of its occurrences, fluid can be divided into mobile and irreducible types by the T2 spectrum of nuclear magnetic logging, defined by the T2 cutoff threshold (red line in Figure 10.2). The total area of mobile fluid spectrum reflects the accumulation capacity of the A-P unit. The larger the total area, the higher the effective porosity and effective accumulation capacity of the volcanic rock (see Figure 10.2). The T2 spectrum characteristics of nuclear magnetic logging vary with A-P layers, barriers, and interbeds (see Table 10.2). Volcanic rocks have a relatively small total area of irreducible fluid spectrum, volcanic A-P layers have a relatively large total area of mobile fluid spectrum, and volcanic barriers and interbeds have a relatively small total area of mobile fluid spectrum. Sedimentary volcanic rocks have a relatively large total area of irreducible fluid, sedimentary volcanic A-P layers have a moderate total area of mobile fluid, and sedimentary volcanic barriers and interbeds have a relatively small total area of mobile fluid spectrum.

Identification markers in conventional logging
The three-porosity curves can be used to reflect the accumulation capacity of volcanic rocks. Lithological separation results in various response characteristics of the three-porosity curves that reflect volcanic rocks and sedimentary volcanic rocks (see Table 10.2):
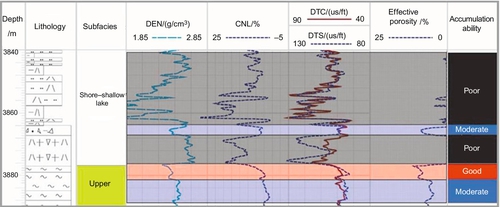
1. A-P layers. The amplitude values of density, interval transit time, and neutron porosity curves are moderate, and their curves commonly have a smooth to microdentoid box shape and a moderate to good accumulation capacity (Figure 10.3).

2. Volcanic barriers and interbeds. These components are characterized by high-amplitude density logging curves, low-amplitude interval transit time and neutron logging curves, and a microserrated to dentoid box shape, indicating poor accumulation capacity (see Figure 10.3).
3. Sedimentary volcanic A-P layers. These layers typically have moderate- to low-amplitude density logging curves, moderate- to high-amplitude interval transit time and neutron logging curves, and dentoid bell and funnel shapes, indicating moderate accumulation capacity (Figure 10.4).
4. Sedimentary volcanic barriers and interbeds. These components have the characteristics of low-amplitude density logging curves, moderate- to high-amplitude interval transit time and neutron logging curves, and dentoid to serrated digitate bell and funnel shapes, denoting poor accumulation capacity (see Figure 10.4).
3) Identification markers for permeation capacity
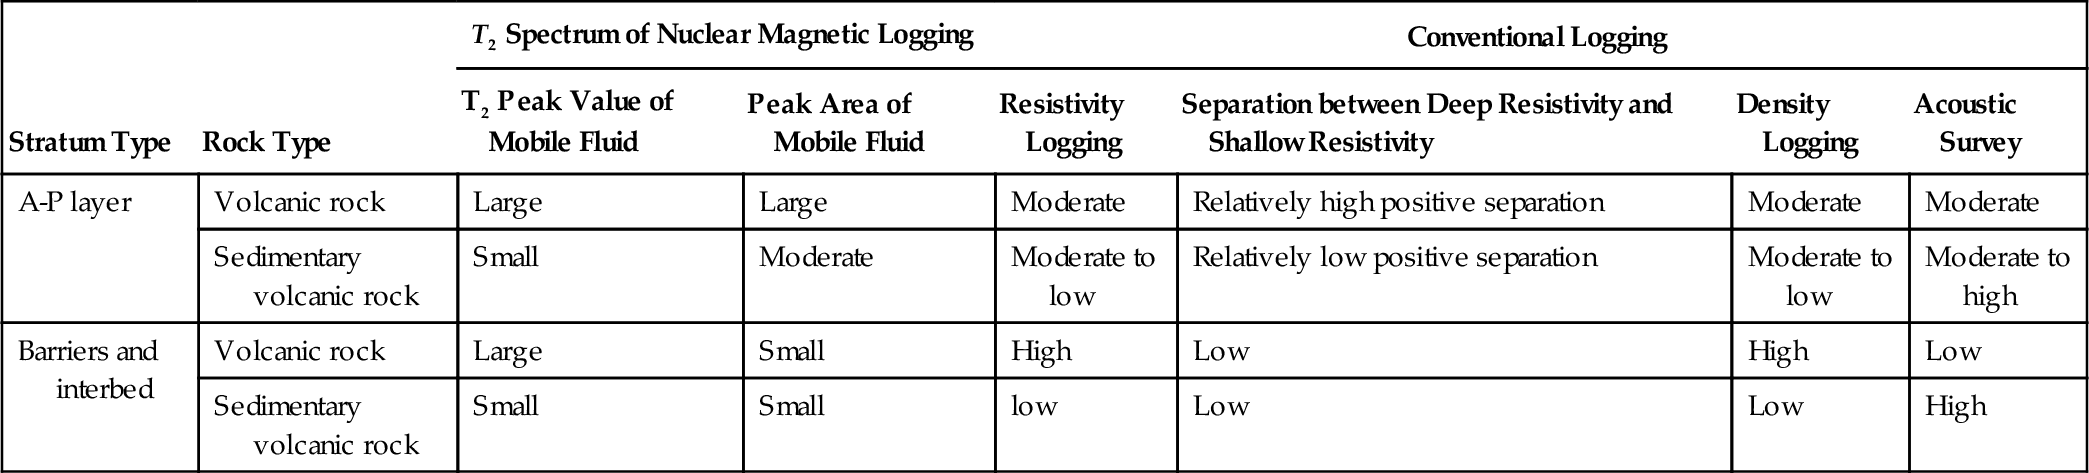
Permeation capacity is used to assess the capacity of fluid flow of an A-P unit, which is related to the degree of pore development, throat radius, and permeability. Generally, permeation capacity is evaluated on the basis of permeability parameters. Single-well permeation capacity is identified mainly through nuclear magnetic logging, three-porosity curves of conventional logging, and resistivity logging curves (Table 10.3).
Table 10.3
Identification Markers for the Permeation Capacity of Volcanic A-P Layers, Barriers, and Interbeds
| Stratum Type | Rock Type | T2 Spectrum of Nuclear Magnetic Logging | Conventional Logging | ||||
| T2 Peak Value of Mobile Fluid | Peak Area of Mobile Fluid | Resistivity Logging | Separation between Deep Resistivity and Shallow Resistivity | Density Logging | Acoustic Survey | ||
| A-P layer | Volcanic rock | Large | Large | Moderate | Relatively high positive separation | Moderate | Moderate |
| Sedimentary volcanic rock | Small | Moderate | Moderate to low | Relatively low positive separation | Moderate to low | Moderate to high | |
| Barriers and interbed | Volcanic rock | Large | Small | High | Low | High | Low |
| Sedimentary volcanic rock | Small | Small | low | Low | Low | High | |
Identification markers of nuclear magnetic logging
The permeation capacity of volcanic rocks is related to pore throat size, porosity, and fractures. The porous zones with various pore throats are distinguishable on the T2 spectrum in nuclear magnetic logging curves. A higher T2 peak value of the mobile fluid and larger area of the spectral peak indicate large-radius pores and therefore higher permeation capacity (Figure 10.5). As a result, the permeation capacity of volcanic rocks can be assessed by the T2 time distribution and the area of mobile fluid peak in the T2 spectrogram (see Table 10.3).
Volcanic formations have an extensive mobile fluid peak, and overall its T2 average value is higher than that of sedimentary volcanic rocks. The trap area of the mobile fluid peak is large for volcanic A-P layers and small for barriers and interbeds (see Table 10.3).
The T2 value of the mobile fluid peak of sedimentary volcanic rocks is generally smaller than that of volcanic rocks. The trap area of the mobile fluid peak is moderate for sedimentary volcanic A-P layers and small for barriers and interbeds (see Table 10.3).
Response characteristics of conventional logging
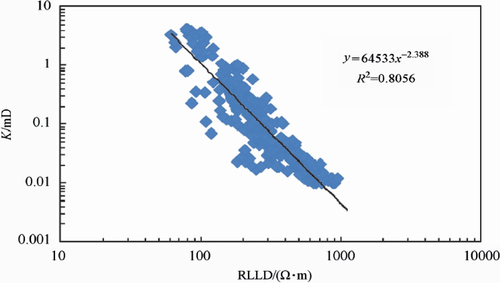
The electrical conductivity of rocks has a good correlation with its permeability (Figure 10.6). For conventional logging, beside the three-porosity logging curves, the resistivity curve is often used to reflect the permeation capacity of volcanic rocks. Similarly, the conventional logging response characteristics reflecting the permeation capacity of volcanic rocks and sedimentary volcanic rocks are highly variable due to the variety of lithologies (see Table 10.3):
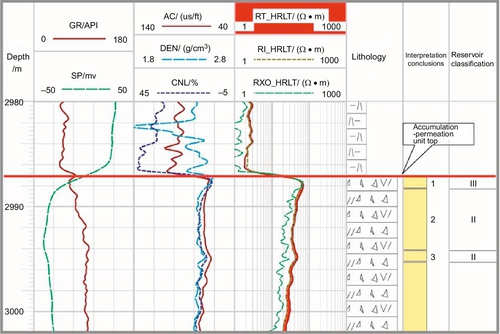
1. Volcanic A-P layer. Moderate-amplitude density, acoustic travel time, and resistivity logging curves and relatively large positive separation between deep and shallow laterolog resistivity curves (Figure 10.7)

2. Volcanic barrier and interbed: High-amplitude density logging curve, low-amplitude acoustic logging curve, and high-amplitude resistivity logging curve, as well as small separation between deep and shallow laterolog resistivity curves (see Figure 10.7)
3. Volcanic A-P layer. Moderate to low amplitude density logging curve, moderate to high amplitude acoustic travel time logging curve, and low-amplitude resistivity logging curve, as well as small separation between deep and shallow laterolog resistivity curves
4. Sedimentary volcanic barrier and interbed. Low-amplitude density logging curve, high-amplitude acoustic travel time logging curve, and low-amplitude resistivity logging curve, as well as small separation in the deep-shallow laterolog resistivity curve
2 Identification and division of A-P units in wells
A-P layers, barriers, and interbeds are identified using the identification markers of A-P units, static and dynamic data from single wells, and logging response analysis and reservoir parameter interpretation. Thereafter, the A-P units are classified and the interfaces or boundaries of A-P units are identified, which provide a foundation for profile identification.
1) Assessing A-P capacity and identifying A-P layers
The A-P capacity of a target reservoir can be qualitatively assessed on the basis of the identification markers of volcanic A-P layers, in combination with the identification of A-P units by lithology and lithofacies characteristics. This further facilitates the quantitative evaluation of the A-P capacity of a target reservoir through reservoir parameter interpretation and gas tests. And the identification results are verified by the cutoff criteria of effective reservoirs.
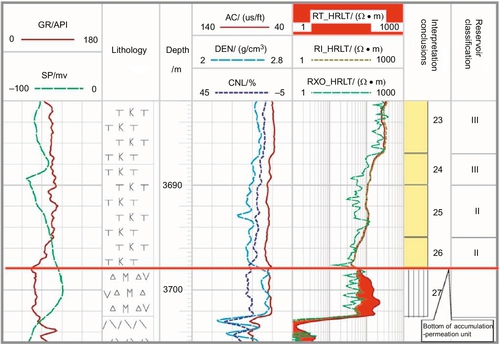
The left of Figure 10.8 is an example of the division and identification of A-P layers in Well XX9. The strata are classified, in descending order, into seven intervals.

The first interval (3520 to 3578 m) consists of sedimentary volcanic rock and volcanic rock characterized by low resistivity, low density, high interval transit time, and high neutron value. The logging curves are serrated-digitate in shape, with large amplitude of irreducible fluid peak and underdeveloped mobile fluid peak in a nuclear magnetic logging curve showing poor A-P capacity. As a result, the interval is assessed systematically as a non-accumulation-permeation (A-P) sedimentary volcanic layer. Its effective porosity is less than 1% and permeability is less than 0.1 mD, thus interpreted as a dry layer by logging characteristics.
The lithology of the second, fourth, and sixth intervals (green color) comprises rhyolite with moderate-amplitude resistivity, density, interval transit time, and neutron logging curves in microserrated box and bell shapes. The same development of irreducible fluid peak and mobile fluid peak in a nuclear magnetic logging curve suggests some A-P capacity for the intervals. As a result, the intervals are assessed systematically as effusive facies A-P layers. In logging interpretation, their porosity is 6%, 5.6%, and 5.8%, and permeability is 1.2 mD, 0.14 mD, and 0.33 mD, respectively. These values are higher than the cutoff of effective reservoirs in the XX gas field, strongly indicating that these intervals as gas layers.
The lithology of the third, fifth, and seventh intervals is rhyolite for the third and fifth intervals and dacite for the seventh interval; this is characterized by high resistivity, high density, low interval transit time, and low neutron value. The logging curves have a smooth box shape, locally serrated-digitate. The inferior development of irreducible fluid peak and underdeveloped mobile fluid peak in the nuclear magnetic log indicate poor A-P capacity for the intervals. As a result, systematic evaluation ranks them as effusive facies non-A-P layers. In logging interpretation, their porosity is 0.9%, 2.7%, and 2.3%, and permeability is 0.05 mD, 0.02 mD, and 0.01 mD, respectively. All of these values are below the cutoff for effective reservoirs, thus rendering them as dry layers.
The second and sixth intervals are perforated for gas tests. Natural production is low (0.0134 × 10⁴ m3/d), but the production reaches 20.9 × 10⁴ m3/d after hydraulic fracturing. As a result, these intervals are commercial gas layers, which verified their initial interpretation as A-P layers.
2) Tracing extension and distinguishing barriers and interbeds
Both barriers and interbeds are integral parts of A-P layers. Barriers usually have a large thickness and lateral extension, located between A-P units, and can obstruct fluid seepage. Interbeds have a small thickness and limited lateral extension, located within A-P layers, and can decrease fluid seeping. Barriers and interbeds are distinguishable based on their thickness features and the identification of A-P layers, through well-seismic calibration to track the horizontal extension of non-A-P layers in seismic profiles. This provides the basis for the division of A-P units.
In the case study of Well XX9 (see Figure 10.8), the lithology of non-A-P layers between the second, fourth, and sixth intervals is rhyolite. Due to the small thickness (about 12 m) and limited lateral extension, they cannot be identified and tracked in seismic profiles and are thus determined as interbeds with poor petrophysical properties. The first interval consists of sedimentary volcanic rock and volcanic-sedimentary rock with large thickness, which has unconformable contact with its underlying volcanic rock and is widespread in the XX gas field. As a result, the interval is determined as the cap rock of lower volcanic A-P units. The lithology of the seventh interval is dacite with a thickness of some 150 m, which appears with moderate-amplitude, low-frequency, and good-continuity reflection characteristics and a laminar-like reflection shape (on the right in Figure 10.8) and can be tracked in Well Block XX9. As a result, the interval is interpreted as a petrophysical property barrier.
3) Analyzing the relationship among cap rocks, reservoirs, and basal bed assemblage to divide A-P units
The classifications of A-P units delineation of the vertical distribution patterns of A-P units are conducted with reference to the classification scheme for carbonate reservoir units [14,15], using various static and dynamic data and taking into consideration the geological features of volcanic gas reservoirs.
Applying single-well static data to divide A-P units
A volcanic A-P unit comprises volcanic rocks of the same petrogenesis and has the assemblage characteristics of a cap rock, a basal bed, and reservoir in the middle. Therefore, the petrogenetic separation, the relative position of A-P layers, features of lower and upper barriers, and fault barriers are the key factors for classifying A-P units. In general, two adjacent A-P layers will be classified into discrete A-P units when they have the following characteristics: there is a great separation in rock composition, they are located in two disconnected structural units, they are separated by a thick barrier covering an entire volcanic edifice, or they have been isolated by a sealing fault barrier.
Two A-P layers in Well DD1001 are located within the same volcanic edifice (Figure 10.3b) and isolated by a set of sedimentary volcanic breccias with different rock compositions. The lithology of the upper layer is dacitic volcanic breccia, which is clearly from that of the lower layer comprised of andesitic volcanic breccia, thus separating the two A-P layers into different A-P units.
Using dynamic data to verify division results and determine vertical distribution modes of A-P units in wells
Fluid flow characteristics vary with A-P units. Based on the separation in produced fluid properties, the consistency of the water-gas relationship, and the relationship between the pressure system and production performance, the division results can be verified and the vertical distribution patterns of A-P units in single wells can be modified and improved. Comprehensive analyses of Well DD1001 show that the volcanic A-P unit is the similar to a carbonate reservoir unit (Figure 10.9a), characterized by the rock assemblage of an upper cap rock, middle reservoir, and lower basal bed.

4) Determining the interfaces of A-P units by comprehensive analyses
Based on the identification of A-P layers, barriers, and interbeds as well as the division results of A-P units in a single well, the type of interface between volcanic A-P units is determined through petrogenetic analysis, according to the established identification markers in single wells. This provides well point constraints for profile tracing.
The interfaces of volcanic A-P units are classified into lithological interface, petrophysical property interface, and sealing fault barrier in terms of their petrogenesis. Interface identification in single wells generally involves the former two types.
Identification of lithological interfaces
A lithological interface results from changes in petrophysical properties due to lithological variation, and can be subdivided into the following three varieties.
Abrupt interface between sedimentary and volcanic rocks
This type of interface is developed mainly in the basal rock units formed at the beginning of a volcanic eruption as well as the top rock units formed at the end of a volcanic eruption. In logging curves, the interface appears as a sudden change from sedimentary rocks with high interval transit time and neutron value and low density and resistivity to volcanic rocks with low interval transit time and neutron value and high density and resistivity (Figure 10.10).
This results from changes in petrophysical property due to lithofacies or environmental variation. In logging curves, the interface appears as a trending change. Figure 10.11 is a typical example of Well DD14, where the lower lithology is a brecciated tuff barrier and the upper lithology is a tuffaceous volcanic breccia A-P layer. The logging curves from the bottom up are characterized by intensified radioactivity, reduced density, increased interval transit time, and increased neutron value and resistivity.

This results from poorer petrophysical properties due to variations in the magma source and petrogenesis. For example, Well DD1824 penetrated mainly orthophyre and occasionally andesitic welded breccia and sedimentary tuff; the lithological interface is formed due to relatively poor petrophysical properties. Figure 10.12 shows that the lower part is an andesitic welded breccia barrier and the upper part is an orthophyre A-P layer. The logging curves show an upward increase in radioactivity, reduced density, increased interval transit time and neutron value, and decreased resistivity.
Identification of petrophysical property interfaces
This refers to an A-P interface between the same volcanic lithologies due to relatively poor petrophysical properties of the middle subfacies of effusive facies, which clearly defines the interface between the upper and middle subfacies and between the middle and lower subfacies of the effusive facies. Also, due to the relatively poor petrophysical properties of the hot base surge subfacies, this interface is easily delineated by the borders between the hot base surge subfacies of explosive facies and other subfacies. Similar to the poor petrophysical properties of the inner-zone subfacies of subvolcanic rocks, this interface is also easily defined between the mesozone and inner-zone subfacies of subvolcanic rocks.
Relatively speaking, volcanic A-P layers with good petrophysical properties have the characteristics of low density, high neutron value, high interval transit time, and moderate-low resistivity, and non- A-P layers with poor physical properties have the characteristics of high density, low neutron value and interval transit time, and moderate resistivity in logging curves. Based on the lithology identification, logging response characteristics are analyzed to identify the petrophysical property interface of A-P units. In Figure 10.13, the map with logging curves of Well DD1804 demonstrates that orthophyre has good petrophysical properties in the upper part and poor petrophysical properties in the lower part, with a petrophysical property interface located near depth 3645 m.

10.2.2 Profile identification
Multiwell profile analysis, seismic reflection profile identification, and inversion profile analysis are conducted based on single-well identifications to establish profile identification modes of volcanic A-P units. This provides the basis for 3D spatial prediction.
1 Identification of multiwell profiles
Identifying multiwell profiles is an effective approach for establishing the interwell distribution patterns of A-P units. In terms of the peculiarities of volcanic gas reservoirs, the principles for the interwell combination of volcanic A-P units are determined with reference to the flow–reservoir unit correlation methods [9–17] used in clastic and carbonate rocks. Constrained by the principles of interwell combination and volcanic internal architecture, various static data are used to establish multiwell profiles and identify A-P units, and dynamic data are used to verify the results. The establishment of profile identification models for A-P units provides the basis for seismic profile identification.
1) Interwell combination principles
Volcanic A-P units have complex distribution patterns and multiple interwell combination modes, controlled by various mechanisms, such as modes of eruption, structures, and diagenetic processes. The principles and approaches for interwell combination and the correlation of A-P units are determined by taking into consideration the rock architecture, lithology and lithofacies, fault distribution, reservoir space type, and petrophysical characteristics of volcanic rocks:
1. Establishing the framework model of rock architectural units as well as framework constraints for the identification of A-P units based on the architectural dissection of volcanic rocks
2. Assessing fault sealing properties to provide a fault control basis for interwell combination of A-P units
3. Establishing a standard profile, dividing single-well profile, and dividing single-well A-P units by plotting the classified single-well A-P units on standard profile in the same scale
4. Connecting boundary lines of volcanic edifices, eruption cycle and period, lithology and lithofacies, and A-P units, following the approach of level-by-level control from large to small, with reference to the combination relationships between faults and associated A-P units
5. Analyzing the connectivity of A-P layers, and verifying and amending the rationality of the interwell combination mode of A-P units based on produced fluid properties, the pressure system, and the production performance of the pay zone
2) Multiwell profile identification
Based on the principles of interwell combination, the integrated multiwell profile identification methods using geological, logging, and production performance data are developed in combination with various static and dynamic data, and the interwell distribution mode of A-P units is also determined. The process is illustrated using Well DD10 as an example.
Dissecting volcanic rock architecture and establishing a constraint framework for the interwell combination of A-P units
The volcanic edifice in Well Block DD10 is cone shaped as a result of three stages of eruption from a single volcanic crater, and volcanic strata of the second and third stages are absent from the topographic highs (Well DD10) due to denudation.
The constraint framework of the interwell combination of A-P units is established (Figure 10.14) according to the results of architectural dissection and sequence division: the black lines on the top and at the bottom are the upper and lower boundaries of volcanic eruption cycles, and red lines in the middle denote the boundaries between various eruption stages of the cycles. There is no fault developed between wells.

Establishing a standard profile and dividing A-P units in single wells
Based on drilling results, the DD104–DD1001–DD10–DD102 multiwell profile from southwest to northeast is selected as the standard profile (see Figure 10.14).
Based on the interpretation results of single-well A-P layers, barriers, and interbeds, the third-stage cycle is classified into four A-P units, each of which comprises an assemblage upper cap rock and lower basal bed, with reservoir in the middle, including two gas-bearing units encountered by Well DD1001 and two water-bearing units encountered by Wells DD102 and DD104, respectively. The second-stage cycle is divided into four water-bearing A-P units (two units encountered by Wells DD102 and DD104, respectively). The first-stage cycle is divided into seven A-P units, including two gas-bearing units encountered by Well DD10 and five water-bearing units encountered by Well DD104.
Interwell combination
Following the division of single-well A-P units for well points, the interwell A-P units are combined and correlated within the framework of volcanic architectural units, constrained by seismic reflection characteristics and faults for interwell blocks, and created using the approach of level-by-level control from large to small, so as to establish the profile distribution model of A-P units in volcanic the gas reservoir of Well Block DD10 (see Figure 10.14).
3) Verification by dynamic data
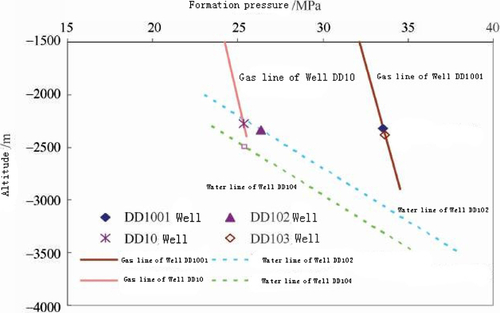
Well DD10 is about 1000 m away from Well DD1001, and their major gas layers have obviously different rock compositions and lithology. In Well DD10, the lithology of two gas-tested intervals is rhyolitic welded tuff and dacitic welded breccia, respectively, and in Well DD1001, the lithology of gas-tested intervals is andesitic volcanic breccia.
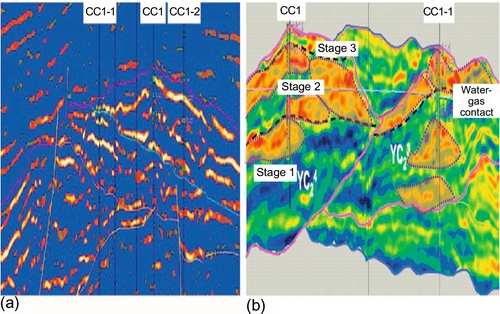
Pressure test results show that the three gas-tested intervals belong to different pressure systems (Figure 10.15). During the early production stage, gas production accounts for 76.2% in Well DD1001, but 23.8% in Well DD10, of total gas production in this area. Compared to the relatively steady production of Well DD1001, Well DD10 has unsteady output after beginning production. The wellhead tubing pressure of Well DD10 declined from 18.5 MPa to 12.2 MPa, and daily gas production decreased from 6 × 10⁴ m3/d to 2.2 × 10⁴ m3/d within two months. Considering their quite different production performances, the three intervals are primarily interpreted as disconnected.
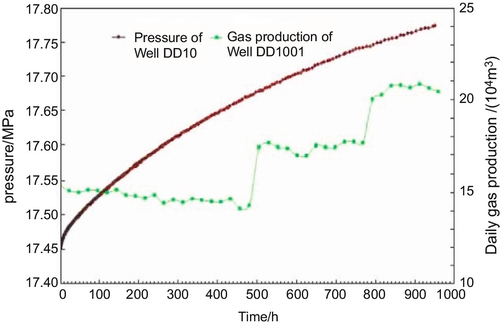
Furthermore, an interference well test is conducted between Wells DD10 and DD1001 to determine the connectivity of A-P units. Based on the pressure–rate history curves (Figure 10.16), no active signal of Well DD1001 is received from observation Well DD10 during the test, which indicates that the producing intervals in the wells connected poorly or disconnected. This verifies that there are multiple discrete A-P units in Well Block DD10.
2 Identification of seismic reflection profiles
Based on the identification of multiwell profiles, the profile distribution features of A-P units in volcanic rocks are clarified by analyzing the combined well-seismic calibration and response characteristics of near-wellbore seismic traces, establishing identification models for various types of A-P units, and conducting profile identification and interface tracing. This provides a basis for spatial prediction.
1) Identification model
The A-P units of volcanic gas reservoirs are classified into four types in terms of the lithofacies types and characteristics. Each type of A-P unit has its own seismic reflection characteristics and configurations.
Volcanic conduit facies A-P units
The volcanic conduit facies occurs in the lower part of a volcanic edifice, in which interclast pores and internal primary pores, dissolution pores, blast fractures, contraction fractures, and columnar joint fractures are primary reservoir spaces, with good petrophysical properties. In the seismic profile (Figure 10.17), this type of A-P unit appears as umbrella- or cloud-shaped reflections with weak amplitude, high frequency, and poor continuity. Better-developed A-P units are correlated with weaker amplitude, higher frequency, and poorer continuity of the seismic reflection wave.
Explosive facies A-P units
The explosive facies mostly forms at the early stage of a volcanic eruption, in which intergranular pores, intragranular primary pores, dissolution pores, interbedded fractures, intergravel fractures, and structural fractures are primary reservoir spaces, with moderate petrophysical properties. In the seismic profile (Figure 10.18), this type of A-P unit mostly appears as a mound and shows chaotic reflections. Better-developed A-P units are represented by weaker amplitude of the seismic reflection wave. In general, discontinuous, traceable, and relatively strong reflections represent the interfaces between an A-P layer and an external flow resistance zone.
Effusive facies A-P units
The effusive facies usually forms during the middle-late stage of a volcanic eruption, in which primary pores, dissolution pores, cooling contraction fractures, and structural fractures are primary reservoir spaces and the upper and lower subfacies have relatively good petrophysical properties. In the seismic profile (Figure 10.19), this type of A-P unit mostly appears as laminoid reflections with good continuity. In the zone where A-P layers are developed, the seismic reflection has a weaker amplitude and lower frequency. If the effusive facies A-P layers are in direct contact with sedimentary rocks, a locally continuous strong reflection may occur.

Subvolcanic facies A-P units
Subvolcanic rocks are usually formed at the late stage of a volcanic eruption; they have the same source as volcanic rocks, but with intrusive occurrence, in which interstitial pores, dissolution pores, cooling contraction fractures, and structural fractures are primary reservoir spaces with relatively poor petrophysical properties. In the seismic profile (Figure 10.20), subvolcanic rocks mostly appear in an irregular massive shape and are marked by chaotic internal reflections. In the zone with A-P layers developed, the seismic reflection has a relatively weak amplitude, low frequency, and slightly better continuity. Discontinuous and traceable strong reflections usually represent the interfaces between an A-P layer and a flow resistance zone.

It is difficult to identify the A-P units directly with seismic profiles. The seismic responses presented here can provide the basis for a qualitative identification of A-P units by integrating seismic profiles with geological models.
2) Interface tracing of A-P units
Based on single-well calibration, several typical interfaces of A-P units can be traced using the identification models as a guide.
Identifiability varies with lithological interfaces. In seismic profiles, an abrupt interface from sedimentary rock to volcanic rock appears as a strong reflection of unconformity surface and is easily recognizable (Figure 10.21a); a lithofacies interface appears as a moderate reflection peak and is locally traceable (Figure 10.21b); a lithological interface resulting from variations in rock composition or grain size appears as a relatively strong reflection peak and is locally discontinuous and traceable (Figure 10.21c).

The traceability of a petrophysical property interface varies with interface types but is generally poor. An effusive facies petrophysical property interface appears as laminar reflections with relatively strong amplitudes, and locally it has a relatively good traceability (Figure 10.21c). An explosive facies petrophysical property interface appears as chaotic reflections with moderate amplitude, and its traceability is relatively poor. A subvolcanic facies petrophysical property interface appears as chaotic reflections with moderate-poor amplitudes, and it may be locally traceable (Figure 10.21d).
3 Identification of inversion profiles
Based on the volcanic body-controlling seismic inversion, the inverted data volumes of wave impedance and reservoir parameters are used to remove nonreservoirs in the inversion profile and to characterize profile distribution patterns of various types of A-P units based on the seismic cutoff for effective reservoirs.
For the effective reservoir in the CC gas field, the cutoff threshold for porosity is 3.5%, wave impedance ranges from 9500 to 14500 (g/cm3) · (m/s), and density is 2.2 to 2.57 g/cm3. On this basis, the data volume of wave impedance and density derived from “body-controlling” seismic inversion are applied to obtain the profile distribution of A-P units (yellow color) by changing the color of data points of the non-A-P layer as background color (blue). Figure 10.22 shows that the effusive facies A-P units mostly have a striped distribution, whereas the explosive facies A-P units mostly have an irregular subcircular distribution along the flow direction of magma.
10.2.3 Prediction of planar distribution
The prediction methods involve seismic attribute analysis and seismic inversion data analysis.
1 Seismic attribute analysis method
The useful seismic attributes are extracted to predict the planar distribution of A-P units through optimized combination analysis, according to the geological characteristics of volcanic gas reservoirs as well as the analysis of sensitive attributes of A-P layers (Figure 10.23).
1) Sensitive attributes analysis for A-P layers
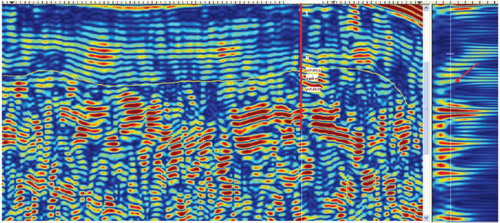
Both theoretical and experimental studies show that high-frequency components are strongly absorbed when a seismic wave passes through a gas-bearing reservoir. As a result, the seismic wave of effective A-P layers is generally characterized by low energy for high-frequency amplitude and high energy for low-frequency amplitude. The case study in the DD gas reservoir shows that in the frequency acquisition of seismic trace near Well DD18, there is as an obvious trend of change from high frequency to low frequency corresponding to the transition from nonreservoir sedimentary rocks to an orthophyre gas layer (from top to bottom). According to the stratum spectral analysis of a gas-bearing property, the wavelet spectrum is marked by the phenomenon of enhancement of low frequency and attenuation of high frequency. As a result, amplitude, frequency, and attenuation are the most sensitive seismic attributes for identifying A-P units of a volcanic gas reservoir.
2) Seismic attribute extraction
The method of seismic attribute extraction involves time slice, horizon slice, and interlayer attribute extraction. The extraction targets include 2D profile and 3D data volume [18]. Both horizon slice and interlayer attribute extraction can be used to predict planar distribution.
Considering that seismic waves for volcanic A-P units have different energy levels for high-frequency and low-frequency components, the horizon slice method is used to extract high-frequency and low-frequency amplitude attributes (Figure 10.24) based on the frequency division processing of seismic data. This will render effective A-P layers as weak amplitude for high-frequency components (20 Hz) (blue area in Figure 10.24a) and relatively strong amplitude for low-frequency components (12 Hz) (red area in Figure 10.24b).

3) Optimization and combination of seismic attributes
If individual seismic attributes have a poor correlation with reservoirs, the combination and optimization of multiple attributes can be used to reduce the prediction uncertainty of the planar distribution of A-P units.
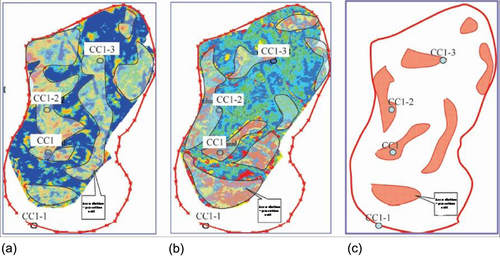
The stratum absorption coefficient obtained by calculating the change rate of wavelet spectrums can better reflect the characteristics of effective A-P layers (Figure 10.25a), although the seismic reflection frequency is related to stratum thickness, reservoir petrophysical properties, and oil-bearing properties. In general, seismic reflection signals are highly irregular. If the seismic trace is considered a random time series, the phase space reconstruction method can be used to measure its fractal dimension and obtain a correlation dimension parameter that directly reflects hydrocarbon distribution (Figure 10.25b). The analysis of the No. 1 volcanic massif in the CC gas reservoir shows that the correlation between the absorption coefficient/correlation dimension attribute and the natural gas distribution can exceed 70%.
Predicting the planar distribution of A-P units using integrated attribute analysis
A seismic attribute or attribute combination is characterized by multiple solutions under the influence of various factors. The method of integrated attribute analysis is effective for reducing the number of solutions and the uncertainty of prediction. The method is summarized as follows:
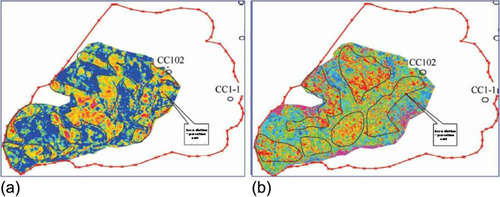
1. Applying single attribute to predict the possible planar distribution of A-P units (Figures 10.26a and 10.26b) based on the characteristics of individual seismic attributes or attribute combination, in combination with the analysis of static and dynamic data from the study area
2. Superposing the prediction results of all sensitive attributes and determining the confidence level for the distribution area of A-P units by superposition times (Figure 10.26c)
3. Performing a comprehensive analysis of static and dynamic data from the study area, and effectively predicting the most likely planar distribution of A-P units under the guidance of geological rules (Figure 10.26c)
2 Seismic inversion prediction method
Based on the body-controlling seismic inversion and seismic cutoff thresholds of effective A-P layers, the planar distribution of reservoir-permeation units in a volcanic gas reservoir is predicted using reservoir parameter volumes such as wave impedance, sound wave, density, and porosity:
1. Determining the extent of the planar distribution of A-P units in the main body of target strata in accordance with the planar distribution of reservoir parameters for different horizon slices
2. Extracting the average value of reservoir parameters within an appropriate time window based on the top structure of the target stratum (time domain) and determining the extent of the planar distribution of A-P units according to their planar distribution characteristics (Figure 10.27a)

3. Calculating the thickness value of an effective A-P layer for each point and determining the planar distribution range of an A-P unit under the constraints of top and bottom boundaries of target strata (Figure 10.27b)
10.2.4 Prediction of spatial distribution
Based on the assessment of single-well, profile, and planar distribution patterns, the following three methods are used to predict the spatial distribution of A-P units.
1 Tracing-and-closure techniques for A-P unit interfaces based on framework profiles
Based on the identification of seismic reflection profiles and the established framework profile network that effectively controls the study area, the A-P unit interface is traced and closed under the architectural constraint of the volcanic edifice in order to predict the 3D spatial distribution characteristics of A-P units.
2 3D attribute volume assemblage technique
This technique involves the following four steps: (1) establishing the seismic attribute division criteria of A-P units by sensitivity analysis, (2) extracting the sensitive attributes from 3D space using the data volume attribute extraction technology, (3) extracting the possible data points of A-P units according to division criteria and combining the data points based on their spatial positions, and (4) predicting the spatial distribution of A-P units by superposing and optimizing the various attribute prediction results.
3 Spatial combination technique based on inverted seismic data volume
Based on the cutoff thresholds of effective A-P layers, the possible data points of A-P units are extracted and then combined in terms of their special locations, using the inverted 3D seismic volume. On this basis, the spatial distribution of A-P units can be predicted by superposing and optimizing various inverted data volumes.
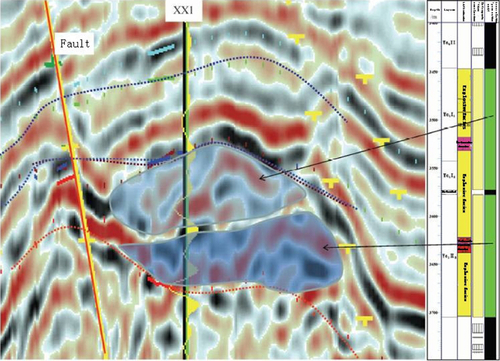
Figure 10.28 shows the 3D spatial distribution of A-P units in Well Block XX1 and demonstrates that the volcanic A-P units in 3D space are characterized by various shapes, scattered distribution, and diverse scales.

10.3 Characterization of accumulation-permeation units
Based on the identification of accumulation-permeation (A-P) units, the geometry, connectivity, and A-P capacity of volcanic A-P units are characterized on the basis of outcrop, seismic, and dense well pattern data; accordingly, the distribution of A-P units is revealed.
10.3.1 Characterization of geometry and scale
1 Using outcrop data to characterize the geometry and scale of A-P units
Field outcrops are one of the most important means for establishing a geological prototype model for subsurface reservoirs. When an outcrop is present near the target stratum, a field outcrop survey is the most accurate and reliable method [19] for characterizing the geometry and scale of A-P units. The main procedures include the following steps.
1) Selecting the survey location
Based on the geological survey and regional geological analysis, a survey location is selected where an outcrop of the target stratum is available [20]. Interval 1 of the Yingcheng Formation is one of major gas-bearing layers in the volcanic gas reservoir of the Songliao basin. Geological surveys show that this set of volcanic strata crops out in the Jiutai area of Jilin Province. After a field survey, the Guanma Mountain-Tuanjie village area with good field exposures is selected for a detailed field outcrop survey (identified by the blue dashed line in Figure 10.29).

2) Plotting the surveyed geological profile and establishing an architectural model of volcanic edifice
Nine trench faces (1735 m) are surveyed by arranging exploratory trenches in the survey area. Based on the 20 selected samples for chemical analysis, 588 field photographs, 191 rock thin sections, and 725 micrographs, as well as the contact relationships observed from the exposed volcanic strata, the surveyed geological profile (Figure 10.30) is plotted and a geological model reflecting the architectural characteristics of the volcanic edifice is established for the target strata (Figure 10.31).

3) Obtaining drill core and dividing A-P units in a borehole
One cored well (Well Ying-D1) is drilled in a key location (i.e., the center of flank) of the volcanic edifice. Based on the lithological and lithofacies analyses as well as porosity-permeability measurement, the A-P units are classified and divided in a borehole according to the principle of upper cap rock, middle reservoir, and lower basal bed (Figure 10.32).

4) Ascertaining distribution characteristics and establishing distribution models of A-P units
Under the architectural constraints of the volcanic edifice, the spatial distribution of A-P units is predicted and the distribution modes of A-P units for this type of volcanic edifice is established on the basis of the division of A-P units in boreholes, exploratory trench measurement, and field survey of geological profiles (Figure 10.33).

5) Characterizing the shape and scale of A-P units
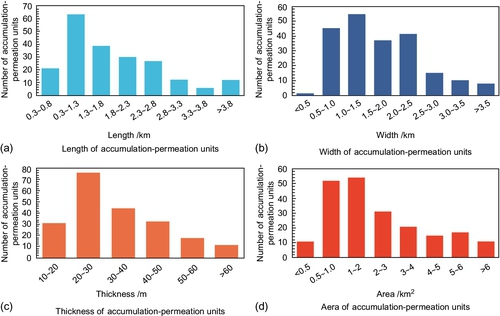
Outcrop survey results show that most effusive facies A-P units are bedded, explosive facies A-P units lenticular, and A-P units in mixed facies irregular. In volcanic gas reservoirs, most A-P units are 0.2 to 1.7 km long, 0.1 to 1.4 km wide, and 10 to 50 m thick, covering an area of 0.1 to 0.9 km2, with different scales and poor continuity (Figure 10.34).

2 Using seismic data to characterize the shape and scale of A-P units
Guided by the geological models derived from outcrops, the shape, geometry parameters, and scale of A-P units in volcanic gas reservoirs can be effectively characterized through by identifying seismic profiles, as well as their planar and spatial prediction.
1) Geometry of A-P units
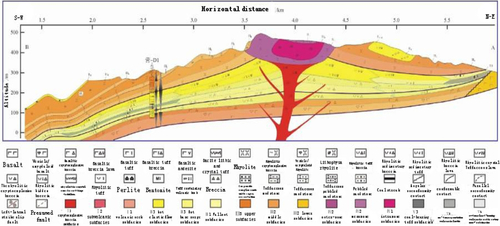
In profiles, A-P units in near-crater explosive facies commonly have a massive structure with large thickness and small extension; and A-P units in off-crater effusive facies are mainly bedded, with small thickness and large extension (Figure 10.35).

In plan view, volcanic A-P units have three distribution shapes (Figure 10.36): (1) a potato-shaped A-P unit, developed in explosive facies of isolated volcanic edifice, with a small amount of erupted magma and small scale; (2) a striped A-P unit, developed in effusive facies and controlled by palaeotopography, with a large planar distribution; and (3) a sheetlike A-P unit, common in both explosive and effusive facies, formed from the superposition of A-P units of multiple volcanic edifices, and relatively large in scale.

2) Geometric parameters and scale of a-p units
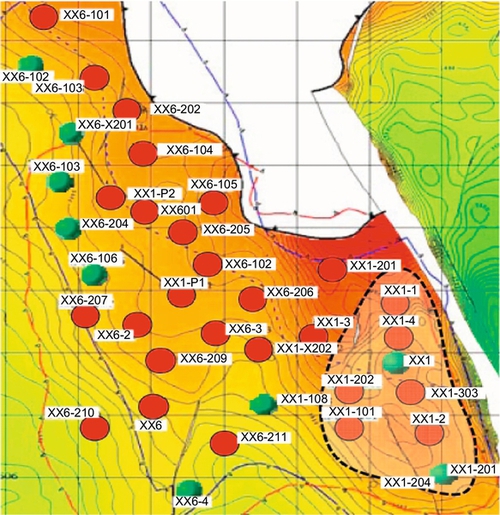
As is shown by the CC gas field example (Figure 10.37), most volcanic A-P units have a discrete distribution in the gas field. Their lateral extension radius is 300 to 2100 m, with an average of 537 m, and their thickness is 9 to 124 m with an average of 20 m. As a result, they have drastically different vertical and horizontal scales.
A-P units have different scales for various lithofacies. Explosive facies A-P units are mostly 15 to 100 m thick and 200 to 800 m wide, whereas effusive facies A-P units are mostly 5 to 45 m thick and 400 to 1000 m wide.
3 Using dense well pattern data to characterize geometric parameters and scale of A-P units
A dense well area has closely spaced wells and abundant static and dynamic data; therefore, the application of dense well pattern data is one of the most effective and direct methods to dissect subsurface volcanic architecture and to characterize the shape and scale of A-P units. The main procedures are as follows.
1) Dividing A-P units in wells
In terms of the identification markers of A-P units, coring, logging, testing, and production performance data are integrated to identify A-P layers, barriers, and interbeds and to divide A-P units in wells.
2) Establishing profile distribution models of A-P units
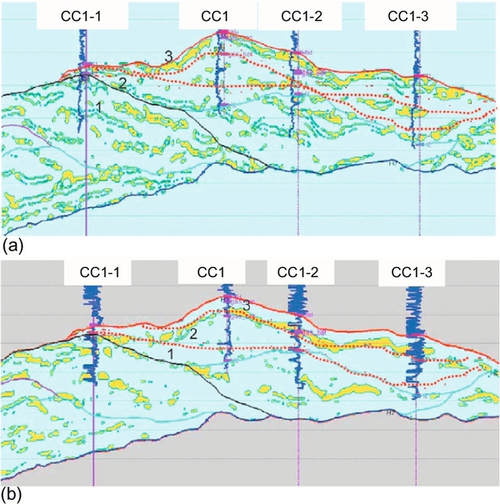
The typical cross-well skeleton or framework profile is plotted for the dense well grid area (Figure 10.38). The profile distribution model of A-P units is established through the identification of multiwell profiles and interwell combination of A-P units, taking into consideration the influences of faults, water-gas relationships, and pressure systems along with the constraints of volcanic architecture (Figure 10.39).

3) Predicting spatial distribution and characterizing A-P unit shape and scale
The spatial distribution of A-P units is predicted through the combination of techniques of A-P unit interface tracing, 3D attribute volume spatial assemblage, and seismic inversion data volume spatial assemblage. It provides a foundation for characterizing the shape and scale A-P units.
Research results show that most A-P units in the dense well area are lenticular or lamellar, bounded by lithofacies, subfacies, or petrophysical properties. They are 0.5 to 2.8 km long, 0.3 to 2.5 km wide, and 10 to 50 m thick, covering an area of 0.4 to 3 km2 with highly variable scales (Figure 10.40).
10.3.2 Connectivity characterization
The connectivity between A-P units is characterized by the scale of connected rock bodies and determined using various static and dynamic data, based on the interpreted superposition relationships and connection modes of A-P units. This provides a basis for the characterization of A-P capacity.
1 Connection types of A-P units
Based on the analysis of superposition relationships and connection modes, the connections between A-P units are subdivided into various types as a framework for characterizing their connectivity.
1) Superposition relationships
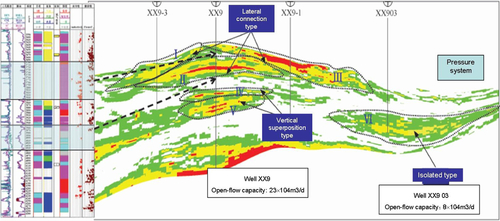
According to their locations, A-P units are classified into three types: vertical superposition, lateral connection, and isolated types (Figure 10.41). Vertical superposition mainly occurs between A-P units of two adjacent volcanic massifs (or stages or lithofacies) within the same volcanic edifice; lateral connection is found mainly between two volcanic edifices or volcanic massifs with lateral superposition; the isolated type, with a lenticular morphology, occurs within a discrete volcanic edifice or in a relatively independent volcanic massif within a volcanic edifice.
2) Connection modes
A-P units are connected by open fractures, structural fractures, large columnar joint fractures, and multifracture network passages. Among them, open fractures have the longest connection distance, multifracture network passages rank second, and the columnar joint has the shortest connection distance, limited within a single volcanic edifice.
3) Connection types
In accordance with the general classification principle of “superposition relationships + connection modes,” the connections of A-P units are classified into 10 types, including vertical-superposition opening fracture connection type, lateral-superposition structural fracture connection type, isolated multifracture network passage, and so on. Among them, some assemblages only occur in specific settings. For example, the isolated columnar joint fracture connection type only forms among A-P units of two independent volcanic massifs within a volcanic edifice.
2 Connectivity characterization of A-P units
Based on the superposition relationships of A-P units, the connectivity of A-P units is characterized by analyzing the fault and fracture characteristics, water-gas relationships, fluid properties, and pressure systems. In the example from Well Block XX9, a total of six A-P units (Nos. I-VI) are identified in the XX9-3-XX9-XX9-1-XX903 multiwell profile (see Figure 10.41). Among them, Nos. I to III, No. IV to V, and Nos. VI A to P are developed in three separate volcanic massifs, respectively.
1. Superposition relationship: Based on their locations (Table 10.4), there is lateral superposition between Nos. I and II, and between Nos. II and III A-P units, vertical superposition between No. IV and V A-P units, and isolated type for the No. VI A-P unit.
Table 10.4
Analysis of Connection Elements of A-P units in Well Block XX9
| Number of A-P Units | Superposition Relationship | Fault Communication Characteristics | Fracture Communication | Water-Gas Contact (M) | Fluid Properties | Pressure System | Production Performance | |
| Salinity (ppm) | CO2 Content (%) | |||||||
| III | Lateral connection | Multifracture network passage | − 3600 | Scattered distribution, no obvious trend, pressure lower in basal aquifer in Well XX9 than in upper gas layer | Production of No. I to III A-P units is associated with their pressure | |||
| I | Fault connection | |||||||
| II | Microfracture underdeveloped | 9105 | 5.1 | |||||
| IV | Vertical superposition | − 3913.5 | 7501 | 8.1 | ||||
| V | 10625 | 9.4 | ||||||
| VI | Isolated type | − 3704 | ||||||

2. Fault communication characteristics. Detailed structural interpretation results show that a small open fault exists between No. I and II A-P units. As a result, it is very likely that the units are connected.
3. Fracture communication characteristics. Logging interpretation results show that structural fractures and microfractures are developed between No. II and No. I/III A-P units, suggesting the presence of a multifracture network passage; fractures are relatively well developed between No. IV and V A-P units; but only a small quantity of microfractures are present between No. II and IV, insufficient to form a vertical connection passage.
4. Water-gas relationship. No. I–III A-P units have the same water-gas contact (− 3600 m), and No. IV–V A-P units also have the same water-gas contact (− 3913 m). The no. VI A-P unit is an independent water-gas system with water-gas contact at − 3704 m. The large differences in the three water-gas contacts indicate that these units are disconnected.
5. Fluid properties. Formation water salinity and CO2 content in the three gas-water systems are significantly different (see Table 10.4), indicating that these systems are independent.
6. Pressure system. Scattered pressure data have no obvious trend for the six A-P units, and the pressure of the lower aquifer is lower than that of upper gas layer in Well XX9, corroborating that the upper and lower A-P units are disconnected.
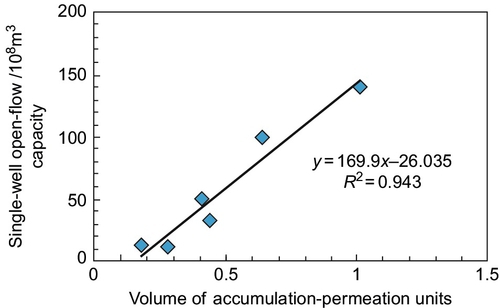
7. Production performance characteristics. Pilot production was carried out in No. I–III A-P units in Wells XX9-3, XX9, and XX9-1, respectively. A gas test was carried out on the No. IV A-P unit in Well XX903. Pilot production and gas test results show that Well XX9-3 belongs to the type I gas well with high open-flow potential and steady production and pressure; Wells XX9 and XX9-1 belong to type IV gas well with low open-flow potential and sharp decrease in production and pressure; the production of these three wells is associated with their pressure. The low open-flow potential, rapid depletion in output and pressure when tested with large-diameter choke (12 mm), as well as slow pressure build-up after well shut-in, strongly suggest that the gas production and pressure of Well XX903 are not associated with the other three wells. This further supports the interpretation that No. I–III A-P units are connected with one other, wheteas No. VI is independent.
In summary, among the six A-P units in the study area, No. I–III A-P units belong to horizontal superposition and form a large connected body by multifracture network passages; No. IV–V A-P units are vertically stacked and form a relatively large connected body by structural fractures; and No. VI A-P unit is an independent system and forms a relatively small, independent, internally connected body.
10.3.3 Characterization of accumulation-permeation (A-P) capacity
The accumulation and permeation capacity of volcanic A-P units is quantitatively characterized in terms of scale, reservoir spaces, pore structure, petrophysical property, interbeds, and production performance, based on the classification scheme of A-P units and various selected characterization parameters. This forms a basis for preparing appropriate development technology policies. The process is discussed next using the XX gas field as an example.
1 Classification of A-P units
Based on production performance characteristics, the A-P units in volcanic gas reservoir are classified into four types (Table 10.5).
Table 10.5
Classification of A-P Units in Volcanic Gas Reservoirs (XX Gas Field)
| Type | Lithology/Lithofacies | Scale | Characteristics of Reservoir Space and Pore Structure | Petrophysical Property Characteristics | Interbed Characteristics | Production Performance Characteristics | ||||||||||
| Lithology | Lithofacies | Net Pay Thickness (m) | Area (m) | Type of Reservoir Space | Pore and Fracture Assemblage | Average Throat Radius (μm) | Displacement Pressure (MPa) | Reservoir Type | Porosity (%) | Permeability (mD) | Density (m/100 m) | Frequency (layers/100 m) | Well-Controlled Reserves (108 m3) | Deliverability Characteristics | Stable Production Capacity | |
| I | Volcanic conduit facies | Vesicular rhyolite and autoclastic brecciated lava | > 30 | > 2 | Vesicles, blast fractures, and structural fractures | Fracture-vesicle type, and fracture type | > 0.3 | < 2 | Type I | > 10 | > 1 | < 10 | < 2 | > 5 | High natural flow rate, and high deliverability after hydraulic fracturing | Strong |
| Splash subfacies of explosive facies | Brecciated lava and tuffaceous lava | Vesicles, intergranular pores, dissolved pores, and structural fractures | Fracture-vesicle type, fracture-intergranular pore type, and fracture-dissolved pore type | |||||||||||||
| Top and upper subfacies of effusive facies | Vesicular rhyolite and breccia lava | > 20 | > 3 | Vesicles, structural fractures, and cooling contraction fractures | Vesicle type, fracture-vesicle type | |||||||||||
| II | Volcanic conduit facies | Vesicular rhyolite and autoclastic brecciated lava | > 20 | > 1.5 | Vesicles, blast fractures and structural fractures | Fracture-vesicle type, fracture-intergranular pore type | > 0.1 | < 6 | Types I and II | > 5 | > 0.1 | < 15 | < 3 | 2-5 | Moderate deliverability after hydraulic fracturing | Moderate |
| Hot clastic flow, splash and fallout subfacies of explosive facies | Breccia lava, tuffaceous lava, welded breccia and tuff, and volcanic breccia | Intergranular pores, vesicles, micropores, structural fractures, and blast fractures | Intergranular pore type, fracture-intergranular pore type, fracture-vesicle type, fracture-dissolved pore type | |||||||||||||
| Upper subfacies of effusive facies | Vesicular rhyolite, brecciated lava, and tuffaceous lava | > 15 | > 2 | Vesicles, structural fractures, and cooling contraction fractures | Vesicle type, fracture-vesicle type | |||||||||||
| III | Fallout subfacies of explosive facies | Volcanic agglomerate, volcanic breccia, and tuff | > 10 | > 0.5 | Intergranular pores, micropores, structural fractures, and blast fractures | Intergranular pore type and fracture-micropore type | > 0.01 | < 12 | Types I, II, and III | > 3 | > 0.01 | < 30 | < 5 | 0.5-2 | Low deliverability after hydraulic fracturing | Weak |
| Lower and middle subfacies of effusive facies | Aplitic rhyolite and tight rhyolite | > 5 | > 1 | Vesicles, micropores, structural fractures, and cooling contraction fractures | Vesicle type, fracture-vesicle type, and fracture-micropore type | |||||||||||
| Extraclastbearing and transported subfacies of volcanic sedimentary facies | Sedimentary volcanic breccia, sedimentary tuff, tuffaceous glutenite, tuffaceous gritstone, and tuffaceous sandstone | Intergranular pores, matrix micropores, and fractures | Intergranular pore type, micropore-intergranular pore type, fracture-intergranular pore type | |||||||||||||
| IV | Hot base surge subfacies of explosive facies | Crystalline, vitric and magmatic tuff | < 15 | < 1 | Fractures + micropores + intergranular pores | Intergranular pore type, micropore type, fracture-micropore type | > 0.01 | < 12 | Types II and III | > 3 | > 0.01 | < 50 | < 10 | < 0.5 | Noncommercial gas layer | Weak |
| Middle subfacies of effusive facies | Tight rhyolite | < 10 | < 1.5 | Vesicles, micropores, structural fractures, and cooling contraction fractures | Isolated vesicle type, micropore type, fracture-micropore type | |||||||||||
| Xenoclastbearing and transported subfacies of volcanic sedimentary facies | Sedimentary tuff, tuffaceous pack sand and siltite | Intergranular pores, matrix micropores, and fractures | Intergranular pore type, micropore-intergranular pore type | |||||||||||||

A type I A-P unit has strong accumulation-permeation capacity with large well-controlled reserves, high deliverability, and strong stable production potential. This type of A-P unit is developed in the most favorable lithology and lithofacies belts, including vesicular rhyolite and autoclastic brecciated lava of the volcanic conduit facies, breccia lava and tuffaceous lava of the splash subfacies (explosive facies), and vesicular rhyolite and brecciated lava of the top and upper subfacies (effusive facies).
A type II A-P unit has moderate accumulation-permeation capacity with moderate well-controlled reserves, moderate postfracturing deliverability, and stable production capability. This type of A-P unit occurs in relatively favorable lithology and lithofacies belts, including vesicular rhyolite and autoclastic brecciated lava of the volcanic conduit facies, welded breccia and welded tuff of the hot clastic flow subfacies, brecciated lava and tuffaceous lava of the splash subfacies, volcanic agglomerate, volcanic breccia, and tuff of the fallout subfacies (explosive facies), and vesicular rhyolite, brecciated lava, and tuffaceous lava of the top and upper subfacies (effusive facies).
A type III A-P unit has relatively poor accumulation-permeation capacity with small well-controlled reserves, low postfracturing deliverability, and weak stable production potential. This type of A-P unit occurs in unfavorable lithology and lithofacies belts with relatively poor petrophysical properties, including volcanic agglomerate, volcanic breccia and tuff of the fallout subfacies, aplitic rhyolite of the lower subfacies and tight rhyolite of the middle subfacies (effusive facies), sedimentary volcanic breccia and sedimentary tuff of the xenoclast-bearing subfacies, and tuffaceous glutenite, tuffaceous gritstone, and tuffaceous sandstone of the retransported subfacies (volcanic sedimentary facies).
A type IV A-P unit has poor accumulation-permeation capacity with small well-controlled reserves, low deliverability, and no stable production potential. This type of A-P unit is developed in relatively dense and unfavorable lithology and lithofacies belts, including crystalline, vitric, and magmatic tuff of the hot base surge subfacies (explosive facies), tight rhyolite of the middle subfacies (effusive facies), sedimentary tuff of the xenoclast-bearing subfacies, and tuffaceous pack sand and siltstone of retransported subfacies of the volcanic sedimentary facies.
2 Characterization of accumulation-permeation (A-P) capacity
A-P capacity involves accumulation capacity and permeation capacity. Various static and dynamic data can be used to quantitatively characterize both the accumulation capacity and the permeation capacity of volcanic rocks according to the classification scheme of A-P units by selecting appropriate parameters for characterization,
1) Accumulation capacity
Accumulation capacity is mainly influenced by the scale and internal effective porosity of A-P units. In general, it is characterized by the thickness and distribution area of A-P units, well-controlled reserves, the type of reservoir space, pore and fracture assemblage, A-P mode, and porosity. These can be shown using the XX gas field as an example:
1. Type I A-P unit. This type of A-P unit has the strongest accumulation capacity, with large scale and well-controlled reserves, multiple types of reservoir space and pore-fracture assemblage, appropriate A-P configuration, and high porosity. Its distribution area is larger than 2 km2; net pay thickness is greater than 20 m, and well-controlled reserve is larger than 5 × 10⁸ m3. Reservoir space is composed mainly of intergranular pores, vesicles, dissolution pores, and fractures. The pore-fracture assemblage includes intergranular pore type, vesicle type, fracture-intergranular pore type, fracture-vesicle type, and fracture-dissolution pore type, amounting to an effective porosity higher than 10%.
2. Type II A-P unit. This type of A-P unit has a relatively strong accumulation capacity, with a distribution area larger than 1.5 km2, effective thickness greater than 15 m, and well-controlled reserves ranging from 2 × 10⁸ m3 to 5 × 10⁸ m3. The reservoir space is composed mainly of intergranular pores, vesicles, dissolution pores, and fractures. The pore-fracture assemblage includes intergranular pore type, vesicle type, fracture-intergranular pore type, fracture-vesicle type, and dissolution pore type, which amount to an effective porosity greater than 5%.
3. Type III A-P unit. This type of A-P unit has relatively poor accumulation capacity with a distribution area larger than 0.5 km2, effective thickness greater than 5 m, and well-controlled reserves ranging from 0.5 × 10⁸ m3 to 2 × 10⁸ m3. The reservoir space is composed mainly of intergranular pores, vesicles, micropores, and fractures. The pore-fracture assemblage includes intergranular pore type, vesicle type, fracture-micropore type, fracture-dissolution pore type, and fracture type. These amount to an effective porosity higher than 3%.
4. Type IV A-P unit. This type of A-P units has poor accumulation capacity, characterized by small scale and well-controlled reserves, limited reservoir space and pore-fracture assemblage, unfavorable A-P configuration, and low porosity. Its distribution area is less than 1.5 km2, effective thickness is less than 15 m, and well-controlled reserve is smaller than 0.5 × 10⁸ m3. The reservoir space is composed mainly of intergranular pores, isolated vesicles, micropores, and fractures, and the pore-fracture assemblage includes intergranular pore type, micropore type, and fracture-micropore type, amounting to an effective porosity higher than 3%.
2) Permeation capacity
Permeation capacity is influenced by matrix pore structures and the developmental characteristics of interbeds and fractures. Generally, it is characterized with throat radius, displacement pressure, permeability, single-well deliverability, and stable production capability.
1. Type I A-P unit. This type of A-P unit has the highest permeation capacity, referred to as the “sweet spot” of gas reservoir. It is characterized by a large throat radius, low displacement pressure, high permeability, an underdeveloped internal interbed, high single-well deliverability, and strong stable production capability, and it has a throat radius larger than 0.3 μm, displacement pressure lower than 2 MPa, permeability less than 1 mD, interbed density lower than 10 m/100 m, interbed frequency less than 2 layers/100 m, high single-well natural production or high postfracturing production, and strong stable production capability.
2. Type II A-P unit. This type of A-P unit has moderate permeation capacity with a throat radius larger than 0.1 μm, displacement pressure lower than 6 MPa, permeability higher than 0.1 mD, interbed density lower than 15 m/100 m, interbed frequency less than 3 layers/100 m, moderate single-well postfracturing production, and moderate stable production capability.
3. Type III A-P unit. This type of A-P unit has relatively poor permeation capacity with a throat radius larger than 0.01 μm, displacement pressure lower than 12 MPa, permeability higher than 0.01 mD, interbed density lower than 30 m/100 m, interbed frequency less than 5 layers/100 m, low single-well postfracturing production, and poor stable production capability.
4. Type IV A-P unit. This type of A-P unit has poor permeation capacity. It is characterized by a small throat radius, high displacement pressure, low permeability, well-developed internal interbed, low single-well deliverability, and weak stable production capability, and it has a throat radius larger than 0.01 μm, displacement pressure lower than 12 MPa, permeability higher than 0.01 mD, interbed density lower than 50 m/100 m, interbed frequency less than 10 layers/100 m, single-well gas production lower than the criteria of a commercial gas well, and weak stable production capability.
10.3.4 Distribution of volcanic accumulation-permeation (A-P) units
Based on the identification and characterization of A-P units, the development characteristics of A-P units in various lithofacies and locations of volcanic edifices are analyzed, and the distribution of volcanic A-P units is summarized. These analyses are discussed next using the acidic volcanic gas reservoir in the XX gas field as an example.
1 Distribution of A-P units in various lithofacies
The type, scale, A-P capacity, and single-well production characteristics for A-P units are different in various lithofacies due to various petrogenetic processes. Based on the identification and dissection of these features, the characteristics of volcanic A-P units in various lithofacies can be delineated.
1) Types of A-P units developed in various lithofacies
Volcanic conduit facies A-P units
The lithology is mainly autoclastic brecciated lava in the volcanic conduit facies, where vesicles, dissolved pores, blast fractures, and columnar joints are developed. The A-P units have a relatively small scale and good petrophysical properties. They are mainly type II, with a small quantity of types I and III.
Explosive facies A-P units
In the splash subfacies, the lithology is mainly brecciated lava and tuffaceous lava, where vesicles, intergranular pores, and fractures are developed. The A-P units are relatively small in scale and have good petrophysical properties, and they are mainly types II and I.
In the hot clastic flow subfacies, the lithology comprises mainly welded tuff and welded breccia, where intergranular pores, micropores, vesicles, and fractures are developed. The A-P units are relatively large in scale and of relatively good petrophysical properties, being mainly type II.
In the fallout subfacies, the lithology is dominated by volcanic agglomerate, volcanic breccia, and tuff, with well-developed intergranular pores, micropores, and fractures. The A-P units are of relatively large scale and moderate to relatively poor petrophysical properties, and they are mainly types II and III.
In the hot base surge subfacies, the lithology is mainly volcanic agglomerate, volcanic breccia, and tuff, with well-developed micropores and fractures. The A-P units are large in scale but have poor petrophysical properties, represented mainly by types III and IV.
Effusive facies A-P units
In the top and upper subfacies, the lithology consists mainly of vesicular rhyolite, with well-connected vesicles and well-developed fractures. The A-P units are of large scale and good petrophysical property, being mainly types I and II.
In the lower subfacies, the lithology is mainly aplitic rhyolite, with a minor number of poorly connected vesicles but well-developed fractures. The A-P units are of relatively small to moderate scale and poor to moderate petrophysical properties, represented mainly by types II and III.
In the middle subfacies, the lithology is mainly aplitic rhyolite, where fractures and minor vesicles are developed. The A-P units are of large scale and yet poor petrophysical property, being mainly type III and IV.
Volcanic sedimentary facies A-P units
The lithology comprises mainly sedimentary volcanic rocks and volcanic sedimentary rocks of the volcanic sedimentary facies, with intergranular pores developed. The A-P units are of small scale and poor petrophysical property, and they are mainly types III and IV, developed mainly in the xenoclast-bearing subfacies and retransported subfacies.
2) Scale of A-P units developed in various lithofacies (Figure 10.42)
Volcanic conduit facies A-P units
Dimensions of the AP units: length 12.2 km, average 1.4 km; width 0.8 to 2.1 km, average 1.3 km; thickness 28 to 42 m, average 35 m; area 0.8 to 2.6 km2, average 2 km2. With a small area and large thickness, they are relatively small in scale.

Eruptive facies A-P units
Dimensions of the AP units: length 1 to 3.2 km, average 2.8 km; width 0.9 to 3.4 km, average 2.1 km; thickness 9 to 88 m, average 35 m; area 0.9 to 7.5 km2, average 4.2 km2. With a relatively large area and large thickness, they are considered relatively large in scale.
Effusive facies A-P units
Dimensions of the AP units: length 1.3 to 3.5 km, average 2.5 km; width 1.3 to 3.4 km, average 2.2 km; thickness 10 to 94 m, average 25 m; area 1.9 to 9.9 km2, average 5.8 km2. With a large area and relatively large thickness, they are the largest in scale.
Volcanic sedimentary facies A-P units
Dimensions of the AP units: length 0.8 to 1.7 km, average 1.2 km; width 0.6 to 0.9 km, average 0.8 km; thickness 11 to 22 m, average 16 m; area 0.8 to 1 km2, average 0.9 km2. With a small area and small thickness, they are the smallest in scale.
In summary, the A-P units of effusive facies have the largest size, those of explosive facies rank second, and those of volcanic sedimentary facies are the smallest among various volcanic facies in the XX gas field.
3) A-P capacity and deliverability of A-P units developed in various lithofacies
Volcanic conduit facies
Type II A-P units are mainly developed in volcanic conduit facies with limited accumulation capacity but good permeation capacity, low well-controlled reserves, high deliverability, but poor stable production capability.
Explosive facies
Types II and I A-P units are mainly developed in the splash subfacies, with relatively good A-P capacity, high well-controlled reserves, high deliverability, and strong stable production capability. Type II A-P units are also common in the hot clastic flow subfacies, with relatively good A-P capacity, high well-controlled reserves, relatively high deliverability, and relatively strong stable production capability. Types II and III A-P units are predominant in the fallout subfacies, with moderate A-P capacity, well-controlled reserves, moderate deliverability, and stable production capability. Types III and IV A-P units are commonly developed in the hot base surge subfacies, with poor A-P capacity, low well-controlled reserves and deliverability, and weak stable production capability.
Effusive facies
Types I and II A-P units are commonly developed in the top and upper subfacies, with strong A-P capacity, high well-controlled reserves and production, and strong stable production capability. Types II and III A-P units are mainly developed in the lower subfacies, with relatively strong A-P capacity, relatively high well-controlled reserves and production, and relatively strong stable production capability. Types III and IV A-P units are dominant in the middle subfacies, with poor A-P capacity, low well-controlled reserves and production, and poor stable production capability.
Volcanic sedimentary facies
Types III and IV A-P units are common in the volcanic sedimentary facies with poor A-P capacity, low well-controlled reserves and production, and poor stable production capability.
2 Spatial distribution of volcanic A-P units
Based on the identification of A-P units, a preliminary assessment of the spatial distribution of volcanic A-P units can be achieved by analyzing the profile distribution (Figure 10.43), planar distribution (Figure 10.44), and spatial distribution (see Figure 10.28) characteristics of A-P units. The favorable areas for A-P unit distribution are classified into three types as follows:


1. The top area adjacent to the volcanic massif (see Figure 10.43). The top part of the rock body has well-developed primary pores and fractures, with strong secondary dissolution. This facilitates the formation of fracture-dissolution pore type A-P units with relatively large thickness and fracture-primary pore type A-P units.
2. The main part of the volcanic massif. This refers to the crater and near-crater facies belts. Due to rapid accumulation, there are various primary pores and fractures, which favors the formation of fracture-primary pore type A-P units.
3. The upper and lower parts of effusive facies. There are vesicles and contraction fractures with little effect of compaction, which facilitates the formation of primary laminar pore type A-P units.
10.4 Applications
The characterization technology of A-P units discussed in this chapter can be used to delineate the shape, scale, connectivity, and accumulation-permeation capacity of various A-P units in a volcanic gas reservoir. This provides a basis for optimizing well location and horizontal well trajectory design, evaluating well-controlled dynamic reserves, and optimizing development technology policy.
10.4.1 Revealing the planar distribution of A-P units to guide the optimization of well location
The planar distribution of A-P unit is the basis of well placement. The planar prediction of A-P units helps delineate their planar distribution pattern, which in turn serves as a guide for optimizing well location and improving the success rate of developmental well placement.
In accordance with the planar distribution of volcanic massifs (Figure 10.45a) and A-P units (Figure 10.45b), a total of seven horizontal wells were placed near the crater facies belt, near the top area of a volcanic massif and the effusive facies area in the CC gas field (Figure 10.45c). The gas test after well completion shows that single-well daily gas production ranges from 24 × 104 m3/d to 51 × 104 m3/d, which is a desirable verification.

10.4.2 Optimizing horizontal well trajectory design under the guidance of the spatial distribution of A-P units
The spatial distribution of A-P units serves as a guide for optimizing horizontal well trajectory design. Based on the spatial prediction results of several methods, the spatial distribution characteristics of volcanic A-P units are clarified, and they provide a basis for optimizing horizontal well trajectory design, improving the drilling success rate of horizontal wells, and enhancing single-well production.
In the case study of the XX gas field, the trajectory of horizontal Well XX1-P2 (Figure 10.46) is optimized and modified timely during drilling based on the prediction of the 3D spatial distribution of A-P units (see Figure 10.28). After the completion, the effective reservoir drilling success rate of the horizontal wells reached 98%, and the type I effective reservoir drilling success rate was up to 86%. After perforation, daily gas production reached 24 × 104 m3/d under natural conditions.

10.4.3 Guiding well-controlled dynamic reserve evaluation based on the scale and A-P capacity of A-P units
Both the scale and the A-P capacity of A-P units usually have an effect on well-controlled dynamic reserves, as is shown by the XX gas field. Characterization of the scale and A-P capacity of A-P units is used to establish the correlation between well-controlled dynamic reserves and the volume of A-P units, as well as the relationship between well-controlled dynamic reserves and the permeability of a connected rock body (Figures 10.47 and 10.48). The figures show that larger-scale A-P units are positively correlated with higher permeability and larger single-well-controlled reserves. As a result, quantitative characterization of both the scale and the capacity of A-P units has important implications for evaluating well-controlled dynamic reserves.
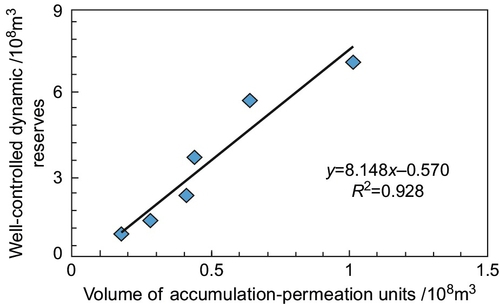

The deliverability of gas wells is influenced by both the scale and the A-P capacity of A-P units. Larger-scale A-P units are positively correlated with higher permeability and higher single-well open-flow potential. As the XX gas field example (Figure 10.49) shows, the correlation coefficient between single-well open-flow potential and the scale of A-P units is up to 0.95. Therefore, the characterization of the scale and A-P capacity of A-P units provides a basis for assessing the stable production capability of gas wells.