Identification of Gas and Water Zones in Volcanic Gas Reservoirs
As the principal means of clarifying gas and water distribution in volcanic gas reservoirs, gas and water zones in volcanic gas reservoirs are identified on the basis of mud log indicators for gas-bearing, water-bearing, and dry zones as well as formation test and logging responses as determined by combining qualitative analysis with quantitative interpretation and using individual well data. These analyses help delineate the distribution of gas and water zones and lay the foundation for identifying gas reservoir types and appropriate reserve evaluation.
8.1 Research challenges and technical solutions
8.1.1 Challenges in the identification of gas and water zones in volcanic rocks
The complex relationships between gas and water in volcanic gas reservoirs result in great difficulties in the identification of gas and water zones. One of the challenges is that geological logging is a qualitative identification method, and significant uncertainty exists in its data interpretation; most log data are obtained from mud return with significant depth errors. Therefore, this method is mainly used for preliminary and qualitative evaluation of the gas-bearing properties in volcanic rocks. Due to the poor petrophysical properties of the matrix in volcanic reservoirs and the presence of fractures, it is usually difficult to obtain accurate formation test data. Moreover, hydrodynamic fracturing during production makes it difficult to assess the accurate fluid-yielding position. All of these factors cause difficulties in identifying gas and water zones accurately.
Another challenge is that the complex and highly variable lithology, composition, and structural features of volcanic rocks result in different electrical conductivity, acoustic propagation and neutron deceleration characteristics; consequently, the resistivity and porosity logging responses differ greatly. Volcanic reservoir spaces are characterized by various types and complex pore structures, resulting in great variability in reservoir permeability and electrical conductivity. The difference between the resistivity values of volcanic rocks with different reservoir spaces and pore structures can be up to several orders of magnitude. In addition, the conductive mechanisms of volcanic rocks are complex. Low-resistivity gas layers (with resistivity two times lower than that of pure water zones [1]) often exist due to matrix conductivity, irreducible water conductivity, and filtrate invasion, which contribute to the uncertainty and challenges in the identification of gas and water zones using log data.
8.1.2 Technical solutions
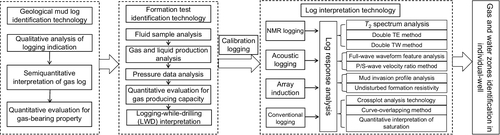
In light of the difficulties in gas and water zone identification, the integrated technical solutions based on geological logging, formation testing, and well log interpretation have been applied to establishing technical procedures (Figure 8.1), and the technique for identifying gas and water zones in volcanic gas reservoirs has been developed:
1. Based on data derived from cores and cutting logs, drilling fluid logs, and gas logs, the quantitative evaluation methods for gas-bearing properties including the qualitative analysis of logging indicators, semiquantitative interpretation of gas log and sealed coring are utilized for the preliminary identification of gas and water zones in volcanic rocks.
2. Based on available data on formation fluids, pressure, fluid production, and the like, technologies such as wireline (cable) testing, drill stem testing, conventional gas testing, and gas well testing, together with fluid sample analysis, gas and fluid production analysis, pressure data analysis, and quantitative evaluation of gas producing capacity, are used to identify gas and water zones in volcanic rocks.
3. Well log calibration with geological mud logs and formation testing is used as the basis for analyzing the logging response features of typical gas zones, water zones, and dry layers. The identification modes for gas and water zones are established for different lithologies. NMR, acoustic wave, array induction, and conventional log data, in combination with methods such as T2 spectrum analysis, acoustic waveform analysis, crossplot, curve-overlapping, and saturation calculation, are used to identify gas and water zones, which lay the foundation for an evaluation of gas reservoirs.
8.2 Geological logging and formation test identification
Geological logging and formation tests aim to directly acquire subsurface fluid information by geological means and various testing technologies. They are important methods for identifying volcanic gas layers and aquifers and for calibrating log data. The log data on gas and water zones, fluid samples, differences in pressure features, as well as individual well gas-bearing information are used to identify gas and water zones and calibrate log data, based on the principles of geological logging and formation tests.
8.2.1 Geological logging methods for identifying gas and water zones
The geological logging methods directly acquire subsurface gas-bearing information [2] by means of core logging, cutting and drilling fluid logging, gas logging, and compound logging. This approach delineates gas and water zones by identifying the abnormalities of high gas content in log indications. It is fast, convenient, intuitive, rich in information, and easy to use.
Considering the specific characteristics of the principles and data on different geological logging technologies, a technical solution, consisting of qualitative assessment, semiquantitative identification, and quantitative evaluation, is developed to integrate log data for identifying volcanic gas and water zones.
1 Qualitative logging indicator analysis
Useful information indicating the presence of gas layers include (1) bubbles in cores, fluorescence of cuttings, and gas shows during sealed coring; (2) bubbles on the liquid surface of mud ditch during drilling fluid logging; and (3) bubbles, gas influx, well kicks, and well blowout at the mud outlet of the wellhead. More frequent and intense occurrences of the preceding gas information indicate better gas-bearing properties for the reservoirs. Therefore, through observation and qualitative analysis, it can be determined whether the drilling has encountered a gas layer, and if a gas layer is present, its gas-bearing properties can be analyzed immediately.
Well XX1 is the initial discovery well for the XX gas field. Four well kicks and one controlled well blowout took place in the Ying 1 interval of volcanic rocks when the rig drilled into the Yingcheng Formation. The well kicks (in layers 145 to 150) were so strong that the mud gushed out of the throttle pipe as high as 5 m into the air. In consequence, mud weight and viscosity dropped slightly and rice-shaped bubbles with diameters of 1 to 2 cm were observed on the trench surface (their volume making up 60% to 70%). The mud height increased by around 5 cm and the mud overflew. Well blowouts (in layers 149 and 150) were strong. The maximum distance of the gas jet reached 40 m. After ignition, the flame was orange-red, with a jet distance of 14 to 15 m and a height of 4 to 5 m. In all of the volcanic rocks in Well XX1, these drilling indicators are observed to suggest the presence of abundant natural gas within the encountered volcanic formations. Gas testing was later implemented with gas production estimated at 6.84 × 10⁴ m3/d. This initiated the exploration and development of the XX gas field.
2 Semiquantitative gas log interpretation
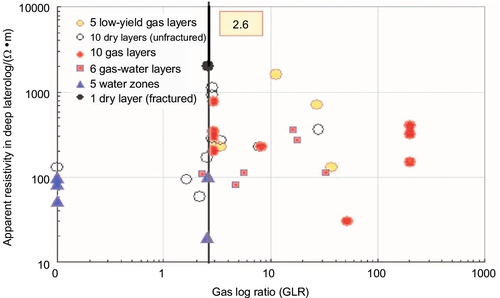
Gas log anomalies with values greater than the background values are important indicators for volcanic gas layers. Based on the information on gas, water, and dry zones determined by formation tests, together with the total-hydrocarbon data, hydrocarbon component, and nonhydrocarbon component data obtained by gas logging from the formation testing intervals, this technique relies on crossplot analysis to determine the cutoff criteria for key parameters such as total-hydrocarbon content, hydrocarbon components, and the gas log ratio of typical gas zones. It lays the foundation for interpreting gas and water zones based on gas log data.
Figure 8.2 illustrates how the volcanic gas zones were identified in the XX gas field using the gas log ratio method. It demonstrates that (1) different types of reservoirs have varied gas log ratios (GLR) and resistivity values: high-yield gas zones have relatively high GLR and moderate resistivity values, whereas low-yield gas zones have moderate GLR but relatively high resistivity; gas-water zones have relatively low GLR and resistivity; water zones have the lowest GLR and resistivity; and dry zones have relatively low GLR but the highest resistivity; and (2) the GLR cutoff of the volcanic gas zones of this gas field is about 2.6.
3 Quantitative evaluation of gas-bearing properties
The main logging methods that can be used for the quantitative evaluation of gas-bearing properties include (1) using sealed coring data to quantitatively determine the original gas saturation in gas zones, (2) using the total-hydrocarbon analysis data from gas logging to obtain hydrocarbon gas contents, (3) using the light hydrocarbon log of headspace gas to directly obtain data on the volumetric concentration of the 29 components from C1 to C7, and (4) using porosity and permeability analysis logging to calculate the free fluid index and irreducible water saturation so as to determine the original gas saturation in volcanic gas reservoirs.
Compared with formation tests and well logging, geological logging is more susceptible to the influence of nonformation factors. Therefore, the use of the single logging technique is prone to large errors in identifying gas and water zones. Using multiple methods to validate each other can effectively reduce the interpretation uncertainties and raise the congruence rate of gas and water zone identification.
8.2.2 Formation test method for identifying gas and water zones
The formation test method uses the techniques of testing while drilling, wireline tests, drill stem tests, conventional formation tests, and gas well tests to directly collect fluid samples and formation pressure data and to estimate formation parameters so as to evaluate the commercial deliverability of reservoirs. Due to its advantageous time saving, high efficiency, and quick response, formation testing has the advantages of quick turnaround time, high efficiency, and quick response, and it is recognized as an effective and important method for identifying gas and water zones [3,4].
The following procedures have been adopted to identify gas and water zones in volcanic gas reservoirs based on the technological principles of formation testing and information acquisition.
1 Analyzing fluid samples for gas-bearing properties
Wireline tests and drill stem tests can be used to collect fluid samples at tested intervals. These samples are analyzed to extract information on the composition and density of gas and condensate and to examine the ion components and salinities of formation water. This information can then be used to verify the presence of any natural hydrocarbon gas; to determine whether the water is formation water, mud filtrate, or hydrodynamic fracturing fluid; and to estimate the water cut.
2 Identifying gas and water zones in volcanic rocks by gas and liquid production analysis
Conventional gas tests and gas well tests can be used to channel formation fluid into the borehole and then flow out to the surface. Based on the production pattern (by natural flowing or hydrodynamic fracturing) of the fluid, metering methods, choke size, and the relevant production rates of gas and water, an appropriate procedure can be adopted to calculate the daily gas production, daily water production, gas-water ratio, and cumulative gas and water production. Gas-water property analysis and pressure characteristic analysis can be combined to estimate the fluid type and the potential production capacity and thus to identify gas and water zones in volcanic rocks.
3 Identifying the gas-water interface by pressure data analysis
Pressure data is the key information derived from formation tests. Pressure data vary with depth when acquired through testing while drilling (TWD), and wireline tests and drill stem tests are used to estimate the pressure gradient and the fluid density (Figure 8.3), to identify the fluid type and two-phase fluid interface, and to identify gas and water zones.

Figure 8.3 shows an example of using Modular Dynamic Tester (MDT) data to identify the fluid type for Well CC1-2 in the CC gas field. This figure demonstrates that (1) gas zones are characterized by small pressure gradients, high resistivity, low density, and low neutron porosity. In contrast, water zones are characterized by large pressure gradients, low resistivity, high density, and high neutron porosity. Condensate layers are between the former two cases; and (2) the gas-oil interface and oil-water interface are located at about 7150 ft and 7180 ft, respectively.
4 Estimating gas production capacity by analyzing the gas production rate and pressure variations under different choke sizes
The pinpoint test method is used in conventional gas formation testing to acquire data on gas and water production and pressure variations under different choke sizes. Through gas reservoir engineering analysis, the effective permeability of the tested zone is calculated, the pressure characteristics of the tested zone are clarified, the relationship between gas production and flowing pressure is established, the gas well deliverability equation and the absolute open flow potential are determined, and the reserves controlled by wells are estimated qualitatively. Consequently, the production capacity of the tested zone in the gas well is estimated, which will provide a basis for determining an appropriate production system.
5 Interpreting gas and water zones by analyzing logging-while-drilling curves
Formation testing while drilling (TWD) offers a method to measure resistivity, acoustic waves, natural gamma ray, density, and neutron porosity, thereby generating logging curves. Based on the conventional well testing method for identifying gas and water zones, the resistivity-acoustic wave and neutron-density crossplot techniques or the sensitivity curve-overlapping method can be used to identify the types of products derived from the tested zone and hence to identify gas and water zones in volcanic gas reservoirs.
8.3 Well logging identification techniques
Well logging measures the characteristics of subsurface rocks—such as radioactivity, neutron deceleration, acoustic propagation, electrical conductivity, and proton relaxation characteristics—in order to identify gas layers and aquifers indirectly. This book presents an integrated approach to identifying volcanic gas, water, and dry zones based on the characteristics of the gas and water zones in volcanic gas reservoirs, whereby the formation test results are used to calibrate logging information. In addition, the logging response characteristics of gas, water, and dry zones are analyzed; nuclear magnetic logging, acoustic logging, array induction logging, and conventional well logging are integrated; and T2 spectrum analysis, waveform analysis, crossplot, and curve-overlapping methods are applied.
8.3.1 Nuclear magnetic logging identification techniques
Nuclear magnetic logging is used to record the relaxation characteristics of different fluids in different states within formation pores. Several methods, such as T2 spectral analysis, shifted spectrum analysis, and differential spectrum analysis, are used in combination to identify gas, water, and dry zones in volcanic gas reservoirs based on the principles of nuclear magnetic logging and different relaxation characteristics between gas and water.
1 Logging principles
Nuclear magnetic logging is based on the principle of nuclear magnetic resonance and measures the spin echo signal and its amplitude attenuation with time (the left side of Figure 8.4). After a multiple-factor transformation, a common T2 spectrum is obtained (the right side of Figure 8.4). The T1 spectrum is measured by the reversal recovery method utilizing radio frequency pulses [5,6]. Considering the requirement of wireline logging for logging speed, usually the lateral relaxation is the objective of measurement [7,8].

2 Relaxation characteristics of natural gas and water
There are three relaxation modes for protons in strata: surface relaxation, diffusive relaxation, and volumetric relaxation [9,10]. In rocks, irreducible water primarily exhibits surface relaxation; free water mainly exhibits volumetric relaxation and is also affected by diffusive relaxation. Natural gas primarily exhibits diffusive relaxation. The relaxation characteristics of formation water and natural gas differ from each other in several aspects (Table 8.1): (1) water has a high hydrogen content and a small diffusion coefficient and hence has a short longitudinal relaxation time (T1) and long lateral relaxation time (T2); (2) in contrast, natural gas has a low hydrogen content and a greater diffusion coefficient and thus has a long longitudinal relaxation time (T1) and a short lateral relaxation time (T2); and (3) there is a large difference of more than 40 times between the values of T1 and T2 for natural gas and formation water.
Table 8.1
Comparison between Relaxation Characteristics of Natural Gas and Water
| Fluid | T1/ms | T2/ms | Typical T1 /T2 | HI | η/(mPa•s) | D/(× 10− 5 cm2/s) |
| Water | 1–500 | 1–5000 | 2 | 1 | 0.2–0.8 | 1.8–7 |
| Gas | 2000–5000 | 1–60 | 80 | 0.2–0.4 | 0.011–0.014 | 80–100 |
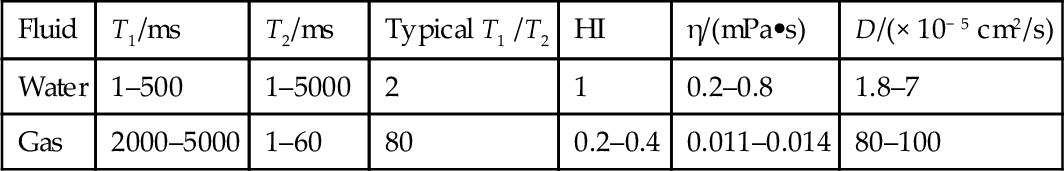
Note: T1, longitudinal relaxation time; T2, lateral relaxation time; D, diffusion coefficient. HI, hydrogen content index; η, viscosity.
3 Logging response characteristics of gas, water, and dry zones in volcanic rocks
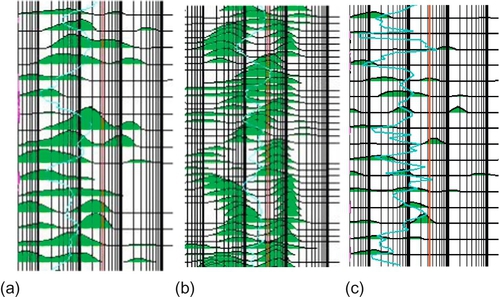
The pattern of T2 in nuclear magnetic logging for volcanic reservoirs is determined by reservoir space type, pore size, and fluid type. When different types of fluids are present in a volcanic reservoir, the response characteristics of nuclear magnetic logging show the following changes (see Figure 8.4, Table 8.2): (1) for a gas layer, T2 is short, and the peak has a large amplitude peak on the left side of the T2 spectrum and typically exhibits an unimodal or a closely spaced bimodal feature; (2) For an water zone, T2 is long, and the peak has a large amplitude peak on the right side of the T2 spectrum and exhibits a more widely separated bimodal feature; and (3) for a tight dry layer, T2 is long, and the peak has a small and wide amplitude peak and exhibits a bimodal or multimodal feature. Based on these log characteristics, nuclear magnetic logging can be used to identify gas and water zones [5].
Table 8.2
Response Characteristics of Gas, Water, and Dry Layers in Nuclear Magnetic Logging
| Reservoir Type | Peak T2 Value | Peak Amplitude | Free-Fluid Peak Position | Spectrum Shape |
| Gas layer | Short | Large | Left | Unimodal or closely bimodal |
| Water layer | Long | Large | Right | Bimodal |
| Dry layer | Widespread | Small | Widely spread | Bimodal or multimodal |

4 Nuclear magnetic logging methods for identifying gas and water zones in volcanic rocks
T2 spectrum analysis, shifted spectrum, and differential spectrum methods are used to identify gas and water zones in volcanic rocks based on the identification principles.
1) T2 spectrum analysis
In accordance with the peak positions, amplitudes, and spectrum shapes of T2 spectral distribution patterns in nuclear magnetic logging, fluid types can be qualitatively identified (Figure 8.5) following these two steps:
1. The number and amplitude of the free-fluid peaks (T2 > T2cutoff) of the target layer are analyzed to estimate whether the zone is a reservoir or a tight dry layer. A greater number of free-fluid peaks coupled with higher peak amplitudes usually indicate better reservoir effectiveness.
2. In a volcanic reservoir, the position and the spectral shape of the free-fluid peak are analyzed to determine the gas-bearing properties of the target layer and thereby obtain a preliminary identification of the gas and water zones. The farther left the free-fluid peak is in the spectrum, the better gas-bearing properties the reservoir has.
2) Shifted spectrum method
The shifted spectrum method is also known as the parallel TE method. Due to different diffusion coefficients, hydrocarbon gas and water zones are distributed at different positions in the T2 spectra. The gas layer is shown approximately as a single peak, whereas the water zone usually has a wide distribution. Therefore, if acquisition time is set long enough and TR > 3-5T1h (where TR is longitudinal recovery time, and T1h is the longitudinal relaxation time of natural gas) to allow complete recovery of the longitudinal relaxation in each measurement, the two echo strings can be obtained with two echo intervals (i.e., TEL and TES) and for different lengths for the measurement. In the T2 spectra of the long echo interval (TEL), T2 for the gas layer is shorter than that for the short echo interval TES. The time variation of T2 for the water zone is related to the pore size. T2 would be reduced by a larger margin in a big pore than in a small pore. In addition, the displacement of signals toward T2 for gas is much larger than that for water [5]. Hence, by calculating the T2 distribution difference between long and short echo intervals, the signals for water can be removed and the characteristics of natural gas can be highlighted (Figure 8.6).
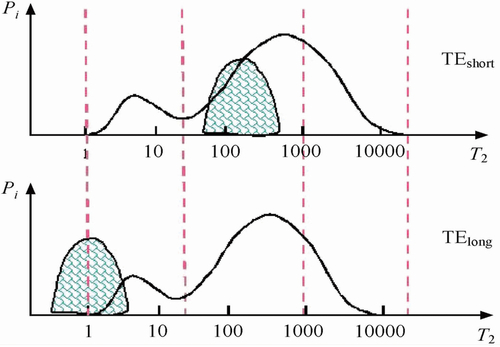
Figure 8.7 shows a layer of rhyolitic welded tuff in a well of the XX gas field. The effective porosity has a range of 6% to 12%, and the permeability 1 to 3 mD. The T2 spectra show that many long relaxation components are present in this layer, indicating the presence of well-developed macro pores. The processing results using the shifted spectrum method indicate that the leftward displacement of T2 of the short echo interval is insignificant, whereas the leftward displacement of T2 of the long echo interval is conspicuous, exhibiting a notable gas-bearing feature. Gas layer testing after hydrodynamic fracturing was conducted in the interval of 3416 to 3424 m. Daily gas production reached 44.65 × 10⁴ m3, and 14.4 m3 of liquids were produced per day. The flow-back rate was 10.98%. Water data analysis indicates a mud filtrate. The zone was thus confirmed to be a commercial gas layer.

3) Differential spectrum method
The differential spectrum method is also known as the parallel TW method. The standard echo interval and two different lengths of acquisition time, TWL (> 3-5T1g) and TWS (> 3-5T1w), are used in the measurement. Because the longitudinal relaxation recovery of water is much faster than that of gas, the magnetization vectors of water and gas will recover completely in the echo information acquired with the long waiting time TWL,, and the T2 spectra will contain complete gas and water information. In the echo information acquired with short waiting time TWS, the T2 spectra will include complete water information but only partial gas information. The gas information is thus obtained by subtracting one from the other (Figure 8.8) [5].
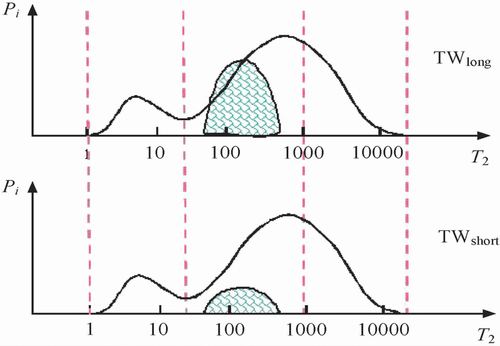
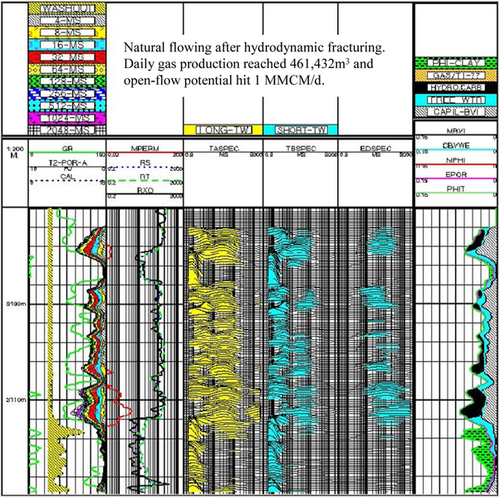
Figure 8.9 shows an example of the differential spectrum method used to identify volcanic gas layers. The T2 signal measured with the long acquisition time (the fourth trace) is considerably greater than the T2 signal measured with the short acquisition time (the fifth trace), and the separation between the two (the sixth trace) indicates distinct characteristics of a gas layer. After hydrodynamic fracturing, natural flowing started, with daily gas production reaching 46.14 × 10⁴ m3 and the open-flow potential approaching 1 MMCM (million cubic meters)/d. The formation was thus verified as a commercial gas layer.
8.3.2 Acoustic logging identification technique
1 Principle of the technique
The orthogonal dipole acoustic logging instrument consists of a controllable monopole emitter, two orthogonal dipole emitters, and eight array receivers (32 receiving units). Using six different operation modes, it can accurately acquire longitudinal waves, fast-slow shear waves, and Stoneley waves; in addition, it can obtain the time difference, reflected energy, and wave shapes of different acoustic waves.
Natural gas slows down the propagation velocity of acoustic waves in formations and strengthens the energy-absorbing capacity of the acoustic waves. When different fluids are present, the response characteristics of the acoustic log (e.g., the dipole sonic imager (DSI) log) will be different (Figure 8.10, Figure 8.11, and Table 8.3):
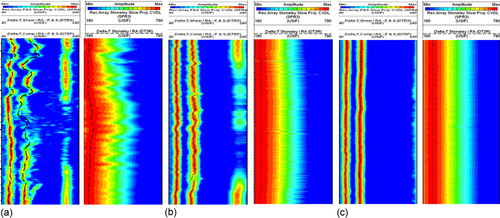

Table 8.3
Acoustic Logging Response Characteristics of Gas, Water, and Dry Zones
| Reservoir Type | P-Wave Slowness | P-S Velocity Ratio | Reflected Wave Energy | Wave Interference Figure |
| Gas layer | Long, cycle skip | Small | Weak | Waveform partially missing, chaotic |
| Water layer | Moderate | Relatively large | Moderate | Waveform complete but chaotic |
| Dry layer | Short | Large | Strong | Waveform complete and straight |
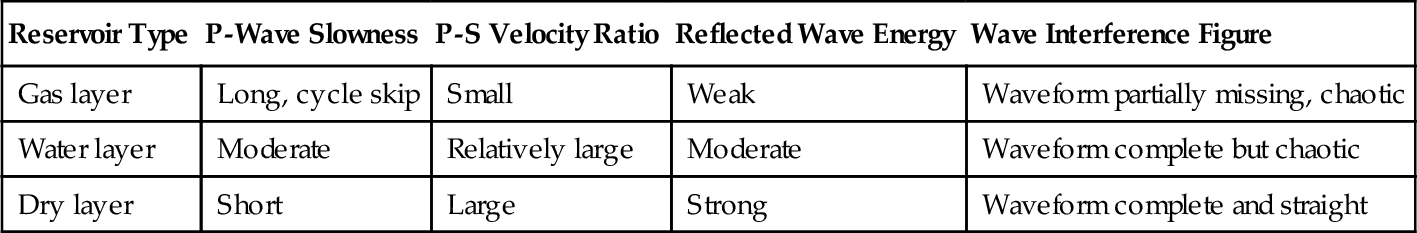
1. The volcanic gas layers are marked by large time lags among longitudinal waves (P wave), shear waves (S wave), and Stoneley waves, as well as rapid energy attenuation, leading to a low energy value (Figure 8.10a). On the wave interference figure, the waveform is partially missing, chaotic, and has interference fringes (Figure 8.11). In addition, as the longitudinal and shear wave velocities change at different rates, the P-S (compressive-shear wave) velocity ratio decreases by 3% to 30% [11,12].
2. The water layers are marked by moderate time lags for longitudinal waves, shear waves, and Stoneley waves, resulting in a moderate wave energy attenuation and moderate energy (Figure 8.10b). On the wave interference figure, the waveform is complete but chaotic, and the P-S velocity ratio is relatively large.
3. For tight dry layers, the time lag of longitudinal, shear, and Stoneley waves are small, marked by minor waves energy attenuation and thus strong energy (Figure 8.10c). The waveform is complete and straight, and the P-S velocity ratio is large.
2 Identification methods
Based on the principles of acoustic log identification, two methods can be used to identify gas and water zones in volcanic rocks.
1) Analysis of full-wave oscillogram attenuation characteristics
Volcanic gas layers have a strong capacity to absorb acoustic waves, thus the acoustic wave energy would show drastic attenuation. As a result, the full wave oscillogram exhibits features such as partially missing and chaotic waveforms and interference fringes. Under the same conditions, a formation with better gas-bearing properties will have more obvious acoustic wave response characteristics. Hence, in accordance with the full wave oscillogram attenuation characteristics, the gas-bearing properties of a formation can be estimated on a preliminary basis.
2) Interval transit time and p-s velocity ratio method
Under the same conditions, a formation with better gas-bearing properties will show a larger interval transit time but smaller P-wave and S-wave velocities. Hence, a preliminary identification of gas and water zones can be achieved by establishing a crossplot of interval transit time and P-S velocity ratio. Figure 8.11 is the crossplot of the interval transit time and P-S velocity ratio for gas, water, and dry zones in the XX gas field. It shows that, in the gas layer, the interval transit time is high and the P-S velocity ratio is low, whereas in the water zone, both the interval transit time and the P-S velocity ratio have high values. For the tight dry layer, the interval transit time is low and the P-S velocity ratio is moderate.
Figure 8.12 shows an example of the acoustic logging method used to identify gas layers. In Well XX1, the 3447- to 3453-m interval is a crystalline tuff reservoir with good petrophysical properties. The P-wave time lag is high (about 62.8 μs/ft) and cycle skip was observed. The P-S velocity ratio (Vp/Vs) is about 1.53, which is smaller than that for tight layers. The acoustic wave energy attenuates rapidly, the waveform being chaotic or even partly missing. The energies of longitudinal, shear, and Stoneley waves are weak, indicating good gas-bearing properties of the interval. Formation testing was conducted at the 3460- to 3470-m interval. Daily gas production reached 19.57 × 10⁴ m3, thus confirming a commercial gas layer.

8.3.3 Array induction logging identification technique
1 Principle of the technique
The high-resolution induction logger (HDIL) is equipped with an emitter coil, eight receiver coils, and eight compensating coils, which form eight array units with three working frequencies (25 kHz, 50 kHz, and 100 k Hz) and can generate hundreds of induction resistivity curves with three longitudinal resolutions (1 ft, 2 ft, and 4 ft) and six detection depths (10 in, 20 in, 30 in, 60 in, 90 in, and 120 in). Based on these curves, original formation resistivity and mud invasion profiles can be obtained through pretreatment and 1D inversion processing [13].
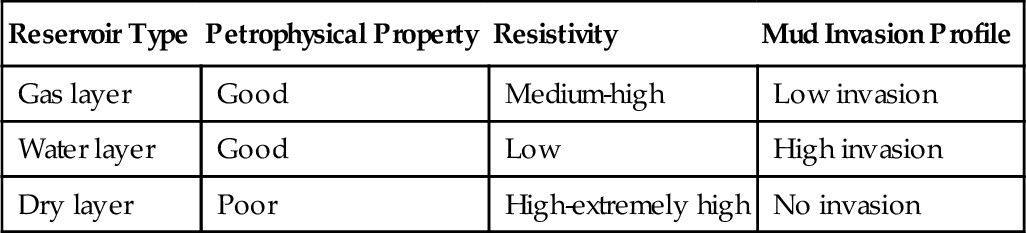
Due to the poor electrical conductivity of natural gas, volcanic gas layers have good petrophysical properties and high resistivity. Mud invasion will result in a decline in resistivity, causing a low mud invasion effect. Formation water has good conductivity and water zones in volcanic rocks have good petrophysical properties and low resistivity, so mud invasion will result in higher or constant resistivity, thus causing low mud invasion or no mud invasion effect. As tight volcanic dry layers have poor petrophysical properties and high to ultra high resistivity, it is difficult for mud to enter the formation. In most cases, there is no mud invasion effect (Table 8.4). Therefore, volcanic gas and water zones can be identified by comparing different original formation resistivities and analyzing the characteristics of invasion profiles from array induction logging.
2 Identification methods
Two methods can be used to identify gas and water zones in volcanic rocks based on the principles of gas layer and water zone identification in array induction logging.
1) Mud invasion profile analysis
When the formation water salinity satisfies certain conditions (Rw < Rmf), the mud invasion profiles of gas layers will exhibit the typical characteristics of low invasion (namely, the resistivity of the mud-invaded zone decreases). In contrast, the mud invasion profiles of water zones will exhibit the typical characteristics of high mud invasion. Tight dry layers will show no mud invasion.
In the figure of array induction processing results for Well XX5 (Figure 8.13), layer 142I (a rhyolitic volcanic breccia reservoir from 3700 to 3755 m deep) exhibits the overall characteristics of low mud invasion (the fourth curve) with noticeable gas-bearing features. Layer 142II (a rhyolitic crystal tuff reservoir from 3755 m to 3784 m deep) generally exhibits the characteristics of high mud invasion without noticeable gas-bearing features. A perforation test was carried out at the interval from 3754 m to 3768 m without hydrodynamic fracturing. Daily water production was maintained at 4.64 m3. The test indicated a water layer, which validated the above assessment its gas-bearing properties.

2) Original resistivity cutoff and saturation calculation method
In general, a gas layer has medium-high resistivity values, a water layer has low resistivity, and a dry layer is characterized by high to extremely high resistivity. For this reason, gas and water zones can be identified qualitatively by comparing the resistivity values under the same conditions. Gas and water zones can be recognized semiquantitatively by examining the resistivity cutoff criteria of effective gas reservoirs. Based on saturation calculations, gas and water zones can also be distinguished and the gas-bearing properties of a reservoir can be evaluated quantitatively.
In Figure 8.13, layer 142 I shows a high resistivity. The average original resistivity of the formation interpreted by array induction logs is 300 Ω · m, higher than the cutoff of gas layers (at 110 Ω · m). The average gas saturation of reservoir matrix is 52%. The layer is interpreted as a gas layer, which is inferior to the commercial gas layers of the same type in the area in terms of gas-bearing properties. Layer 142 II is of low resistivity, with the average true resistivity of the layer interpreted by array induction logs being 60 Ω · m, lower than the cutoff of gas layers. The average gas saturation of reservoir matrix is 30%. The layer is interpreted as a water layer. Subsequent gas testing validated these interpretations.
8.3.4 Conventional well log-based identification technique
1 Principle of the method
The differences between natural gas and formation water in neutron deceleration characteristics, the photoelectric absorption index, acoustic propagation characteristics, and electrical conductivity are the key factors used to help identify gas and water layers in volcanic rocks (Table 8.5). The ratio of natural gas density to formation water density is about 1/8, the ratio of their compensated neutrons is less than 1/100, the ratio of their macroscopic thermal neutron capture sections is around 1/13, and the ratio of their interval transit time is greater than 4. In addition, natural gas has poor conductivity and high resistivity, whereas formation water has good conductivity and low resistivity [14].
Table 8.5
Responses of Natural Gas and Formation Water in Conventional Well Logs
| Fluid Type | Compensated Density/(g/cm3) | Compensated Neutron /(p. u) | Thermal Neutron Macroscopic Capture Section Index/(p. u) | Resistivity | Interval Transit Time/(μs/ft) |
| Formation water | 1.19 | 60 | 157.6 | Low | 185 |
| Natural gas | 0.15 | — | 12.5 | High | > 800 |

2 Conventional well logging response characteristics of gas layers, water layers, and dry layers
Natural gas and formation water have different responses to conventional well logging; therefore, gas layers, water-bearing layers, and dry layers in volcanic rocks will have different characteristics in conventional wireline log curves (Table 8.6 and Figures 8.14 and 8.16).
Table 8.6
Conventional Well Logging Response Characteristics of Gas Layers, Water Layers, and Dry Layers in Volcanic Gas Reservoirs
| Reservoir Type | Resistivity | Separation between Deep and Shallow Laterolog Resistivity | Rock Density | Neutron Porosity | Interval Transit Time |
| Gas layer | Medium-high | Positive separation | Low | Medium-low, excavation effect | High, cycle skip |
| Water layer | Low | Negative separation | Medium | High | Medium |
| Dry layer | High-extremely high | No separation or minor separation | High | Low | Low |


1) Well log characteristics of volcanic gas layers
Volcanic gas layers are characterized by low density, medium-low neutron porosity (excavation effect), high interval transit time (cycle skip), medium-high resistivity, and positive separation between deep and shallow laterolog resistivity values (see Table 8.6).
Layer 215I in Well XX23 (depths 3892 to 3975 m; see Figure 8.14) is a rhyolite reservoir with an average matrix porosity of 9.5% and good petrophysical properties. Its average resistivity is 1175 Ω · m, higher than the cutoff of gas layers. Its positive difference between deep and shallow laterolog resistivities is 310 Ω · m. Its average neutron porosity is 3.35%, lower than the formation porosity. Its average interval transit time is relatively high, at 59.3 us/ft. Its average density is relatively low, at 2.41 g/cm3. These parameters indicate a gas layer, which produced 27.86 × 10⁴ m3 of gas per day without liquids after hydrodynamic fracturing. The production lasted 30 days and production stabilized at 10 × 104 m3/d, with stable pressure, indicating a typical commercial gas layer.
2) Well logging characteristics of volcanic water layer
Compared with a gas layer, a volcanic water layer is characterized by medium density, higher neutron porosity, medium interval transit time, lower resistivity, and negative separation between deep and shallow laterolog resistivity values (see Table 8.6).
Layer 159IV in Well XX21-1 (depths of 3760 to 3820 m; see Figure 8.15) is a breccia and welded breccia reservoir with an average matrix porosity of 7.46%. The layer has good petrophysical properties. Its average resistivity is 34 Ω · m, lower than the cutoff of gas layers. There is slight positive separation (at about 4 Ω · m) between deep and shallow laterolog resistivity values. Its average neutron porosity is up to 13.1%, higher than formation porosity. Its average interval transit time is relatively high, at 70.1 us/ft. Its average density is relatively low, at 2.49 g/cm3. The data thus indicate a water layer. A natural production test was carried out at an interval of 3768 to 3778 m and daily gas and water production stood at 10 m3 and 0.29 m3, respectively, thus confirming a water layer.


3) Well logging characteristics of tight volcanic dry layers
In wireline logs, the poor petrophysical properties of tight volcanic dry layers are characterized by high density, low neutron porosity, low interval transit time, high to ultra-high resistivity, and a negligible separation between deep and shallow laterolog resistivity values (see Table 8.6).
Layer 60VI in Well XX9 (depths 3783 to 3845 m; see Figure 8.16) is a dacite reservoir with an average matrix porosity of 2.1%, lower than the lower limit of effective reservoirs. The formation has a very high resistivity, averaging at 33,730 Ω · m. There is slight positive separation between deep and shallow laterolog resistivity values, which is the result of stress-free fractures. It has an average neutron porosity is 0.28% and a low average interval transit time of 54.4 us/ft. Its average density is 2.58 g/cm3, higher than the upper limit of effective reservoirs. These log features indicate a typical tight volcanic dry layer.
3 Identification methods
Through digital processing or log curve combination, the abnormal responses of logging curves in gas layers can be utilized to develop multiple methods for identifying hydrocarbon gas layers. These methods include the crossplot analysis, the curve-overlapping method, and the saturation calculation method [15,16].
1) The crossplot analysis
Based on single-curve or single-parameter identification principles, the crossplots for identifying volcanic gas layers and water layers include the neutron-density crossplot, neutron-acoustic wave crossplot, resistivity-porosity crossplot, and so forth [14]. On account of the complex volcanic reservoirs lithologies and the correspondingly variable logging responses, the crossplots for identifying volcanic gas and water layers must be established by taking the different lithologies into consideration.
As is shown in Figure 8.17, the resistivity-density log crossplot for different rocks in the gas testing interval in the DD gas field reveals the following features:
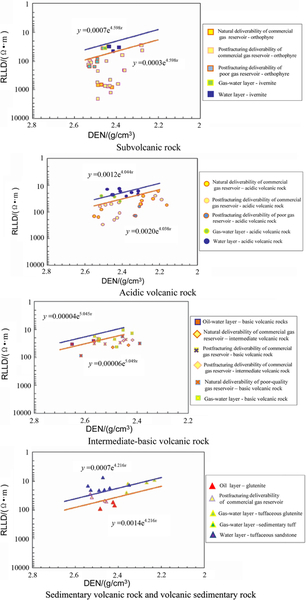
1. Volcanic gas and water layers have zoning characteristics: the water layers are located in the low-resistivity zone, the gas layers in the high-resistivity zone, and the gas-water layers in between.
2. For different volcanic rocks, gas, and water layers have different distribution characteristics in the crossplots. Subvolcanic gas layers have the highest resistivity and their distribution is the widest. Acidic volcanic gas layers have moderate resistivity and their distribution is similarly moderate. Intermediate-basic volcanic rocks have the lowest resistivity and their distribution is the narrowest.
3. For different volcanic rocks, the positions and slopes for the gas layer and water layer boundaries are different.
These results indicate that volcanic gas layers and water layers can be effectively identified by establishing crossplots for different lithologies.
2) The curve-overlapping method
Curve overlapping is a technique for evaluating reservoirs or fluid types based on curve separation [14], whereby uniform dimensions, grid scales, and baselines are used in the mapping of original logging curves or converted parameter curves, and the mapped curves are overlapped in certain direction. Based on the differences between the logging responses of gas layers and aquifers, the following curve-overlapping techniques can be used to identify volcanic gas layers and aquifers: neutron-density curve-overlapping, neutron-acoustic wave curve-overlapping, depth resistivity curve-overlapping, P-S velocity ratio and baseline overlapping, and the overlapping of gas-water boundaries determined by the crossplot method with resistivity curves or neutron curves. Again, the lithological differences must be considered when using the curve-overlapping method to identify volcanic gas and water layers. This method can be illustrated with Well XX23 (Figure 8.18).

In Well XX23, the middle-upper interval consists of rhyolite and the lower interval of welded breccia. In Figure 8.18, seven methods are used to indicate the gas-bearing properties of the reservoir, starting with the fifth trace. These seven methods include neutron and density overlapping, neutron and interval transit time overlapping, deep and shallow laterolog resistivity overlapping, FRG1 and deep laterolog resistivity overlapping, FRG2 and deep laterolog resistivity overlapping, FRG3 and neutron overlapping, and P-S velocity ratio and its gas layer ceiling overlapping. FRG1, FRG2, and FRG3 are the gas-water boundaries determined by the RLLD-DEN, RLLD-AC, and CNL-DEN crossplots. Figure 8.18 shows that, from top to bottom, the reservoir resistivity decreases, the low mud invasion weakens, neutron increases, and the overlapping area shrinks. These characters suggest that the gas-bearing properties become poorer from top to bottom. The two turning points, located at depths of 4011 m and 4042 m, respectively, correspond to the bases of the gas layer and the gas-water layer. During the gas testing carried out at the interval of 3909 to 3943 m, daily gas production reached 27.86 × 10⁴ m3 after fracturing. In the 30-day pilot production, the output stabilized at 10 × 104 m3/d and liquid production stood at 9.1 m3/d, with a flow-back rate of 97.76%. The target layer was thus confirmed to be a commercial gas layer. The water produced subsequently came from the water body beneath the reservoir via natural or artificial fractures.
3) The quantitative saturation interpretation methods
Based on interpretations of volcanic reservoir porosity and saturation parameters, two methods can be used to identify gas and water layers.
Saturation and porosity crossplot analysis
The gas saturation of a volcanic gas reservoir is positively correlated with the petrophysical properties and gas-bearing properties of the reservoir. The crossplot of gas saturation and effective porosity can be used to establish the saturation identification model for volcanic gas layers and water zones (Figure 8.19). It is effective for identifying the types of reservoir fluid in an untested interval.

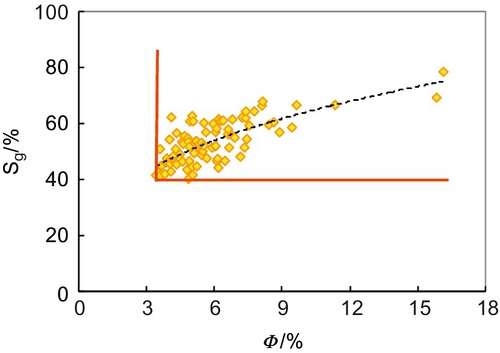
Original gas saturation cutoff method
The original gas saturation of a gas reservoir is positively correlated with the petrophysical properties of rocks. The cutoff criteria for the original gas saturation of effective reservoirs (about 40% for Block XX1) can be established based on crossplot analysis (Figure 8.20) and petrophysical property criteria. It allows engineers to use reservoir gas saturation to identify gas layers and water zones in volcanic rocks as well as to quantify the gas-bearing properties of the reservoir.
8.4 Volcanic gas layer and water zone identification: the comprehensive approach
To meet the challenges of identifying volcanic gas layers and aquifers, an integrative or comprehensive approach to identify volcanic gas layers and aquifers has been developed specifically for the complex geological conditions of volcanic gas reservoirs. As a principle, this approach is guided by geological concepts, based on integrated information, and validated by multiple methods, through an integration of logging, testing, and various logging interpretation techniques.
8.4.1 Establishment of gas-bearing property profiles for single wells by integrating single-well data
This approach integrates logging indicators, formation test results, and well log data to identify a reliable marker layer and establish gas-bearing property profiles for individual wells. This can be illustrated using Well XX9-1 as an example, which is a development well drilled at the second highest point in Block XX9. Prior to formation testing, the gas layers and aquifers in this well were tentatively identified on the basis of mud logging and well logging data, the gas-bearing properties were characterized qualitatively, and gas-bearing property profiles were established for individual wells (Figure 8.21).

1 Gas-bearing properties indicated by logging data
Gas logging (traces 3 to 6 in Figure 8.21) shows that layer 202I in the upper part of the borehole has the best gas-bearing properties. This layer has a maximum total-hydrocarbon content of 2.29%, a gas log ratio of 9.2 times, an absolute methane content of 5.16%, and a relative methane content of 73.5%. The calibrated logs have high amplitude and good continuity. These logging features indicate layer 202I as a gas zone.
2 Gas-bearing properties indicated by well log data
Only conventional log data were acquired from Well XX9-1, and six methods were used to characterize the gas-bearing properties of the reservoir (tracks 7 to 12 in Figure 8.21), including neutron and density overlapping, neutron and interval transit time overlapping, deep and shallow laterolog resistivity overlapping, FRG1 and deep laterolog resistivity overlapping, FRG2 and deep laterolog resistivity overlapping, and FRG3 and neutron overlapping. FRG1, FRG2, and FRG3 are the gas-water layer boundaries determined by the RLLD-DEN crossplot, the RLLD-AC crossplot, and the CNL-DEN crossplot, respectively. Figure 8.21 shows a general decline of gas-bearing properties from 3780 m downward in this well. Layer 202I in the upper part of the borehole is characterized by low resistivity, high neutron, low density, and high interval transit time. Except for the significant difference in deep and shallow laterolog resistivity values, the information of other gas-bearing properties is very weak and does not match logging indicators, resulting in great uncertainties about the gas and water layer interpretation for the reservoir.
8.4.2 Further characterization of gas-bearing properties for target layers through multiwell correlation
To resolve the identification uncertainties regarding the low-resistivity gas layers in volcanic gas reservoirs, a multiwell correlation profile can be established under the guidance of gas and water distribution patterns constrained by the internal structure of volcanic rocks. In this method, the gas-bearing properties of the target layers are characterized by means of comparative reservoir analysis to reduce the identification uncertainties about gas and water layers, as is illustrated later, again using Well XX9-1 as an example.
1 Establishment of multiwell correlation profile
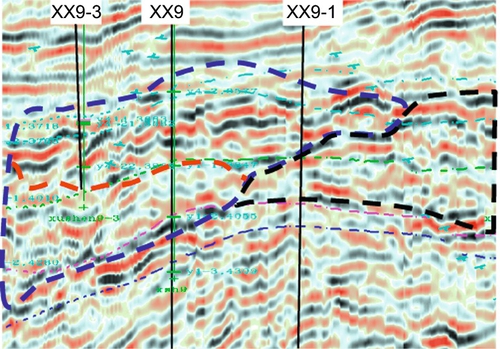
The volcanic gas reservoir in the Yingcheng Formation of Block XX9 is an anticline structure, with Well XX9 situated in the high point (Figure 8.22). The volcanic rock architecture shows that Well XX9-1 and the adjacent Wells XX9, XX9-2, and XX9-3 penetrated the same volcanic massif, with their major gas zones all located in the third cycle, and the wells are interconnected (Figure 8.23). Based on these findings, a correlation profile was established for Wells XX9-3, XX9-2, XX9, and XX9-1 (Figure 8.24).

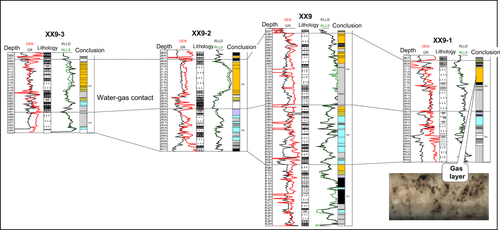
2 Comparative reservoir interpretation
The results of gas and water layer interpretation from adjacent wells and gas testing confirm that the volcanic rock unit has a uniform water-gas contact and the target layer of Well XX9-1 is 100 m higher than the water-gas contact. Based on the gas and water distribution characteristics of the gas reservoir in this volcanic massif, namely upper gas and lower water, layer 202I in Well XX9-1 is interpreted as a gas zone.
3 Integration of multiple data to validate the characterization of low-resistivity gas layers in the target zone
The results from core observation, petrophysical property analysis, and log interpretation indicate that the target layer of Well XX9-1 is rhyolite with well-developed vesicles and fractures. The reservoir has good physical properties, with an effective porosity of 8% and deep invasion of drilling fluid.
The salinity of the water sample in an adjacent well was consistent with that of the formation water in the area, and no signs of abnormal high salinity were detected.
Drilling data from that well indicate that, prior to logging, the target zone had been soaked in mud for 128 days (about 3081 hours), allowing for deep mud invasion.
After a comprehensive analysis, layer 202I in Well XX9-1 is interpreted as a low-resistivity gas layer based on deep mud invasion, which validates the results of logging indications and geological interpretation. It also explains the log indications of poor gas-bearing properties.
8.4.3 Validating interpretation results through formation tests and improving interpretation models, providing a basis for the interpretation of new wells
In June 2007, perforation gas testing was carried out in the 3717 to 3722 m and 3757 to 3761 m intervals of Well XX9-1. Under the MFE I + TCP + natural flowing system, daily gas production reached 0.09 × 10⁴ m3. Natural flowing started after fracturing and the daily gas production reached 10.2 × l04 m3 with a 7.94-mm choke. The tubing pressure was 10.36 MPa. The total salinity of produced fluids was 21,000 to 27,000 ppm, which was inconsistent with the water properties in the area (7400 to 9900 ppm), and the flow-back rate of fracturing fluid was 59.69%, including fracturing fluid and filtrate. Therefore, the testing demonstrated that these two layers are commercial gas layers and no formation water is produced. This conclusion is consistent with the results of the comprehensive interpretation.
While validating the interpretation results, the formation test data from the well further enriched gas testing information for Block XX9, which facilitated the improvement of interpretation models for volcanic gas and water layers and provided a more robust model to be applied to the interpretation of new wells.