
Lithological Identification and Prediction of Volcanic Rock
Lithology consists of characteristics such as rock color, composition, texture, and structure. For volcanic reservoirs, lithology is one of the factors that control reservoir space and other properties. Based on the schemes of rock classification and nomenclature, volcanic lithology can be identified according to logging identification models for composition, texture, and the structure of various types of volcanic rocks, and by integrating elemental capture spectroscopy (ECS) element logging, acoustic, and electric image logging and conventional logging. Through calibration of seismic data based on well logs and analysis of seismic responses of different lithologies, volcanic lithology can also be predicted based on seismic reflector profile analysis, waveform classification, frequency-divided inversion, and other techniques. The lithological distribution patterns thus revealed can provide the basis for volcanic lithofacies division, reservoir parameter calculation, gas layer and aquifer identification, and effective reservoir prediction.
5.1 Challenges and solutions
5.1.1 Challenges in lithology identification and prediction
Compared with sedimentary rocks, volcanic rocks are more varied, with more complex compositions, textures, and structures, resulting in various challenges in their lithological identification and prediction.
1 Difficulties in accurate identification of rock composition based on log data
Volcanic rocks contain almost all existing elements and cationic oxides in the earth’s crust [1–3], characterized by complex chemical compositions (e.g., SiO2 ranging from 34% to 77%, MgO 0.06% to 46%) and a great variety of rock-forming minerals rock types (> 1000 varieties) [4–6].
Conventional logs do not measure lithological compositions directly but merely provide volcanic lithological information indirectly by measuring parameters such as rock radioactivity, bulk density, acoustic wave propagation characteristics, and conductivity. ECS logs can measure the elemental contents of formations through neutron-capture gamma ray spectroscopy, but the measurements are error prone because it is easily affected by borehole environment and ionic composition and concentration in formation water, thus posing challenges in accurate identification of rock compositions using log data.
2 Difficulties in accurate identification of rock texture and structure using well log data
The texture and structure of volcanic rocks are highly variable, with complex origins. Acoustic and electric imaging logs can reflect the textural and structural features of volcanic rocks indirectly through borehole imaging that reflects the acoustic property and conductivity, but the log interpretation is often ambiguous. Furthermore, the resolution of imaging log is inversed related to the probing depth. When the resolution of full-bore micro scanner imager (FMI) logging is high, the probing radius becomes smaller, affected by borehole conditions, formation fluids, and other factors. In comparison, the probing radius of array resistivity imager (ARI) logging is large, but the resolution is low. Therefore, it is difficult to accurately identify the texture and structure of volcanic rocks using imaging logs.
3 Difficulties in predicting lithological distribution
Volcanic rocks are characterized by a rapid and prominent change in their thickness, from less than 1 m to several thousand meters. Because of the low resolution of seismic data, the lithological prediction of thin layers tends to carry large errors. In addition, various volcanic lithologies may be represented by differences in either rock composition or petrophysical properties. Some volcanic rocks (such as volcanic breccia and rhyolite) with the same composition and small differences in physical property will also have minor differences in petrophysical property. Thus, it is difficult to predict the lithological distribution because of the small differences in seismic response to different lithologies and in the seismic reflector of lithological interfaces in syngenetic volcanic rocks.
5.1.2 Technical solutions
Through integration of geological, logging, and seismic data, technical approaches can be established by incorporating technical solutions of hierarchical identification and multiple prediction methods (Figure 5.1). Following this process, the lithological identification and prediction techniques for volcanic reservoirs are developed, which provide a basis for lithofacies identification, reservoir parameter interpretation, and gas layer and aquifer identification.

1 Classification and nomenclature of volcanic rocks
Petrographic analysis is carried out first based on core data, geochemical analysis, and thin section information. This is followed by the identification and classification of volcanic rocks using the “component + texture + genesis” scheme.
2 Lithological identification of volcanic rocks based on well logs
A volcanic rock identification scheme can be established by using core data to calibrate well log data. The procedure is as follows: (1) building an identification scheme for rock composition using ESC and conventional log curves (GR, DEN, compensated neutron log (CNL)); (2) building an identification scheme for rock texture and structure with acoustic and electric imaging logs; and (3) building a well logging response model for volcanic lithologies according to the scale, shape, and smoothness of conventional log curves. Afterward, integrated lithological identification can be conducted in noncored intervals with the above identification schemes and models.
3 Distribution prediction of volcanic lithology
Seismic data can be calibrated by lithological information from single wells; the response characteristics of lithology with near-wellbore seismic traces can be analyzed, and seismic response models of different volcanic rock can be established. After these steps, the lithological distribution pattern can be predicted by seismic attribute analysis, waveform classification, and seismic inversion.
5.2 Identification of volcanic lithology
With reference to existing research results [7–10], volcanic lithology can be identified by integrating ECS element logs, FMI imaging logs, and conventional logs, following the conventional scheme of rock classification and nomenclature (i.e., the “composition → texture → rock type” scheme) and using methods such as graphic analysis, crossplot of curves, superposition of curves, and multivariate clustering.
5.2.1 Identification of volcanic rock composition through ECS logging
ECS logging can record inelastic scatter gamma spectra and capture gamma spectra through fast neutron-induced inelastic scattering capture nuclear reaction in the formation. Based on spectral unscrambling analysis, the percentage of rock-forming elements in the formation can be determined, which provides a basis for identifying rock composition [11].
1 Identification principle
ECS logs measure the relative number (or relative yield) of the electrical pulses that were caused by the gamma ray. According to the processing of the oxide-closure model and geological calibration, the relative number (or relative yield) can be transferred to the weight percentage of the elements and oxides in rocks.
1) Determining the weight percentage of elements using the oxide-closure model
In the oxide-closure model, the total weight percentage of all elements in the minerals is 100% and the total weight percentage of oxides and carbonates is also 100%. Then the formula for a given depth is expressed by [12]

Where F— the normalizing factor at each depth;
Xi—mass ratio of oxides or carbonates to corresponding element i;
Yi—relative yield of element i;
Si—the detector’s sensitivity factor to element i, corresponding to the concentration of the element and Yi.
The key of this model lies in the determination of the elements present in the matrix but not in the fluid. The calculated results are the weight percentage of the elements.
2) Calculate the oxide contents by establishing the relationship between element contents and mineral contents
Statistical methods can be applied to analysis of the core data from various sources to summarize the relationship between the element abundance and oxide content on the premise that all the mineral elements are stable:
Then,
Where
M—column matrix of the weight percentage of oxides;
E—column matrix of element abundance;
C—coefficient matrix.
The percentage of various oxides can be calculated by this matrix equation. However, two aspects should be taken into consideration [11,12]: (1) the measured elements should be those that can represent the characteristics of this mineral (e.g., Si can be an indicator for quartz), and (2) the number of oxides to be determined must be less than the number of measured elements.
2 Logging response characteristics of volcanic rocks with different compositions
Based on the composition classification of volcanic rocks, ECS log data can be calibrated to analyze the responses of volcanic rocks with different compositions, so as to establish an ECS identification model for rock composition.
From ECS log curves (Figure 5.2), it can be found that Si, Al, Fe, Ti, K, and Na are the typical elements for determining the compositional variation in volcanic rocks, and Ca, S, and Gd are relatively insensitive elements. Basic volcanic rocks are characterized by “low Si, low K, low Na, high Al, high Fe, and high Ti.” In contrast, acidic volcanic rocks have “high Si, high K, high Na, low Al, low Fe, and low Ti,” and intermediate volcanic rocks fall between these two rock types (Table 5.1). Accordingly, oxides in basic volcanic rock are represented by “low SiO2, low K2O, low Na2O, high Al2O3, high (FeO + Fe2O3), and high TiO2,” whereas acidic volcanic rocks are the opposite, and intermediate volcanic rocks fall in between. From basic to acidic volcanic rocks, therefore, there is an increase in Si content, a decrease in Al, Fe, and Ti, an increase in SiO2 and Na2O + K2O, and a decrease in Al2O3, (FeO + Fe2O3) and TiO2 among the major oxides (see Table 5.1).


3 Identification method
Building on the logging response analysis discussed earlier, volcanic rock compositions are determined using a crossplot analysis of element contents and total alkali versus silica (TAS) plot analysis.
1) Crossplot analysis of element contents
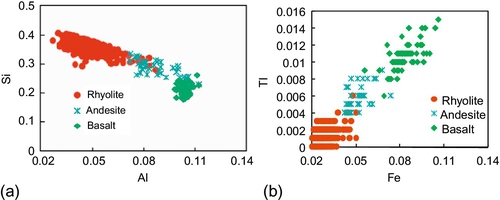
Basic, intermediate, and acidic volcanic rocks can be differentiated quantitatively through crossplot of element contents in volcanic rocks with different composition, as reflected by logging responses [13].
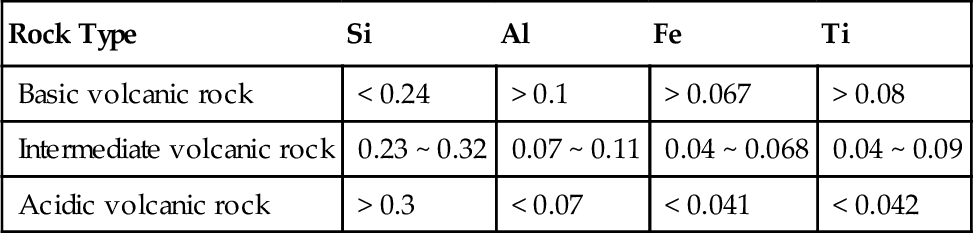
As an example from the case study of XX gas field, Figure 5.3 is a crossplot of elemental contents in volcanic rocks with different compositions in the ECS log, with Table 5.2 providing the ranges of elemental contents in volcanic rocks with different compositions in the ECS log. These data demonstrate that, on a scale of 0 to 1, the basic volcanic rocks have Si content values less than 0.24, Al more than 0.1, Fe more than 0.067, and Ti more than 0.08; acidic volcanic rocks have Si values greater than 0.3, Al less than 0.07, Fe less than 0.041, and Ti less than 0.42; the values of elemental contents for intermediate volcanic rocks fall between those for the basic and the acidic volcanic rocks.
2) TAS plate analysis of oxides contents
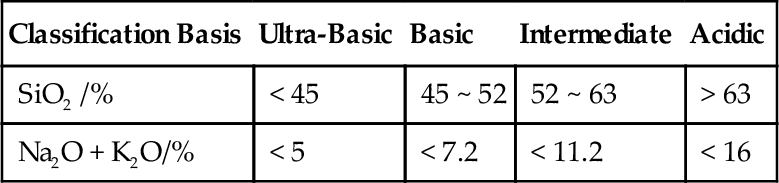
TAS plate was recommended to be a part of the volcanic rock classification scheme at the 28th International Geological Congress of the International Union of Geological Science (IUGS) in 1989 [1]. In this analysis, SiO2 content is plotted on the x-axis, representing the acidity of a volcanic rock, and Na2O + K2O contents are plotted on the y-axis, representing the alkalinity (Figure 5.4a). On a TAS plate, 15 fundamental types of volcanic rock can be divided on the basis of geochemical analysis.

Figure 5.4 and Table 5.3 are the TAS plates and classification schemes for the volcanic rocks in XX gas field. For the basic rocks, the SiO2 contents range from 45% to 52%, and Na2O + K2O less than 7.2%; for the intermediate rocks, the contents of SiO2 have a range of 52% to 63%, and Na2O + K2O less than 11.2%; for acidic rocks, SiO2 contents are more than 63%, and Na2O + K2O less than 16%. In terms of the SiO2 and Na2O + K2O values, the volcanic rocks can be subdivided into basalt, trachybasalt, basaltic andesite, andesite, trachyandesite, dacite, trachydacite, and rhyolite. The contents of oxides can be determined using ECS log data, and the volcanic rocks can be classified on the basis of rock composition in the TAS plates.
5.2.2 Identification of volcanic rock texture and structure by imaging log
Acoustic imaging logging can scan the borehole wall and record the echo waves using a rotational ultrasonic transducer. A microresistivity scanning image log can cover the borehole wall and measure several microresistivity curves with a microelectrode array. Thus, borehole wall images can be obtained by interpreting the propagation characteristic of acoustic waves and conductivity in the formation [14,15]. Based on these borehole wall images, the texture and structure of volcanic rocks can be identified effectively.
1 Identification principle
By measuring the amplitude and travel time of the reflected waves from a borehole wall, the acoustic image logs can display the images in 360 degrees around the borehole to form high-resolution images of the entire borehole wall. In general, longer acoustic travel time and lower acoustic energy of the reflected waves are correlated with darker colors. Microresistivity scanning image logs transfer each microresistivity curve into colors to form an electric image reflecting the formation conductivity. Greater conductivity and lower resistivity of a formation are rendered into a darker color.
Acoustic and electric image logs can clearly reflect various geological features of subsurface rock formations. However, the images are false-color images of the borehole, and it is necessary to first establish an interpretation model of acoustic characteristics and conductivity on the basis of core calibration before the texture and structure of volcanic rock can be identified effectively.
Among resistivity imaging logs, FMI imaging logs have a relatively high resolution, as is reflected by the wide use of FMI today for volcanic rock imaging. Therefore, this book focuses on the technique of texture and structure identification for volcanic rocks using FMI logging.
2 Identification model of volcanic rock texture and structure
Based on the determination of texture and structure by core data, imaging log data can be calibrated to analyze the FMI logging response of different rock textures and structures and to further establish an image identification model for rock textures and structures. The maximum resolution of imaging log is 0.2 inch (about 5 mm), implying that only relatively large-scale rock textures and structures can be identified, such as rhyolitic structure, agglomeratic texture, brecciated texture, and welded texture (Figure 5.5, Table 5.4).

Table 5.4
FMI Imaging Log Response Characteristics of Typical Textures and Structures in Volcanic Rocks
| Type of Texture and Structure | Geological Origin | Response Characteristics in FMI Imaging Log | |||
| Color | Shape | Image Texture | |||
| Volcanic lava | Vesicular structure | Volatile constituents escape during volcanic eruption | Black | Spot | Uniform clumpy |
| Rhyolitic structure | Flow of magmatic melt causing oriented arrangement of vesicules | Dark or light color | Oval spot | Laminar | |
| Volcaniclastic lava or welded volcaniclastic rock | Welded tuff texture | Magmatic debris being squashed and elongated, arranged in nearly identical direction | Yellow- white | Deformed band | Laminar -like |
| Welded brecciated texture | Breccia is composed of rhyolite, filled with volcanic ash or volcanic breccia welded by melt | Yellow- white | Mottling | Irregular clumpy | |
| Volcaniclastic rock | Agglomeratic texture | Volcanic debris sizes more than 64 mm | Yellow- white | Angular mottling | Irregular clumpy |
| Brecciated texture | Volcanic debris sizes 2-64 mm | Light yellow | Angular grain | Irregular clumpy | |
| Tuff texture | Volcanic debris sizes less than 2 mm | Red | Spot | Clumpy | |

1) Structures in volcanic lava
Typical structures in volcanic lava are vesicular and rhyolitic.
1. Vesicular structure. This is formed by the escaping volatile constituents during volcanic eruption, manifesting as relatively regular black spots (with an overall clumpy appearance) in FMI images (Figure 5.6, Table 5.4).

2. Rhyolitic structure. This is formed by the oriented vesicular and almond-shaped structure caused by magmatic flow. Usually some degree of deformation will occur when the magma bypasses quartz and orthoclase phenocrysts. Individual vesicles or almond structures appear as oval spots in FMI images, with an overall alternation of dark and light bands, resembling laminar stratification (see Figure 5.6, Table 5.4).
2) Texture of volcaniclastic lava or welded volcaniclastic rock
Welded Tuff Texture
This is the typical texture of tuff lava and welded tuff, formed by squashing and elongation of vitric fragments and magmatic fragments with plastic deformation along the flowing direction of magma, appearing as tiny spots with deformed bands in a light color (yellow-white) and an overall laminar appearance in FMI images (see Figure 5.5, Table 5.4).
Welded brecciated texture
This is typical of breccia lava and welded breccia of two petrogeneses: (1) breccia that consists of rhyolite and is infilled with volcanic ash; and (2) volcanic breccia welded by plastic magma with blurred edges. In FMI images, the volcanic breccia appears as light-colored (yellow-white) spots with soft edges, the infilled volcanic ash as minute spots (dark colors alternating with light colors), and the plastic magma as irregular bands (which were elongated and deformed along the flowing direction). In general, volcanic rocks with welded brecciated texture have an irregular clumpy appearance in FMI images (see Figure 5.5, Table 5.4).
3) Texture of volcaniclastic rocks
Characteristic volcaniclastic rock textures are agglomeratic, brecciated, or tuffaceous (see Figure 5.5, Table 5.4).
1. Agglomeratic texture. Volcanic clasts are more than 64 mm in size; individual agglomerates appear as yellow-white angular mottling in FMI images, with an overall irregular clumpy look.
2. Brecciated texture. Volcanic clasts are 2 to 64 mm in size; individual clasts appear as yellow-white angular grains in FMI images, also with an overall irregular clumpy appearance.
3. Tuffaceous texture. Volcanic grain size is less than 2 mm; this type of texture is represented by minutes, black and white spots in FMI images, but in general it is only a relatively coarse grained (e.g., crystalline-vitric) tuff and plastic deformation characteristics can be recognized.
3 Identification method
Based on the preceding identification model, volcanic rock texture and structure can be identified in the following steps:
1. Analyze the response characteristics of the imaging log, and divide the interpreted horizons according to the similarity principle.
2. Calculate the indicative curve of resistivity changes (represented by the changes in corresponding colors), and determine a cutoff threshold to depict the abnormal area in the image (see Figure 5.6).
3. Analyze the petrogenesis of abnormal areas, and match the identification model to confirm the texture and structure (see Figure 5.6).
5.2.3 Identification of volcanic rock types by conventional logging
Conventional logs include caliper, spontaneous potential (SP), gamma ray, three porosity logs (density, neutron, and acoustic travel time logging), and three resistivity logs (deep lateral, shallow lateral, and microspherical focused logging, or deep induction, medium induction, and laterolog 8 logging), with the spectral gamma log and dipmeter log as the supplements for complex strata [15,16]. Based on the principle of logging identification and petrogenesis, the lithological logging response model can be established by analyzing the scale, shape, and assemblage relationships of conventional log curves for different lithologies to identify volcanic rock types.
1 Identification principle
1) Gamma ray and spectral gamma logs
Gamma ray logs can measure the total natural radioactivity of the formation. In general, radioactivity increases from basic to acidic rocks; and the radioactivity of subaqueous eruptive volcanic rock is stronger than that of other volcanic rocks with the same composition.
Spectral gamma logs can be used further to determine the relative contents of U, Th, and K. The K content is controlled mainly by the potassium feldspar content, and hence the rock composition; the U content is related to the organic absorbency of the rocks; and the Th content is mainly absorbed and retained in clay minerals, which can represent the contents of clay minerals. In general, U and Th contents in volcanic reservoirs decrease from basic rocks to acidic rocks, which are poor in the early stage and relatively abundant in the later stage of magmatic evolution.
2) Three porosity logs
Based on Compton scatter principle between gamma ray and the formation, density logging can measure the bulk density of the formation by measuring the electron density index; neutron logging can survey the hydrogen contents of the formation based on the thermal-neutron capture principle [17]; acoustic travel time logging can measure the propagation velocity of longitudinal waves in the formation based on the principles of slide wave propagation along borehole wall [18]. Porosity logging curves are related to changes in lithology, physical property, fractures, and fluid properties. In general, basic volcanic rocks have higher density and neutron responses than acidic volcanic rocks, with intermediate volcanic rocks in between.
3) Resistivity log
Rock conductivity is related to many factors, such as conductive mineral content in rock matrix, clay types and contents, development of pores and fractures, formation fluid types, and so on. Because volcanic rocks have a low clay mineral content and relatively low porosity, the values and curve shapes of the resistivity log can reflect the rock types relatively well.
2 Well logging response characteristics of volcanic rocks with different lithologies
Volcanic rocks with different compositions have different response characteristics in conventional logs
1) Response characteristics of volcanic rocks with different compositions in conventional logs
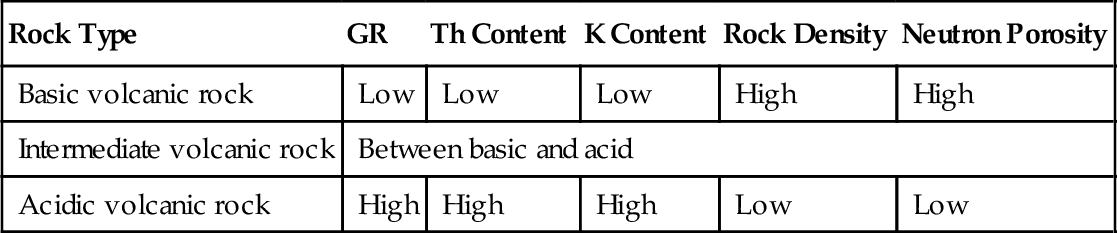
Basic volcanic rocks are characterized by “low radioactivity, low Th content, low K content, high density, and high neutron porosity” (Figure 5.7, Table 5.5), and acidic volcanic rocks by “high radioactivity, high Th content, high K content, low density, and low neutron porosity,” whereas intermediate volcanic rocks fall in between. From basic to acidic rocks, there are general tendencies of “radioactivity increase, Th and K content increase, and density and neutron porosity decrease.”

2) Conventional log response characteristics of volcanic rock of different petrogenses
In terms of their petrogenesis, volcanic rocks with the same composition can be divided into volcanic lava, volcaniclastic rock, and volcaniclastic lava. Volcaniclastic rocks can be subdivided into volcanic agglomerate, volcanic breccia, and volcanic tuff by grain size. Taking volcanic gas reservoir in the CC gas field as an example, conventional log response characteristics of volcanic rocks of different petrogeneses have been analyzed from three aspects (amplitude, shape, and smoothness of the curves; Table 5.6).
Table 5.6
Conventional Log Response Characteristics of Volcanic Rock (CC Gas Field)
| Rock Type | Amplitude | Shape | Smoothness | |||||||
| GR | DEN | Resistivity | TH/K | Box | Funnel | Bell | Smooth | Microserrated | Serrated | |
| Rhyolite | Medium-high | Medium-high | High | Low | 55.6 | 33.3 | 11.1 | 22.2 | 33.3 | 44.4 |
| Brecciated lava | Medium-low | Low | Low | Medium | 20 | 50 | 30 | 50 | 40 | 10 |
| Welded breccia | High | High | Medium | High | 50 | 0 | 50 | 0 | 0 | 100 |
| Welded tuff | Medium | Medium | Medium | High | 20 | 20 | 60 | 40 | 60 | 0 |
| Crystalline tuff | Low | Medium-low | Low | Low | 66.7 | 33.3 | 0 | 33.3 | 66.7 | 0 |
| Volcanic breccia | High | Medium | Low | High | 66.7 | 33.3 | 0 | 0 | 33.3 | 66.7 |
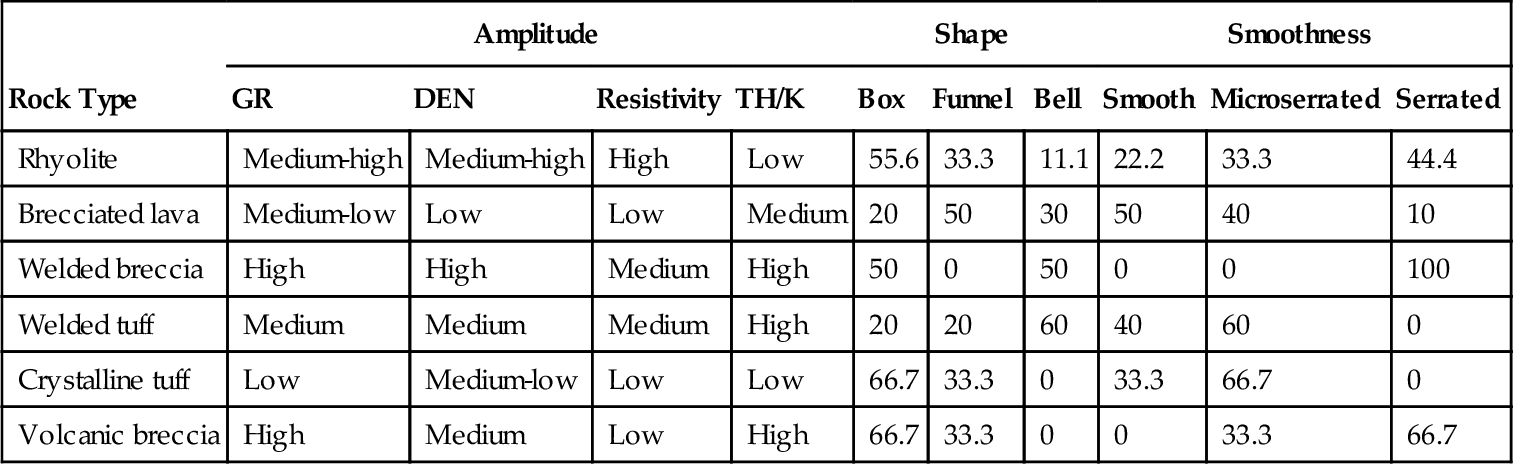
Value range
Rock types can be distinguished by curves of gamma ray, density, and resistivity logs, as well as the combined TH/K curve of (see Table 5.6). Rhyolite has medium-high GR, DEN, and resistivity, low TH/K; in contrast, breccia lava has medium-low GR, DEN and resistivity, medium TH/K; welded breccia is characterized by “high GR, high DEN, medium resistivity and high TH/K”; welded tuff by medium GR, DEN, resistivity, and TH/K; crystal tuff by “low GR, medium-low DEN, low resistivity, and low TH/K,” and volcanic breccia by “high GR, medium DEN, low resistivity and high TH/K.”
Curve shapes
The three major curve shapes are cylinder, funnel, and bell. According to the statistical results in the CC gas reservoir, the cylinder shape is most typical of rhyolite, crystalline tuff, and volcanic breccia, which accounts for 55.6%, 66.7%, and 66.7%, respectively, and the funnel shape ranks second for these lithologies, accounting for about 33.3%. Brecciated lava is dominated by the funnel shape (accounting for about 50%), and the bell shape is second (about 20%). Welded breccia is dominated by cylinder and bell shapes, accounting for about 50% each. Welded tuff is dominated by the bell shape, accounting for about 60%, with about 20% consisting of cylinder and funnel shapes.
Curve smoothness
Volcanic reservoirs have strong heterogeneity, and the corresponding logging curves are dominated by microserrated shapes (about 44%) and serrated shapes (about 32%). Rhyolite is dominated by serrated shapes (about 44.4%) and microserrated shapes (about 33.3%); brecciated lava is dominated by smooth (about 50%) and microserrated (about 44%) shapes; welded breccia is dominated by serrated shapes; welded tuff and crystalline tuff are dominated by microserrated shapes (about 60% and 66.7%, respectively) and smooth shapes (about 40% and 33.3%, respectively); and volcanic breccia is dominated by serrated shapes (about 66.7%) and microserrated shapes (about 33.3%).
3 Identification method
The identification method for volcanic rock types using conventional logs includes the bivariate crossplot, principal component analysis, neural network, fuzzy clustering, and the like.
1) Bivariate crossplot analysis
Based on the crossplot of two variables, the differences in logging response of different rock types can be determined to establish the identification criteria. Based on conventional log data, volcanic rock types can be identified in two steps following the technical approach of “compositions first and structure-petrogenesis second.”
Type identification based on differences in rock composition
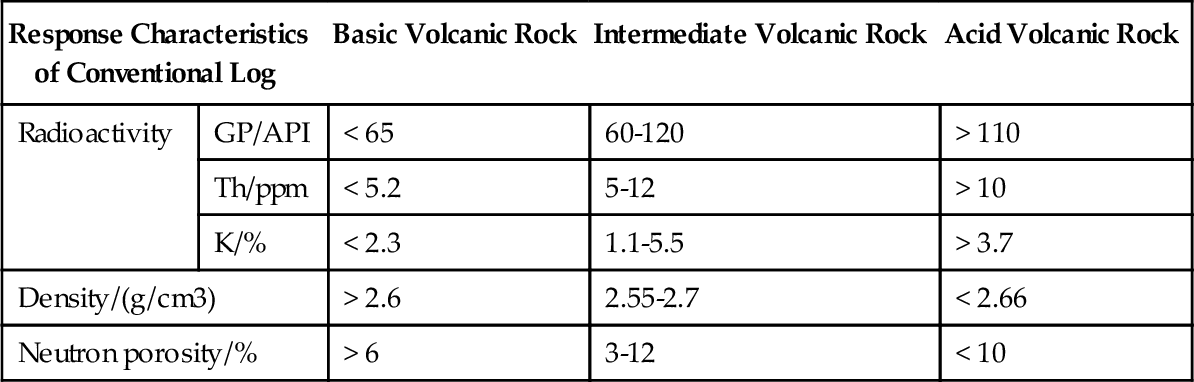
The variety of volcanic rock composition is distinguished mainly by differences in radioactivity, density, and hydrogen contents of the rocks [19]. As is shown in Figure 5.8 and Table 5.7, the GR values of basic volcanic rocks are usually less than 65 American Petroleum Institute unit (API), Th content is less than 5.2 ppm, K less than 2.3%, rock density more than 2.6 g/cm3, and neutron porosity more than 6%; the GR values of intermediate volcanic rocks are 60 to 120 API, Th content is 5 to 12 ppm, K 1.1% to 5.5%, rock density 2.55 to 2.7 g/cm3, and neutron porosity 3% to 12%; and the GR values of acidic volcanic rocks are more than 110 API, Th content is more then 10 ppm, K more than 3.7%, rock density less than 2.66 g/cm3, and neutron porosity less than 10%.
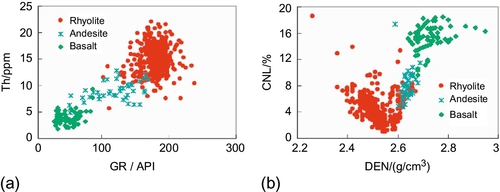
Table 5.7
Value Range of Conventional Log Curves for Volcanic Rocks with Different Compositions (XX Gas Field)
| Response Characteristics of Conventional Log | Basic Volcanic Rock | Intermediate Volcanic Rock | Acid Volcanic Rock | |
| Radioactivity | GP/API | < 65 | 60-120 | > 110 |
| Th/ppm | < 5.2 | 5-12 | > 10 | |
| K/% | < 2.3 | 1.1-5.5 | > 3.7 | |
| Density/(g/cm3) | > 2.6 | 2.55-2.7 | < 2.66 | |
| Neutron porosity/% | > 6 | 3-12 | < 10 | |
Lithological identification based on differences in rock texture and petrogenesis
This process is illustrated by the case study of the acidic volcanic rocks in Well Block XX1 (Figure 5.9, Table 5.8).

Table 5.8
Value Range of Log Curves for Volcanic Rocks of Different Petrogenesis (Well Block XX1)
| Lithology | GR/API | PE/(b/e) | U/ppm | TH/ppm | K/% | CNL/% | DEN/(g/cm3) | RLLD/ (Ω.m) |
| Rhyolite | 131-170 | 2.9-3.5 | 0.9-3.9 | 11.8-21.2 | 3.7-5.1 | 0.07-4.6 | 2.42-2.65 | 800-4600 |
| Brecciated lava | 122-150 | 3.3-4.3 | 0.3-3.6 | 16.5-29 | 2.9-5.6 | 3.3-18 | 2.3-2.5 | 25-210 |
| Welded breccia | 175-212 | 3.9-4.9 | 7-13.3 | 20-28 | 2.7-5.2 | 2.56-4 | 2.49-2.6 | 200-650 |
| Welded tuff | 138-158 | 3.1-3.6 | 0.4-2.9 | 13-20 | 3-4.8 | 2.2-3.7 | 2.4-2.52 | 320-700 |
| Crystalline tuff | 100-140 | 2.9-3.1 | 1.7-5 | 13.6-16.5 | 3.6-4.7 | 8-10.8 | 2.38-2.44 | 20-24 |
| Volcanic breccia | 150-220 | 3.1-4.1 | 2-11.4 | 14-20 | 2-4.8 | 4-8 | 2.42-2.59 | 26-176 |
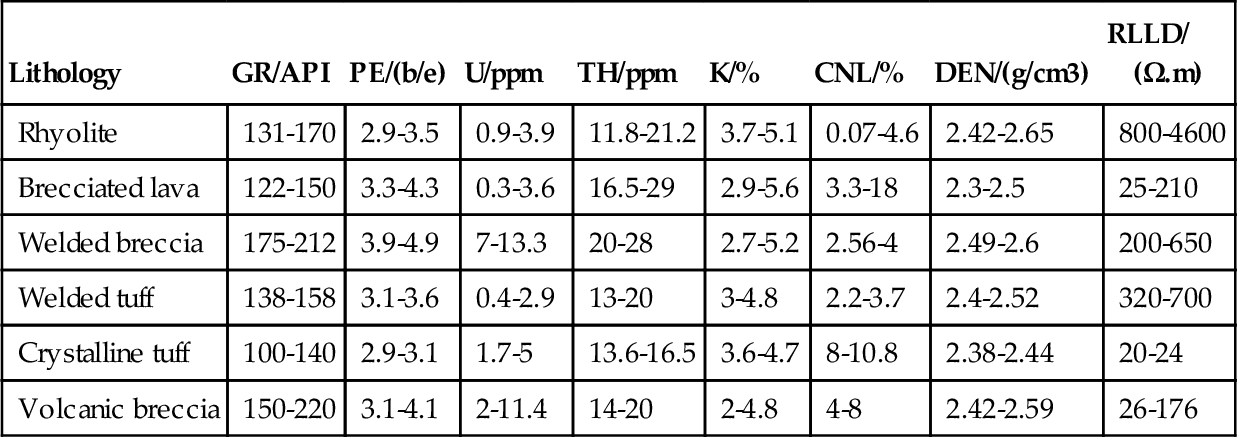
Acidic lava is characterized by high GR, low U, low Th, high K, low neutron, high density, and high resistivity, as are indicated by GR values of 131 to 170 API, photoelectric absorption cross-section index (PE) 2.9 to 3.5, U content 0.9 to 3.9 ppm, Th content 11.8 to 21.2 ppm, K content 3.7% to 5.1%, CNL 0.07% to 4.6%, DEN 2.42 to 2.65 g/cm3, and recorded value of laterolog deep (RLLD) 800 to 4600 Ω m.
Welded breccia has the characteristics of high GR, high U, high Th, low K, low neutron, medium density, and medium resistivity, as are shown by GR values of 175 to 212 API, PE 3.9 to 4.9, U content 7 to 13.3 ppm, Th 20 to 28 ppm, K 2.7% to 5.2%, CNL 2.56% to 4%, DEN 2.49 to 2.6 g/cm3, and RLLD 200 to 650 Ω m.
Among the volcaniclastic rocks, tuff typically has low GR, medium U, high Th, high K, high neutron, low density, and low resistivity, as evidenced by GR values of 100 to 140 API, PE 2.9 to 3.1, U content 1.7 to 5 ppm, Th 13.6 to 16.5 ppm, K 3.6% to 4.7%, CNL 8% to 10.8%, DEN 2.38 to 2.6 g/cm3, and RLLD 20 to 24 Ω m.
In general, volcanic lava can be diagnosed by high radioactivity, high K content, high density, low neutron, and high resistivity. In contrast, volcaniclastic rocks have high U, high Th, high neutron, low density, and low resistivity, although they also have high radioactivity. These values for welded volcaniclastic rocks fall between the two rock types discussed earlier. Among volcaniclastic rocks, volcanic breccia has the characteristics of high radioactivity, low K content, low neutron, and low density, in comparison to volcanic tuff.
2) Principal component analysis
Principal component analysis is also called R-factor analysis, which can generalize and classify log data in terms of petrogenesis by using a relatively few variables with the least information loss. Principal component analysis can transfer a set of relevant initial variables into a set of mutually orthogonal variables by orthogonal transformation:
Where
Where
Yi—principal component variables;
ωi—unit orthogonal eigenvector, of which the eigenvalue represents variance, usually ranked in the order of size;
m—number of initial variable, represents the number of well log curves that were adopted for lithology identification;
n—Number of samples for model building.
The first principal component among these new m variables constitutes the largest variance and maximum interpreted information; the second principal component has the second largest variance, and so forth; when the sum of the variance of the front p principal components is much more than the sum of the latter m-p principal components, the effect of the latter m-p principal components can be ignored, so as to achieve an effective interpretation and reduce the space dimensionality at the same time [8,20].
Five steps of principal component analysis
1. Selecting initial variables. According to the integrated analysis of well logs and geological data, the logs selected for volcanic rock identification include gamma ray, spectral gamma, density, neutron, sonic, and deep probing resistivity (deep laterolog or deep induction) logs.
2. Data normalization. After normalization, all logging values are converted to a scale of 0 to 1 to eliminate the weighting effects of logging dimensions and absolute values.
3. Calculating the covariance matrix on the basis of the relevant relationships among logging curves.
4. Calculating the eigenvalue of the covariance matrix and corresponding unit eigenvector by the Jacobi method.
5. Calculating the contributions of each principal component to establish the loading diagram of variables and rock samples.
Figure 5.10 shows the principal component analysis of volcanic rocks in Well Block XX9, XX gas field, where (a) and (b) are the variable loading diagram and the rock sample loading diagram, respectively. From this figure, the following can be determined:

1. The eigenvalue of the first principal component (F1) is 4.06, accounting for 55.7% of total variance. The left side of F1 is resistivity and GR, and the right side is neutron porosity, reflecting the changes in physical property and total intensity of radioactivity. The eigenvalue of the second principal component (F2) is 1.85, accounting for 28.1% of total variance and reflecting the changes in U, Th, and K contents.
2. The total eigenvalue of F1 and F2 accounts for 83.8% of total information, so that the crossplot of F1-F2 can be used to identify the basalt, andesitic tuff, dacite, vesicular rhyolite, and volcanic breccia effectively.
5.2.4 Integrated lithological identification
The lithology in single wells can be identified based on the identification model of composition, texture, and structure, using ECS element logging, FMI imaging, and conventional logs to determine the vertical characteristics of volcanic lithology, thus providing a basis for lithology prediction. The technique and methods can be illustrated using Well XX7 as an example for integrated identification of volcanic lithology using multiple data sources (Figure 5.11).

1 Identification of volcanic rock composition
Volcanic rock compositions can be determined by integrating ECS element logging, conventional gamma ray logging, gamma spectrometry, and compensated neutron logging as proxies for elemental content, oxide content, radioactivity, and the separation between density and neutron porosity logs in volcanic rocks with different compositions.
According to the response characteristics of ECS and conventional logs, three types of volcanic rocks with different compositions are recognized in Well XX7 (see Figure 5.11, the fourth trace). In the upper part (3850 to 4358 m), the average Si content is 36%, Al 5%, Fe 3%, Ti 0.2%, and SiO2 77%; and the average GR value is 154 API, rock density 2.5 g/cm3, and the average CNL 4.7%; gamma ray spectrometry (GRS) shows the characteristics of low U, high K, and high Th. These values indicate acidic volcanic rocks in this part of the well. In the middle part (4358 to 4410 m), the average Si content is 28%, Al 8.6%, Fe 5%, Ti 0.6%, and SiO2 41%; the average GR is 100 API, rock density 2.62 g/cm3, and average CNL 8%; GRS is characterized by medium U, medium K, and medium Th. These values indicate an intermediate type of volcanic rock in the middle part. In the lower part (4410 to 4510 m), the average Si content is 20%, Al 10.5%, Fe 8.4%, Ti 1.1%, and SiO2 17.7%; the average GR is 35 API, rock density 2.74 g/cm3, and average CNL 16%. GRS is represented by low U, low K, and low Th. These values confirm the presence of basic volcanic rocks in this interval.
2 Identification of volcanic rock texture and structure
Volcanic rock texture and structure can be identified using FMI imaging and conventional logs, based on the imaging identification model and response characteristics of conventional logs.
According to the characteristics of imaging log and conventional log curves, seven intervals with different textures were recognized in Well XX7 (see Figure 5.11, the sixth trace), including welded tuff texture in 3850 to 3900 m, crystalline tuff texture in 3900 to 4036 m, volcanic breccia texture and welded breccia texture in 4036 to 4081 m, vesicular and rhyolitic structures in 4081 to 4307 m, volcanic breccia texture in 4307 to 4342 m, volcanic breccia and tuff textures and rhyolitic structure in 4542 to 4408 m, and porphyritic texture in 4408 to 4510 m.
3 Comprehensive identification of volcanic lithology
Based on a rock classification scheme of “composition + texture and structure + petrogenesis,” the volcanic rock types in noncored intervals in single wells can be determined (see Figure 5.11, the 11th trace) by cluster analysis such as the back-propagation (BP) neural network (Figure 5.12) in terms of rock composition, texture, and structure.

5.3 Prediction of volcanic lithological distribution
After the seismic response characteristics of various volcanic rocks are determined, the planar distribution of different volcanic lithologies can be predicted by seismic profile analysis, waveform classification, and seismic inversion.
5.3.1 Seismic response characteristics of different lithologies
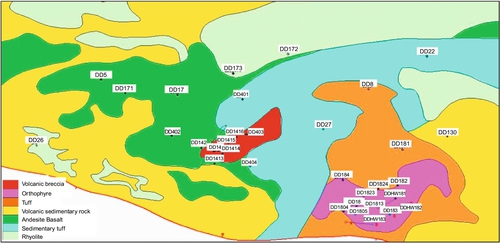
Seismic response models and interpretation criteria for different volcanic rocks can be established by forward modeling and response characteristics analysis on the basis of near-wellbore traces and seismic data calibrated by single-well lithology. The analyses are demonstrated by the case study of the DD gas field (Figure 5.13, Table 5.9), in which the seismic response models for basalt, volcanic breccia, orthophyre, rhyolite, and andesite are established [21].


Table 5.9
Seismic Response Characteristics of Different Volcanic Rocks
| Lithology | Lithofacies | Seismic Response Characteristics | Representative Well | |
| Interior Reflection Characteristics | Shape | |||
| Volcanic breccia | Explosive facies | Low frequency, medium-low amplitude, discontinuity | Mound | DD14, DD403 |
| Basalt | Effusive facies | High frequency, high amplitude, good continuity | Sheet, wedge | DD171, DD401 |
| Andesite | Low frequency, high amplitude, good continuity | Laminar | DD403 | |
| Rhyolite | Low frequency, high amplitude, good continuity | Laminar-like | DD403, DD401 | |
| Orthophyre | Subvolcanic facies | High frequency, medium-low amplitude, discontinuity | Bosslike, wedge | DD18 |
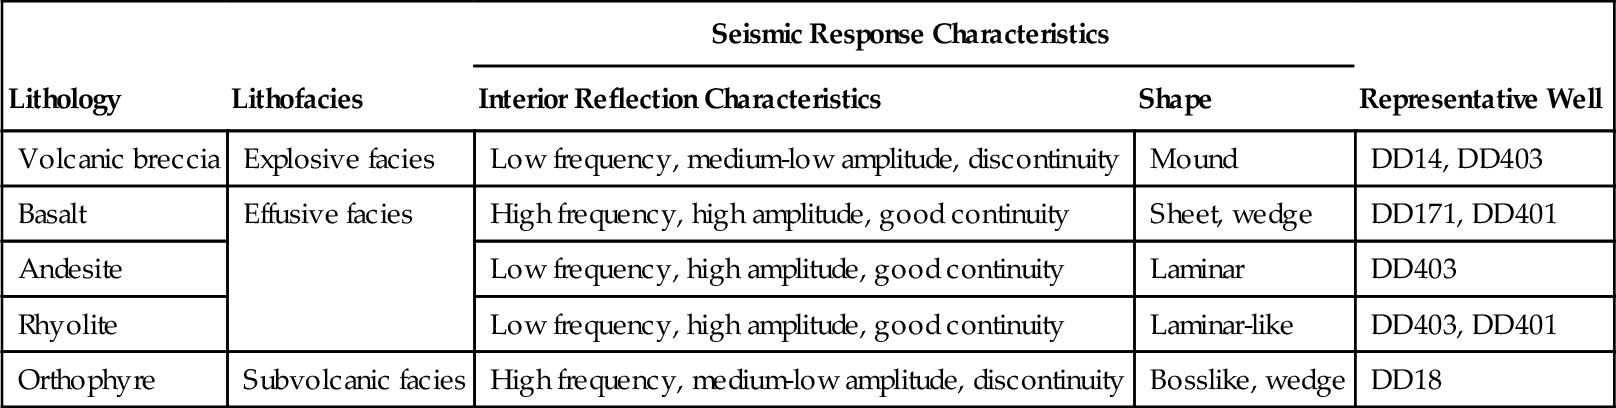
1 Orthophyre
Orthophyre is developed mainly in the subvolcanic facies belt in Well Block DD18, characterized by high GR and high impedance. The seismic reflector of orthophyre shows a distinctly high frequency, medium-low amplitude, and discontinuity, and it often appears bosslike with an irregular wedge shape. In forward modeling analysis, the bottom and top surfaces show relatively strong reflections, which is consistent with the characteristics of unconformity surfaces in the seismic profile (Figure 5.13a).
2 Volcanic breccia
Volcanic breccia is developed mainly in the explosive facies belt in Well Block DD14, characterized by high GR and low impedance. The seismic reflector of volcanic breccia is marked by low frequency, medium-low amplitude, and discontinuity, often having a mound shape. In forward modeling analysis, the top surface has strong reflections, whereas the bottom surface has relatively weak reflections, as is typical of the unconformity surface at the top boundary and the conformable basal boundary in the seismic profile (Figure 5.13b).
3 Basalt
Formed by the eruption of basic magma, basalt is developed mainly in the effusive facies of Well Block DD17, marked by low GR and high impedance. The seismic reflector of basalt is characterized by high frequency, high amplitude, and relatively good continuity, manifesting often as a sheet or wedge with a prograding pattern. Forward modeling analysis reveals strong reflections at the bottom and top surfaces, which is consistent with unconformable surfaces in the seismic profile (Figure 5.13c).
4 Rhyolite and andesite
Rhyolite and andesite are developed mainly in the effusive facies of Well Blocks DD14 and DD10. Rhyolite is formed by the eruption of acidic magma, characterized by high GR and medium impedance, whereas andesite is formed by the eruption of intermediate magma, characterized by low GR and high impedance. Seismic reflectors of rhyolite and andesite have low frequency, high amplitude, and good continuity, with a sheet or wedge morphology. Forward modeling analysis shows strong reflections at the bottom and top surfaces, which is consistent with unconformable surfaces in the seismic profile (Figure 5.13d).
These seismic response characteristics demonstrate that orthophyre, basalt, rhyolite, andesite, and volcanic breccia can be identified using seismic data. It should be noted that differences in acquisition method, subsurface, and surface conditions will result in discrepancies in seismic data acquired in different well blocks and at different times, which in turn will lead to discrepancies in seismic responses to different volcanic rocks.
5.3.2 Prediction of lithological distribution through seismic profile analysis
The lithological distribution of volcanic rocks can be predicted through seismic reflector profiles, based on well-seismic calibration and response characteristics of near-wellbore tracing. The methods and technical procedures are illustrated next, using Well Block DD14 as an example.
1 Preliminary prediction of lithological distribution under the constraint of volcanic rock architecture
According to the characteristics of lithology and lithofacies in Well Block DD14, a framework model of a volcanic massif can be established through dissection of the volcanic rock architecture, based on stratal occurrence, lithofacies assemblage, and fault features (Figure 5.14).
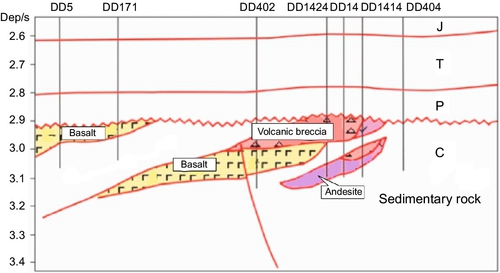
Constrained by the distribution model of a volcanic massif, the distribution range and interwell pattern (Figure 5.16) of volcanic lithology can be determined (Figure 5.15) by well integration, based on the results of lithological interpretation in single wells. It can be concluded from the figure that two sets of volcanic rocks are developed in Well Block DD14:


1. The upper volcanic rocks (the first reservoir interval). The eruption center is at the location of Well DD1424, and the typical volcanic breccia is developed along Wells DD14, DD1424, and DD402; from the center to the northwest, the lithology is dominated by rhyolite, andesite, and basalt. The distribution range is extended to Wells DD401 and DD402 in the west and to Wells DD1413 and DD403 in the east.
2. The lower volcanic rocks (the second reservoir interval) are developed mainly in a belt from Well DD1415 to Well DD403; a set of andesitic volcanic breccia is present on the top, and an assemblage of interbedded volcanic breccia and andesite is developed in the lower part; this set of volcanic rock occupies a relatively small area, represented by a single thin layer.
2 Predicting profile distribution of lithology through analysis of seismic response characteristics of different rocks
The analysis of seismic response characteristics of different lithologies is conducted on the basis of the lithological distribution range and well association pattern. Multiple interwell interpretation and profile tracing are carried out to predict the profile distribution pattern of volcanic rocks (Figure 5.17).
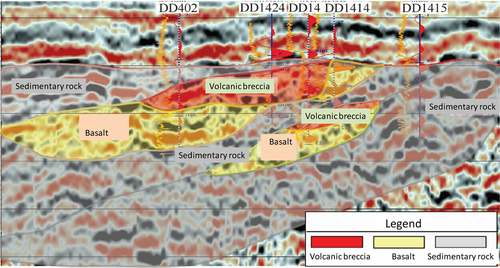
3 Predicting planar distribution of lithology by establishing skeleton profile for seismic interpretation
The lithological interpretation on profiles is used to establish the framework profiles that can control the study area effectively, followed by prediction of planar lithological distribution by profile tracing and closing.
Volcanic breccia is the predominant lithology in reservoirs of Well Block DD14, developed mainly on structural highs in the south, as shown by the prediction results (Figure 5.18). The volcanic breccia in the upper part covers an area of ~ 5 km2, where the maximum thickness is about 160 m; the volcanic breccia in the lower part is smaller in scale, with an area of 4 km2 and maximum thickness of 90 m. The favorable lithological area for development determined by the prediction results provides a basis for well location optimization.

5.3.3 Prediction of lithological distribution by seismic waveform classification
Seismic waveform classification is a technique for seismic facies analysis, usually starting from well points. Based on the analysis, generalization, and classification of actual waveforms in seismic reflectors, seismic waveform classification can be used to analyze the differences in lithology, physical property, and fluid of the target horizon by geological interpretation of waveform changes.
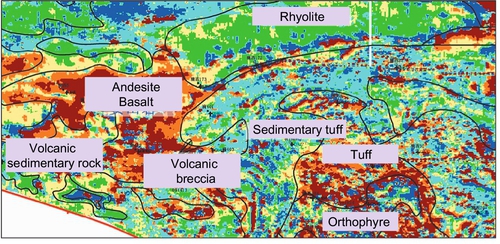
The major steps of predicting lithological distribution through seismic waveform classification include (1) calibrating the seismic and geological horizons in boreholes; (2) starting from individual wells, tracing the seismic reflectors of different lithological intervals in the target horizons; (3) according to lithological differences, dividing the seismic facies by event characteristics such as waveform, amplitude, frequency, and phase, and determining the waveform types and characteristics; (4) using the neural network technique to build the pickup model by training each waveform; (5) determining the pickup range in the target horizons and selecting the waveforms by the picking model to determine the planar distribution of different waveforms; and (6) integrating single-well and interwell distribution characteristics of waveforms to determine the planar distribution of different lithologies.
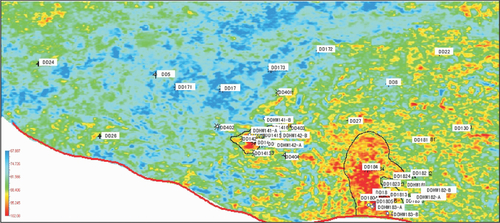
The reservoirs of the DD gas field are developed mainly in the volcanic rocks 160 m below the top of the weathered crust, and the time thickness is about 70 ms. Thus, bounded by the top volcanic rock, the seismic waveform of 70 ms downward can be picked up (Figure 5.19), and the lithological distribution can be predicted (Figure 5.20). It can be concluded that the sedimentary tuff and sand shale along Wells DD404 to DD27 in this area are widespread and trend in approximately a NS direction. The volcanic rock can be divided into two parts (east and west). The east part is dominated by orthophyre in Well Block DD18; the north part by tuff and sedimentary tuff; and the west part by basalt and volcanic breccia, with regularly distributed sedimentary rocks, where volcanic breccia occurs mainly in Well Block DD14 and basalt in Well Block DD17.
5.3.4 Prediction of lithological distribution by frequency-divided inversion
Frequency-divided inversion is a nonlinear attribute inversion technique, which is based on amplitude versus frequency (AVF) and neural network technique. It can be adopted for lithology inversion directly and plays an important role in predicting the lithological distribution of volcanic rocks [20].
1 Principles of frequency-divided attribute inversion
Frequency-divided inversion consists of the following steps.
1) Frequency-divided processing of seismic data
This process begins with a spectrum analysis of the seismic data. According to the effective frequency band, suitable sizes can be designed. After this, the data volume of different frequency bands can be obtained in accordance with frequency-divided processing.
2) AVF relationship analysis
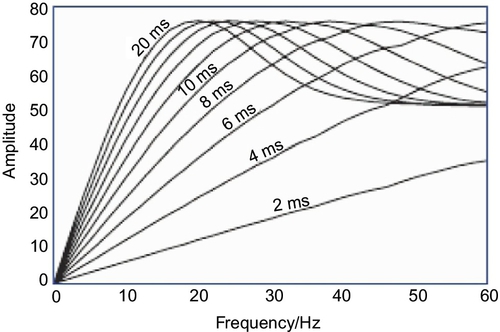
For a wedge model, a series of synthetic seismic profiles and tuning curves with amplitude and thickness in different frequencies (Figure 5.21) can be obtained by Ricker wavelet and its convolution with different dominant frequencies. The AVF relationship is very complex and is difficult to express by explicit functions. Therefore, tuning curves should be transferred by neural network technique to obtain the relationship curve between amplitude and frequency at different time thicknesses (i.e., AVF, Figure 5.22).

3) Frequency-divided attribute inversion
The AVF relationship is introduced into the inversion to establish the nonlinear mapping relationship between impedance and seismic waveform to obtain inversion results.
2 Lithological distribution prediction by frequency-divided attribute inversion
Based on the frequency-divided attribute inversion technique, lithological distribution can be predicted effectively using impedance and GR inversion. The major steps are as follows.
1) Petrophysical analysis
Sensitive parameters, which can be used to determine lithology, are selected through the relationship analysis of rock elastic parameters and reservoir lithology parameters. Figure 5.23 shows a crossplot of impedance-GR and impedance-density of different lithologies. This plot demonstrates that volcanic breccia is characterized by low impedance, medium-high GR, and low density; orthophyre by medium-high impedance, high GR, and medium-high density; basalt by high impedance, low GR, and high density; andesite by high impedance, low-medium GR, and medium-high density; rhyolite by medium impedance, high GR, and medium-low density; and sedimentary rock by medium-low impedance, medium-low GR, and medium-low density. Hence, impedance and GR are the sensitive parameters for lithological prediction in this area.

2) Wave impedance inversion
The AVF relationship is introduced into wave impedance inversion. The wave impedance data volume of strata can be obtained after special processing of seismic data with the BP neural network technique.
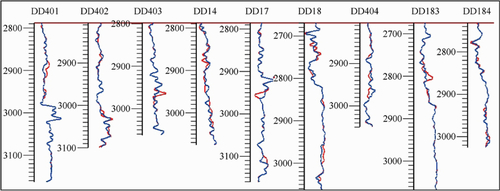
Figure 5.24 shows a learning sample of wave impedance prediction, in which the wave impedance curve of well logging is in red, and the wave impedance curve of near-wellbore inversion is in blue. The correlation coefficient of these two curves has a range of 0.81 to 0.89, indicating a good learning result. The result of wave impedance inversion using the BP neural network technique (Figure 5.25) is basically consistent with the wave impedance of single wells and near-wellbore tracing.

3) Gamma inversion
Gamma inversion data volume can be obtained by the same method. Figure 5.26 is a learning sample of gamma prediction, in which the gamma log curve is in red and the gamma curve of near-wellbore inversion is in blue. The correlation coefficient of these two curves has a high range of 0.78 to 0.96, indicating a very desirable learning effect. The results of gamma inversion using the BP neural network technique (Figure 5.27) corroborate the natural gamma of single wells.


4) Prediction of lithological distribution
Based on petrophysical analysis, the lithological distribution of volcanic rocks can be predicted effectively through single-parameter analysis and integrated multiparameter analysis using the inversion data volume.
Planar distribution of wave impedance value
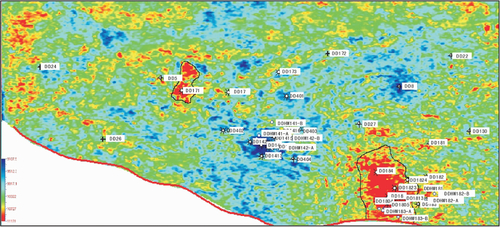
Considering the time domain of 70 ms downward from the volcanic rock top as the objects (major gas layer), the planar distribution of average wave impedance (Figure 5.28) can be obtained by extracting the wave impedance inversion data volume. In this figure, the highest impedance value is around Wells DD18 and DD184, the moderate impedance value is around Wells DD171 and DD17, and the lowest impedance value is around Wells DD402, DD14, and DD404.
Planar distribution of gamma value
Figure 5.29 also shows that the highest value of average gamma is around Wells DD18 and DD184, the moderate value is around Well DD14, and the lowest value is around Wells DD17, DD171, DD172, and DD173.
Planar distribution of lithology
The lithology of spatial data points can be determined through petrophysical analysis, such as multiattribute crossplot analysis with inversion data volume, so as to determine the lithological distribution of volcanic rock in the study area (see Figure 5.30). The results show that Well Block DD18 is dominated by orthophyre, Well Block DD14 by volcanic breccia, and Well Block DD17 by basalt.

5.4 Applications
Lithological characteristics and distribution of volcanic rocks can be studied by applying various lithological identification and prediction techniques to delineate lithofacies in single wells, interpret reservoir parameters, identify gas and water layers, and predict favorable reservoir zones.
5.4.1 Identification of lithology to guide lithofacies delineation in single wells
Volcanic lithofacies have good corresponding relationships with lithology; therefore, lithological logs of single wells can be derived from lithological identification. Such lithological logs can be used in combination with lithological markers, wireline log facies markers, and the locality data of volcanic edifices in single wells to determine single-well lithofacies and to establish lithofacies profiles. This provides a basis for lithofacies prediction and characterization.
5.4.2 Building reservoir parameter interpretation models for different lithologies to improve parameter interpretation accuracy
Different volcanic rocks have different rock matrix values, different types of reservoir space, different porosity, and other physical properties. The “four-parameter” relationships of volcanic reservoirs are also variable. These differences are reflected in different slope and cutoff values in porosity-density crossplots. Therefore, lithology identification can be useful for modeling reservoir parameters for different lithologies, thereby improving the accuracy of reservoir parameter interpretation.
5.4.3 Providing a lithological basis for the establishment of gas and water layer identification models and to improve the congruence rate of identification
Different types of volcanic rocks have different conductive mechanisms and conductive pathways; gas layers in different lithotypes also have different logging response characteristics. Hence, lithological identification can provide a basis for establishing gas and water layers identification models and improving the congruence rate of identification.
5.4.4 Delineating lithological distribution patterns to guide the prediction of favorable reservoir zones
Lithology controls the storage space development in volcanic rocks. By predicting the spatial distribution of lithology, the spatial distribution of favorable reservoir zones can be traced and predicted by the geological rules governing storage space development, which can guide the prediction of the spatial distribution of favorable reservoir zones in volcanic rocks.