Global Markets
The solar global marketplace is a complex place that has wildly different messages to businesses. While production profits record low due to a glut of solar modules in the market, installers worldwide are booming and R&D investments continue to rise. Energy demand is growing slowly, but demand for renewable energy is increasing dramatically. More and more countries are looking to expand their solar capacity to reduce their carbon emissions and reliance on commodity fuels, assist with peak power requirements, and create local jobs for their citizens.
Solar is expected to continue to grow for through 2035, attracting trillions in new financing and investment. Its market share is expected to expand rapidly, thanks to huge capacity additions in China, the United States, and the developing world.
Several new markets, especially in the Middle East, are making significant strides to become major solar players. These nations, such as the United Arab Emirates and Saudi Arabia, should be watched closely for their market potential.
Keywords
Solar markets; solar attractiveness; solar growth
After a decade of strong growth, the global solar market—from a production and profit standpoint—has stalled. The financial crisis in the United States sent domestic markets reeling, and reduced government tax receipts have led many states to question their often generous incentives for renewable energy. As states have been reluctant to expand their own incentive programs in the United States, the impact of the federal government’s aggressive stimulus plan, which included numerous market-driving policies for the solar industry, is subsiding.
While the storm clouds over the US economy appear to be lifting, Europe—the leading region for solar-installed capacity—remains in turmoil. The austerity measures put into place to right the economic ship seem to be only exacerbating EU financial woes. These same austerity measures have drastically limited solar market expansion in the near term.
Compounding the solar industry’s challenges, an aging grid in developed markets, transmission project delays, and a highly charged global policy debate worsen the outlook over the coming years. These issues, together with a substantial oversupply of photovoltaics, have led many firms—particularly in the manufacturing sector—to fold.
Despite these seemingly many pitfalls, there are some global bright spots. Competition is driving down costs and increasing efficiency. Emerging markets are developing thoughtful programs and policies with more proven track records. New, well-financed market entrants, such as the United Arab Emirates and Saudi Arabia, are investing heavily in the industry.
A review of the expected trends facing the energy sector is critical to understand the future of solar markets. This chapter begins with a focus on global energy markets and then reviews the major themes relative to solar power in several exemplary countries.
Global Energy Demand
As the world’s population continues to soar, energy demand is growing at a dramatic pace. Fueled in large part by Asia, and specifically China and India, global demand is expected to increase 53% between 2008 and 2035. Members of the OECD, which tend to be more established economies, are expected to grow by only about 0.6% per year, while non-OECD states at a rate nearly four times higher.1

Recent history illustrates this eastward shift. In 2009, as the United States began to emerge from its recession, its energy consumption declined by 5.3%. In that same year, China’s energy consumption is estimated to have eclipsed the United States for the first time. The US Energy Information Administration models predict that by 2035, China’s energy consumption will be 68% higher than the United States.2
While growth in renewables is expected to be significant, it is roughly in line with other technologies. Liquid fuels like oil and nuclear are expected to grow more slowly, while coal and natural gas will continue a solid gain.
EIA categorizes energy consumption by four areas: transportation (mostly dominated by liquid fuels), residential, commercial, and industrial. These categories allow for more refined and accurate projections and are also very important when considering the types of solar energy systems that will have the most important impacts across the globe, as well as highlighting the best target markets for each.
Residential
Residential energy consumption refers to household use, which is comprised mostly of heating fuel and home electrical use. As would be expected, the developed, OECD member states will see much slower population growth, and therefore relatively small annual increases of energy consumption.3 Non-OECD states, particularly in Brazil, India, and China, are expected to grow much more rapidly at a rate sevenfold higher.
However, since the EIA estimates were produced, advances in efficiency, slower economic growth, and relatively high-energy prices have led to a surprising result. Even as the United States emerges from recession, its energy consumption is not following suit. As a result, while energy consumption is expected to increase over time, the comparison to Asia is even more dramatic. This is reflected in the EIA 2013 outlook that predicts that US energy consumption over the next 30 years will remain flat.4
These trends have important implications for the solar industry, including:
• In the United States and Europe, larger homes that consume higher amounts of energy dominate, but use will not grow dramatically.
• Residential solar in the United States and EU will be more heavily focused on driving down electrical costs rather than meeting demand.
• Grid-connected residences in Asia will require new sources of energy and as demand grows, solar electric systems will compete with the cost of building new systems and transmission rather than merely adding more fuel.
• Non-grid connected residences in Africa, the Middle East, and Asia will seek new sources of energy as household incomes rise and the use of wood and other biofuels diminishes.
Commercial
Commercial energy use includes the consumption of the service sector. It is highly connected to population growth (as services tend to population serving). Commercial energy use is driven by electrical, heating, and cooling of buildings and other structures, though traffic lights, water, and sewer systems are also included in this category.5
The EIA expects commercial energy use to expand by an annual 1.5% globally. Energy use will grow more quickly in developing nations, as OECD states expect much slower population growth and faster adoption of energy efficiency measures.6
Industrial
Industrial energy use is predominantly used for production, as well as for lighting and other business uses in the manufacturing industries. Industrial production makes up just over half of all global energy use and is expected to grow by a similar 1.5% globally each year through 2035.7
Again according to EIA, “not only because of faster anticipated economic expansion but also because of the composition of industrial sector production. OECD economies generally have more energy-efficient industrial operations than non-OECD countries, as well as a mix of industrial output that is more heavily weighted toward non-energy-intensive industry sectors. As a result, the ratio of industrial energy consumption to total GDP tends to be higher in non-OECD economies than in OECD economies. On average, industrial energy intensity (the consumption of energy consumed in the industrial sector per dollar of economic output) in non-OECD countries is double that in OECD countries.”8
Global Renewable Energy Outlook
Several newly developed energy future scenarios have been developed with somewhat different results. The future is difficult to predict across all energy markets and significantly more so for renewable energy ones. Analysis requires assumptions for GDP, the policy landscape, continued environmental awareness, and the investment landscape.
In a recent report by BNEF, a “new normal” scenario is outlined with world economic growth at pre-recession levels, stronger policy coordination among major emitters, sustained investments, continued technological innovation, and strong demand for fossil fuels.9 In this scenario, BNEF estimates that by 2030, renewable energy will make up nearly half (48%) of total power generation (up from 28% in 2012).10 Solar is expected to make up between 14% and 17% of global energy production under the various future scenarios.
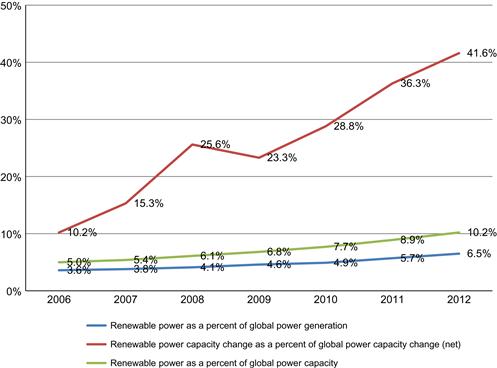
Renewable power generation and capacity as a proportion of global power, 2006–12 Source: http://www.unep.org/pdf/GTR-UNEP-FS-BNEF2.pdf
This figure suggests a continued rapid expansion of solar energy. In fact, BNEF estimates that solar PV will account for 30% of all new power additions through 2030. Solar is expected to become the leading renewable source by share of market, rising to account for between 27% and 32% of all renewables by 2030.11
This rise is quite dramatic and in line with estimates that suggest rising fuel prices. BNEF also estimates that 73% of total investment in power generation will be directed to renewables, to the tune of nearly $8 trillion. About $5.5 trillion of this will be invested in solar and wind with a maximum of $3.2 trillion under the most aggressive scenario for solar alone.12
These long-range scenarios are fascinating, but shorter term projections have greater accuracy. Renewable energy production has grown by a 5.8% rate globally in 2010 and 2011, leading the EIA to project a growth rate for 2011–2017 that is 60% higher than 2005–2011. In its scenarios, it expects the number of countries that produce solar PV to double between 2011 and 2017.13
Overall energy demand is clearly important for the proliferation of solar technologies. Increasing global demand, concern over climate change, increasing competitiveness of solar economics, and strong public support have led to a massive increase of installed solar electric capacity across the globe.
EIA projects that by 2017, solar will contribute 4.9% to renewable generation. This is based on an expectation that solar PV will grow by 35 TWh per year—an increase of 27.4%—from 70 to 230 GW over the period. This growth will be led by China (32 GW), the United States, (21 GW), Germany (20 GW), Japan (20 GW), and Italy (11 GW).14
CSP is expected to explode over the period from 2 to 11 GW by 2017.15 Despite this 550% growth scenario, expectations were higher and the small base tempers the excitement. Clearly, PV growth has eroded some of these gains. Nonetheless, the United States is expected to lead all nations in CSP with 4 GW added by 2017. At the same time, solar thermal heating is expected to grow by 150% over the period.16
These global scenarios illustrate a strong and continued demand for solar energy. A country-level analysis is also critical for determining the best markets for solar in the future.
According to the SEIA, US annual PV installations grew to an impressive 3313 MW in 2012, an increase of 76%. The new capacity represents 11% of global installations, its highest share in 15 years, and increases the US installed capacity figure by more than 100% from 2011 at 7221 MW.17
The residential market is booming in the United States with over 83,000 installations in the sector. This is largely driven by cost; the blended average sales price for PV modules for Q4 2012 was $0.68/w, a staggering 41% below the Q4 2011 price of $1.15/W.18 This pricing led to further reduction to the cost of PV systems and an expectation of 30% growth in 2013.19
The 2012 growth numbers are significant, especially given that over 39% of the capacity was installed in Q4. The market was led by California, the historical leader, as well as New Jersey, Arizona, North Carolina, and Massachusetts.
In the United States, the residential market continues to grow steadily with installers adding 488 MW in 2012, growth of 62% from 2011. The fastest growing residential markets are California, Hawaii, Arizona, and Massachusetts. Only Pennsylvania, which suffered from renewed policy uncertainty, shrank in 2012.20
The nonresidential market in the United States grew 26% in 2012 adding 1043 MW of new capacity. The market leaders, California and New Jersey, both started 2012 strong but declined after midyear. This was offset by emerging growth in Massachusetts, Hawaii, Maryland, and New York.21
While these figures are impressive, utility growth exploded, more than doubling from 2011 at 1782 MW (more than half of the year’s installed capacity growth). The rise, however, has meant that many states have hit their renewable targets, so growth is expected to slow in most parts of the country.22
GTM Research projects 2013 PV capacity additions to grow by 29%, again outpacing the global installation rate but down from 2012 impressive rate. The resulting capacity additions total 4.3 GW of PV. This is mostly lower due to slowing utility installations, and also likely to track previous years, with strong Q1 and Q4 installations. The projections seem on track, with 723 MW reported to be installed in Q1 of 2013, representing 33% growth over Q1 2012.23
Ernst & Young and BNEF expect that public opinion, as demonstrated in the reelection of President Obama and recent polling, will drive the United States to continue its growth in the medium term for solar energy. Americans grow wearier and wearier of reliance on foreign oil and its inevitable entanglements, and are seeking support for domestic sectors that are likely to grow jobs.24
The United States leads the Ernst & Young solar attractiveness index, maintaining its position in 2011 and 2012. India remains at #2, a surprising ranking for a country with an old and insufficient grid, blackouts, policy uncertainty, and other issues. However, with one-third of India’s population off the grid, and a significant energy deficit in the country, there is potential for significant growth in distributed generation.25
China ranks third in the indices, however, the shift towards the nation is fully underway and if current trends continue, it will easily lead the world in the near term. While solar has not taken hold as quickly as wind power, for example, but changes in policies and new investment appear to be rapidly changing the focus of the country to installed solar capacity. Much of the shift in focus is to further stimulate the saturated PV production plants.26
Europe continues to fade, as it reaches near saturation in most of its markets. Germany, a perennial top nation in the index, sits at 4, while Spain has fallen to 9.27
Several new markets have emerged on the scene, however, predominantly in the Middle East. Specifically, the UAE and Saudi Arabia are marching ahead, both making the index for the first time in 2012 at #12 and #14, respectively.28
Of course, these statistics and indices are useful to analyze the markets for installing solar capacity, but do not address the market for production. This is because, quite frankly, over the course of time it has taken to write this text, the section highlighting areas of opportunity in production has shrunk to almost nothing.
Global public investments in renewable energy companies dropped a precipitous 60% in 2012 continuing a free fall from the peak in 2007. Currently, public investment in the sector sits at only one-fifth of the 2007 high. Solar investment fared slightly better than other renewables and claimed the top spot among all technologies, however, this is only because others declined faster. In 2012, solar investment dropped 50% to $2.3 billion globally.29
In 2012, global production of PV reached 60 GW for 30 GW of demand.30 A PhD in economics is not required to recognize the resulting impact on prices with continued slides and lost profitability. Crystalline silicon module spot prices declined from about $1/watt to an average of $0.80/watt and even as low as $0.60/watt on some larger deals.31
The resulting slide in prices decimated profits along the value chain with nearly all producers losing money. Many public companies reported staggering losses, while 2012 saw the demise of Q-cells, the German manufacturer that at one time was the largest producer in the world, Centrotherm, a German equipment maker, and Konarka in the United States. Traditional PV was not alone in this mess; Abound Solar, once a darling of the US Department of Energy (and recipient of guarantees similar to those received by the media sensation Solyndra) and producer of thin-film modules, also declared bankruptcy.32
It is no surprise that clean energy stocks suffered in 2012, but it is perhaps surprising, given the pain in the supply chain, at how little they were down in 2012—5.9% according to The Wilderhill New Energy Global Index (NEX). The 2012 NEX valuation of 120.02 is down 78% since 2007 and is clearly underperforming against the wider market. Despite these bad conditions, solar remained the largest issuer of shares through Initial Purchase Offerings (IPOs) and still managed to attract significant investment over the period.33 The stock valuation was clearly also supported by strength among large developers who are turning in record profits.
The year 2012 ended with a bang, a trend that seems to have continued into 2013. The NEX added 15% from December 1, 2012, to January 31, 2013, with the Bloomberg solar index adding 5%.34 However, the rebound may be a red-herring and not all commentators agree on the sustainability of the rebound.
The solar industry is clearly offering investors and market analysts mixed messages. As Michael Liebreich, the chief executive of BNEF put it, “for every equipment company operating at thin or negative margins, there is an installer who is getting a good deal… Rumors of the death of clean energy have been greatly exaggerated.”35 Ultimately, however, solar will not see market competitiveness industry wide until equilibrium is found between installation and production.
1http://www.eia.gov/forecasts/ieo/world.cfm.
2id.
3id.
4http://consortiumnews.com/2013/07/09/us-energy-renaissance-shifts-geopolitics/.
5id.
6id.
7id.
8id.
9Bloomberg New Energy Finance, Global Renewable Energy Market Outlook 2013, Fact Pack, April 26, 2013.
10id. at p. 3.
11id.
12id.
13Energy Information Administration, Medium Term Renewable Energy Market Report 2012, p. 11. Available from http://www.iea.org/textbase/npsum/mtrenew2012Sum.pdf.
14id. at p. 14.
15id.
16id.
17U.S. Solar Market Insight Report: 2012 Year in Review, Solar Energy Industries Association and GTM Research, Executive Summary.
18id.
19id.
20id.
21id.
22id.
23http://www.seia.org/research-resources/solar-industry-data.
24Ernst & Young, Renewable Energy Country Attractiveness Indices, November 2012, at p. 39.
25id. at p. 29.
26id. at p. 26.
27id.
28id. at pp. 34–35.
29id. at p. 56.
30http://www.unep.org/pdf/GTR-UNEP-FS-BNEF2.pdf at pp. 57–58.
31id. at p. 58.
32id.
33id. at p. 59.
34id. at p. 60.
35http://www.bloomberg.com/news/2012-01-12/clean-energy-investment-rises-to-a-record-260-billion-on-solar.html.