
Chapter 12. OpenCL Profiling and Debugging
In this chapter, we examine aspects of profiling and debugging OpenCL programs. OpenCL tools such as the Accelerated Parallel Processing Profiler and the KernelAnalyzer help us to understand the location of performance bottlenecks in our code. gDEBugger gives us a high-level debugging interface above kernel-level options such as inserting calls to the printf function.
Keywords: debug, profile, performance analysis, gDEBugger, KernelAnalyzer, performance counter
Introduction
Our motivation for writing programs in OpenCL is not limited to writing isolated high-performance kernels but to speed up parallel applications. Previous chapters discussed how we can optimize kernels running on OpenCL devices by targeting features of the architecture. In this chapter, we discuss how we can study the interaction between the computational kernels on the device and the host. We need to measure the performance and study an application as a whole to understand bottlenecks.
An OpenCL application can include kernels and a large amount of input/output (IO) between the host and device. Profiling such an application can help us to improve performance by answering some of the following questions regarding an application:
• Which kernel should be optimized when multiple kernels exist in an application?
• How much time is spent by the kernels waiting in command queues versus actually executing?
• What is the ratio between execution time and the time spent initializing the OpenCL runtime and compiling kernels for an application?
• What is the ratio of time spent in host device IO to computation time for an application?
The first two sections of this chapter examine how the OpenCL API provides some basic features for application profiling and how operating system APIs can be used for timing sections of code, respectively. The following two sections discuss two tools from AMD that can help with profiling an application for performance:
• AMD Accelerated Parallel Processing (APP) Profiler is a performance analysis tool that gathers data from the OpenCL runtime and AMD Radeon GPUs during the execution of an OpenCL application.
• AMD Accelerated Parallel Processing (APP) KernelAnalyzer is a static analysis tool to compile, analyze, and disassemble an OpenCL kernel for AMD Radeon GPUs.
Each of these four different approaches to profiling can help a developer quickly determine why an application is not performing as expected and, in combination with the debugging features described in Chapter 13, can greatly improve the development process.
We conclude this chapter by discussing debugging OpenCL code. Debugging of parallel programs is traditionally more complicated than conventional serial code due to subtle bugs such as race conditions, which are difficult to detect and reproduce. We give a brief overview of gDEBugger, which is an OpenCL debugging and profiling tool. We also briefly explain the printf extension provided by AMD, which allows us to view kernel data.
Profiling with Events
OpenCL supports 64-bit timing of commands submitted to command queues using clEnqueueXX()commands, such as clEnqueueNDRangeKernel(). Generally, commands are enqueued into a queue asynchronously, and as described in previous chapters, the developer uses events to keep track of a command's status as well as to enforce dependencies. Events provide a gateway to a command's history: They contain information detailing when the corresponding command was placed in the queue, when it was submitted to the device, and when it started and ended execution. Access to an event's profiling information is through the following API clGetEventProfilingInfo, which provides an interface for queuing timing information:
Profiling of OpenCL programs using events has to be enabled explicitly on a per command queue basis. Profiling is enabled when creating a command queue by setting the CL_QUEUE_PROFILING_ENABLE flag.
Once a command queue has been created, it is not possible to turn event profiling on and off.
cl_int clGetEventProfilingInfo (
cl_event event,
cl_profiling_info param_name,
size_t param_value_size,
void *param_value,
size_t *param_value_size_ret)
The first argument, event, is the event being queried, and the second argument is an enumeration value describing the query. Valid values for the enumeration are given in the following table:
| CL_PROFILING | Return Type | Information Returned in param_value |
|---|---|---|
| CL_PROFILING_COMMAND_QUEUED | cl_ulong | A 64-bit value that describes the current device time counter in nanoseconds when the command identified by event is enqueued in a command queue by the host. |
| CL_PROFILING_COMMAND_SUBMIT | cl_ulong | A 64-bit value that describes the current device time counter in nanoseconds when the command identified by the event that has been enqueued is submitted by the host to the device associated with the command queue. |
| CL_PROFILING_COMMAND_START | cl_ulong | A 64-bit value that describes the current device time counter in nanoseconds when the command identified by event starts execution on the device. |
| CL_PROFILING_COMMAND_END | cl_ulong | A 64-bit value that describes the current device time counter in nanoseconds when the command identified by event has finished execution on the device. |
As discussed previously, OpenCL command queues work asynchronously—that is, the functions return as soon as the command is enqueued. For this reason, querying an OpenCL event for timestamps after a kernel enqueue necessitates a clFinish call or other event synchronization before the call to clGetEventProfilingInfo to ensure that the task associated with the event has completed execution.
Event profiling information is not enabled by default and instead is enabled on a per command queue basis. To explicitly enable a command queue for event profiling, the following bit-field value is passed at creation:
CL_QUEUE_PROFILING_ENABLE
Once a command queue has been created, it is not possible to turn event profiling on and off.
The following is a simple example of the use of events to profile a kernel execution:
// Sample Code that can be used for timing kernel execution duration
// Using different parameters for cl_profiling_info allows us to
// measure the wait time
cl_event timing_event;
cl_int err_code;
//! We are timing the clEnqueueNDRangeKernel call and timing information will be
//! stored in timing_event
err_code = clEnqueueNDRangeKernel (
command_queue, kernel,
work_dim,
global_work_offset,
global_work_size,
local_work_size,
0,
NULL,
&timing_event);
clFinish(command_queue);
cl_ulong starttime;
cl_ulong endtime;
err_code = clGetEventProfilingInfo(
timing_event,
CL_PROFILING_COMMAND_START,
sizeof(cl_ulong),
&starttime, NULL);
kerneltimer = clGetEventProfilingInfo(
timing_event,
CL_PROFILING_COMMAND_END,
sizeof(cl_ulong),
&endtime,
NULL);
unsigned long elapsed = (unsigned long)(endtime - starttime);
printf("Kernel Execution %ld ns
",elapsed);
AMD Accelerated Parallel Processing Profiler
The AMD Accelerated Parallel Processing (APP) Profiler is a performance analysis tool that gathers data from the OpenCL runtime and AMD Radeon GPUs during the execution of an OpenCL application. We can then use this information to discover bottlenecks in an application and find ways to optimize the application's performance for AMD platforms. Hereafter, we refer to the AMD APP Profiler as the profiler.
The profiler can be installed as part of the AMD APP SDK installation or individually using its own installer package. You can download the profiler from the AMD developer website at http://developer.amd.com.
In this section, we describe the major features in Version 2.2 of the profiler with the described version is included with Version 2.4 of the AMD APP SDK. Because the profiler is still being rapidly developed, please consult the profiler documentation for the latest features of the tool.
1. As a Microsoft Visual Studio 2008 or 2010 plug-in
2. As a command line utility tool for both Windows and Linux platforms
Using the profiler as a Visual Studio plug-in is the recommended usage model because one can visualize and analyze the results in multiple ways. To start the profiler in the Visual Studio plug-in, simply load a solution into Visual Studio. Select a C/C++ project as the startup project, and click on the Collect Application Trace or Collect GPU Performance Counters button on the APP Profiler Session Explorer panel. By default, the APP Profiler Session Explorer panel will be docked in the same window panel as the Visual Studio Solution Explorer panel. No code or project modifications are required to profile the application. The profiler will query Visual Studio for all the project settings required to run the application. When the application completes, the profiler will generate and display the profile information.
The command line utility tool is a popular way to collect data for applications for which the source code is not available. The output text files generated by the profiler can be analyzed directly, or they can be loaded by the Visual Studio plug-in to be visualized.
Two modes of operation are supported by the profiler: collecting OpenCL application traces and collecting OpenCL kernel GPU performance counters.
Collecting OpenCL Application Trace
The OpenCL application trace lists all the OpenCL API calls made by the application. For each API call, the profiler records the input parameters and output results. In addition, the profiler also records the CPU timestamps for the host code and device timestamps retrieved from the OpenCL runtime. The output data is recorded in a text-based AMD custom file format called an Application Trace Profile file. Consult the tool documentation for the specification. This mode is especially useful in helping to understand the high-level structure of a complex application.
From the OpenCL application trace data, we can do the following:
• Discover the high-level structure of the application with the Timeline View. From this view, we can determine the number of OpenCL contexts and command queues created and the relationships between these items in the application. The application code, kernel execution, and data transfer operations are shown in a timeline.
• Determine if the application is bound by kernel execution or data transfer operations, find the top 10 most expensive kernel and data transfer operations, and find the API hot spots (most frequently called or most expensive API call) in the application with the Summary Pages View.
• View and debug the input parameters and output results for all API calls made by the application with the API Trace View.
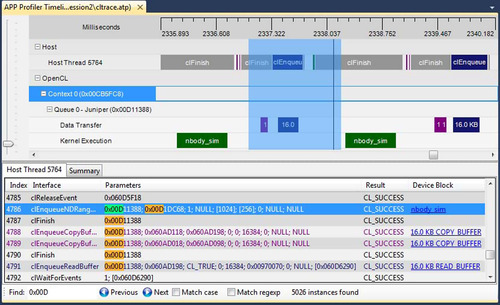
The Timeline View (Figure 12.1) provides a visual representation of the execution of the application. Along the top of the timeline is the time grid, which shows the total elapsed time of the application when fully zoomed out, in milliseconds. Timing begins when the first OpenCL call is made by the application and ends when the final OpenCL call is made. Directly below the time grid, each host (OS) thread that made at least one OpenCL call is listed. For each host thread, the OpenCL API calls are plotted along the time grid, showing the start time and duration of each call. Below the host threads, the OpenCL tree shows all contexts and queues created by the application, along with data transfer operations and kernel execution operations for each queue. We can navigate in the Timeline View by zooming, panning, collapsing/expanding, or selecting a region of interest. From the Timeline View, we can also navigate to the corresponding API call in the API Trace View and vice versa.
The Timeline View can be useful for debugging your OpenCL application. The following are examples:
• You can easily confirm that the high-level structure of your application is correct. By examining the timeline, you can verify that the number of queues and contexts created match your expectations for the application.
• You can also gain confidence that synchronization has been performed properly in the application. For example, if kernel A execution is dependent on a buffer operation and outputs from kernel B execution, then kernel A execution should appear after the completion of the buffer execution and kernel B execution in the time grid. It can be difficult to find this type of synchronization error using traditional debugging techniques.
Summary Pages View
The Summary Pages View shows various statistics for your OpenCL application. It can provide a general idea of the location of the application's bottlenecks. It also provides useful information such as the number of buffers and images created on each context, the most expensive kernel call, etc.
The Summary Pages View provides access to the following individual pages:
• API Summary page: This page shows statistics for all OpenCL API calls made in the application for API hot spot identification.
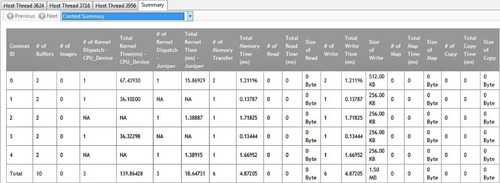
• Context Summary page: This page shows the statistics for all the kernel dispatch and data transfer operations for each context. It also shows the number of buffers and images created for each context. This is shown in Figure 12.2.
• Kernel Summary page: This page shows statistics for all the kernels that are created in the application.
• Top 10 Data Transfer Summary page: This page shows a sorted list of the 10 most expensive individual data transfer operations.
• Top 10 Kernel Summary page: This page shows a sorted list of the 10 most expensive individual kernel execution operations.
From these summary pages, it is possible to determine whether the application is bound by kernel execution or data transfer (Context Summary page). If the application is bound by kernel execution, we can determine which device is the bottleneck. From the Kernel Summary page, we can find the name of the kernel with the highest total execution time. Or, from the Top 10 Kernel Summary page, we can find the individual kernel instance with the highest execution time. If the kernel execution on a GPU device is the bottleneck, the GPU performance counters can then be used to investigate the bottleneck inside the kernel. We describe the GPU performance counters view later in this chapter.
If the application is bound by the data transfers, it is possible to determine the most expensive data transfer type (read, write, copy, or map) in the application from the Context Summary page. We can investigate whether we can minimize this type of data transfer by modifying the algorithm if necessary. With help from the Timeline View, we can investigate whether data transfers have been executed in the most efficient way—that is, concurrently with a kernel execution.
API Trace View
The API Trace View (Figure 12.1) lists all the OpenCL API calls made by the application.
Each host thread that makes at least one OpenCL call is listed in a separate tab. Each tab contains a list of all the API calls made by that particular thread. For each call, the list displays the index of the call (representing execution order), the name of the API function, a semicolon delimited list of parameters passed to the function, and the value returned by the function. When displaying parameters, the profiler will attempt to dereference pointers and decode enumeration values to give as much information as possible about the data being passed in or returned from the function. Double-clicking an item in the API Trace View will display and zoom into that API call in the Host Thread row in the Timeline View.
The view allows us to analyze and debug the input parameters and output results for each API call. For example, we can easily check that all the API calls are returning CL_SUCCESS or that all the buffers are created with the correct flags. We can also identify redundant API calls using this view.
Collecting OpenCL GPU Kernel Performance Counters
The GPU kernel performance counters can be used to find possible bottlenecks in the kernel execution. You can find the list of performance counters supported by AMD Radeon GPUs in the tool documentation.
Once we have used the trace data to discover which kernel is most in need of optimization, we can collect the GPU performance counters to drill down into the kernel execution on a GPU device. Using the performance counters, we can do the following:
• Find the number of resources (General Purpose Registers, Local Memory size, and Flow Control Stack size) allocated for the kernel. These resources affect the possible number of in-flight wavefronts in the GPU. A higher number of wavefronts better hides data latency.
• Determine the number of ALU, global, and local memory instructions executed by the GPU.
• Determine the number of bytes fetched from and written to the global memory.
• View the efficiency of the Shader Compiler in packing ALU instructions into the VLIW instructions used by AMD GPUs.
• View any local memory (Local Data Share (LDS)) bank conflicts where multiple lanes within a SIMD unit attempt to read or write the same LDS bank and have to be serialized, causing access latency.
The Session View (Figure 12.3) shows the performance counters for a profile session. The output data is recorded in a comma-separated-variable (csv) format. You can also click on the kernel name entry in the “Method” column to view the OpenCL kernel source, AMD Intermediate Language, GPU ISA, or CPU assembly code for that kernel.
AMD Accelerated Parallel Processing KernelAnalyzer
The AMD APP KernelAnalyzer is a static analysis tool to compile, analyze, and disassemble an OpenCL kernel for AMD Radeon GPUs. It can be used as a graphical user interface tool for interactive tuning of an OpenCL kernel or in command line mode to generate detailed reports. Hereafter, we refer to this tool as the KernelAnalyzer.
The KernelAnalyzer can be installed as part of the AMD APP SDK installation or individually using its own installer package. You can download the KernelAnalyzer package from the AMD developer website at http://developer.amd.com.
To use the KernelAnalyzer, the AMD OpenCL runtime is required to be installed on the system. However, no GPU is required in the system.
To compile an OpenCL kernel in the KernelAnalyzer, simply drop the source containing the OpenCL kernel anywhere within the KernelAnalyzer's main window (Figure 12.4). We do not require the entire OpenCL application to compile or analyze the OpenCL kernel.
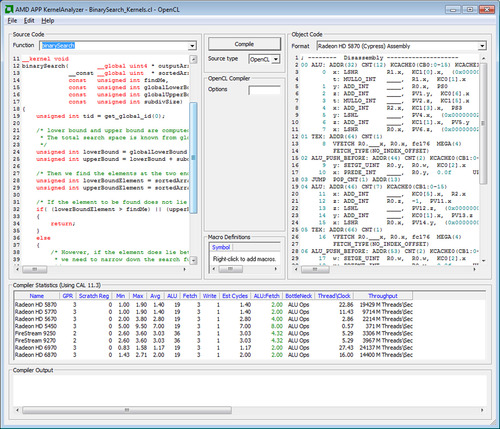
• Compile, analyze, and disassemble the OpenCL kernel for multiple Catalyst driver versions and GPU device targets.
• View any kernel compilation errors and warnings generated by the OpenCL runtime.
• View the AMD Intermediate Language code generated by the OpenCL runtime.
• View the ISA code generated by the AMD Shader Compiler. Typically, device-specific kernel optimizations are performed by analyzing the ISA code.
• View various statistics generated by analyzing the ISA code.
• View General Purpose Registers and spill registers allocated for the kernel.
Because the KernelAnalyzer can quickly compile a kernel for multiple GPU device targets, it is very useful for rapid prototyping of OpenCL kernels.
Walking through the AMD APP Profiler
In this section, we walk through the usage of AMD APP Profiler to profile the MatrixMultiplication application from the AMD APP SDK Version 2.4 samples.
We show you a step-by-step process that includes running the AMD APP Profiler, using the generated data to find a bottleneck in the application, and improving the performance of the application.
Starting the AMD APP Profiler
1. Load the AMD APP SDK samples solution file (OpenCLSamplesVS10.sln) in Microsoft Visual Studio.
2. Set the MatrixMultiplication project as the start-up project.
3. Confirm that the project can compile and run normally.
4. Confirm that the APP Profiler has been installed properly.
a. From the Visual Studio main menu bar, select the Help -> About Microsoft Visual Studio menu item. Under the Installed products, you should see an AMD APP Profiler entry. If you do not see this entry, please re-install the profiler.
b. Check that the APP Profiler Session Explorer is docked in the same window panel as the Visual Studio Solution Explorer. If you do not see the APP Profiler Session Explorer panel, enable it by selecting View -> Other Windows -> APP Profiler Session Explorer from the Visual Studio main menu bar.
Using the Application Trace to Find the Application Bottleneck
1. On the APP Profiler Session Explorer, click on the Collect Application Trace button to start collecting a trace for the application.
2. After the trace has been completed, the APP Profiler Timeline (Figure 12.5) will be shown and docked in the same window panel as the Visual Studio editor window.
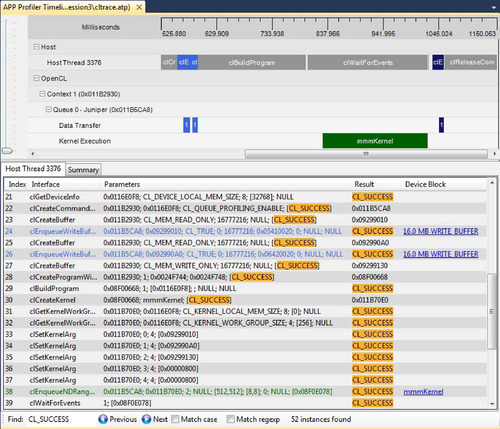
a. From the API Trace View in Figure 12.5, we can confirm that the application runs successfully without generating any errors from the OpenCL runtime by verifying that all return error codes of the API calls are CL_SUCCESS. From this view, we can also inspect the input arguments and output results of each API call. For example, the first two buffers are created with a CL_MEM_READ_ONLY flag, and the third buffer is created with a CL_MEM_WRITE_ONLY flag. These buffers are of size 16 MB.
b. From the Timeline View in Figure 12.5, we can learn the following facts about the application:
• The application contains one OpenCL context and one command queue.
• The command queue is created for a GPU device called Juniper, which is the internal name for the AMD Radeon HD5770 GPU.
• There is one kernel execution on the GPU device.
• The application likely has correct dependency for the data transfers and kernel operations. Two input buffers are sent to the device prior to the start of the kernel execution operation, and the output buffer is read from the device after the completion of the kernel execution. Short of exhaustive testing or model checking, this is good support for correct implementation of the intent.
3. Click on the Summary tab (Figure 12.5) to view the Summary Pages View.
a. Navigate to the Context Summary page (Figure 12.6; the default view after you click on the Summary tab) by selecting the Context Summary from the drop-down combo box on the Summary Pages View.
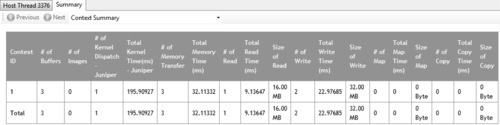
• From this page, we find that the kernel operation on the GPU device is the bottleneck. The total kernel execution on the GPU device takes 195 ms compared to the total data transfer operations, which take 32 ms.
b. Navigate to the Top10 Kernel Summary page (Figure 12.7) by selecting the Top10 Kernel Summary from the drop-down menu.
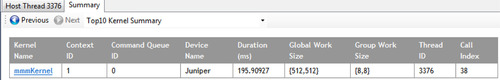
• Using this page, we can find the kernel instance (mmmKernel) that is in most need of optimization. In this example, however, there is only one kernel instance.
Using the GPU Performance Counters to Find the Bottleneck in the Kernel
Once we have discovered the kernel instance that is in most need of optimization, we can collect the GPU performance counters (click the Collect GPU Performance Counters button on the APP Profiler Session Explorer panel) to guide us in finding the possible bottlenecks in the kernel.
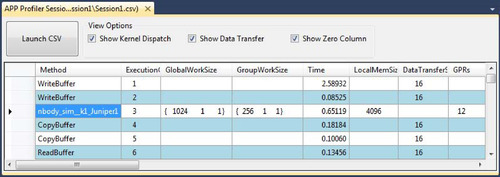
Figure 12.8 shows the resulting GPU performance counters of multiplying two matrices of size 2048 × 2048 together using three different methods:
| Figure 12.8 |
1. Row 1 is the result from the MatrixMultiplication sample: This method uses the global memory to store the matrices.
a. The result shows that the kernel uses 17 general-purpose registers (GPRs). This is good because it is less likely that the number of wavefronts in-flight will be limited by the GPR usage. There are 4096 wavefronts generated. With a maximum of 24 SIMD cores on current devices, this is at least 170 wavefronts per core—far more than the device resources can run concurrently and easily enough to keep the device busy.
b. From the low value of ALUBusy and high value of FetchUnitBusy and FetchUnitStalled counters, we can conclude that the kernel is bottlenecked by fetching data from the global memory.
2. Row 2 is the result from the MatrixMultiplication sample with a mmmKernel_ local kernel: This method uses the global memory to store the matrices but also utilizes the local memory to cache the results.
a. The result shows that we have improved the kernel running time from 195 to 114 ms (a 42% improvement) by utilizing the local memory to reduce the pressure of fetching data from the global memory. The shader compiler is also doing a slightly better job of packing the VLIW instructions (ALUPacking counter).
3. Row 3 is the result from the MatrixMulImage sample: This method uses the OpenCL image objects to store the matrices.
a. The result shows that the kernel running time has been significantly improved (down to 21 ms—an 89% improvement over Method 1 using only the global memory). From the performance counters, we can see that the value of the FetchUnitStalled counter is now near 0%. The value of FetchUnitBusy is still very high; this shows that this kernel is still bottlenecked over the data fetching from the global memory. However, using the image objects helps due to the support for data caching of image objects (69% cache hit for the CacheHit counter). The value of the ALUBusy counter is now quite high, signifying that the SIMDs are now utilized properly.
From these three methods, we have seen that the MatrixMultiplication kernel is bottlenecked by fetching data from the global memory. The second and third methods try to address this problem by utilizing the local memory and image buffer objects to cache the results from the global memory.
Debugging OpenCL Applications
From the previous sections, we have seen how we can optimize performance of our OpenCL code. However, the paramount requirement is correctness. In this section, we discuss debugging in a heterogeneous environment and give an overview of the tools provided.
Debugging of parallel programs is traditionally more complicated than conventional serial code due to subtle bugs such as race conditions, which are difficult to detect and reproduce. The difficulties of debugging parallel applications running on heterogeneous devices are exacerbated by the complexity and “black box” nature of the accelerated parallel platform.
The developer works on top of an API that hides the parallel platform's implementation. Debuggers and profilers transform the developer's view into a “white box” model, letting the developer peer into OpenCL to see how individual commands affect the parallel computing system. This allows developers to find bugs caused by incorrect OpenCL usage and optimize their applications for the system on which it runs. In the remainder of this chapter, we give a brief overview of gDEBugger, which is an advanced debugger and profiler for OpenCL, and we explain (briefly) the printf extension provided by AMD, a simpler but sometimes effective alternative to a full debugger.
Overview of gDEBugger
gDEBugger is an OpenCL and OpenGL debugger, profiler, and memory analyzer. It helps developers find bugs and optimize OpenCL performance and memory consumption.
gDEBugger consists of the following components:
• gDEBugger Visual Studio plug-in—a plug-in that adds advanced OpenCL and OpenGL debugging capabilities into Microsoft's Visual Studio
• gDEBugger (stand-alone)—a stand-alone product that offers advanced OpenCL and OpenGL debugging and profiling capabilities over multiple platforms (Windows, Linux, and Mac)
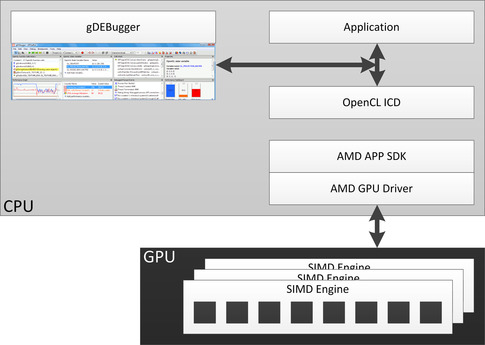
Figure 12.9 shows a simplified high-level overview of how gDEBugger interacts with OpenCL devices. It shows some of the important modules/components. When gDEBugger is used, it intercepts the API calls between the Application and the OpenCL Installable Client Driver. This enables gDEBugger to log all API calls, identify all used OpenCL objects, and gather data on these objects. In addition, gDEBugger can actively modify some of the API calls, add calls to query additional information, and can eliminate some calls to help the developer analyze the performance bottlenecks.
In the following sections, we briefly describe the debugging capabilities of gDEBugger to advocate its usage in development environments.
Debugging Parallel OpenCL Applications with gDEBugger
As previously discussed, there are two distinct regions of code in heterogeneous applications:
1. API-level code (clEnqueue calls, clCreateBuffer, etc.), which runs on the host
2. Compute kernel (run on devices) code
We give brief details about the debugging capabilities of gDEBugger for both the API-level code and compute kernels.
API-Level Debugging
API-level debugging is provided by gDEBugger to view the parameters that a runtime function is called with. The following are features provided by API-level debugging:
• API function breakpoints: gDEBugger will break the debugged application before the function is executed. This allows viewing the call stack that led to the function call, as well as the function's parameters.
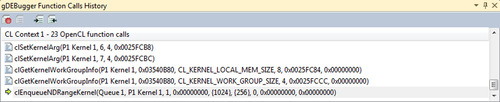
• Record the OpenCL API call history: When the debugged process is suspended, gDEBugger shows us the last OpenCL function call (and its parameters) made in the currently selected context. Figure 12.10 shows how gDEBugger provides a back-trace of the OpenCL commands invoked by the program.
• Program and kernel information: OpenCL contexts contain multiple program and kernel objects within them. gDEBugger allows us to verify which programs are associated with each context. If the program was created using clCreateProgramWithSource, we can also view the source code passed to this function.
• Image and buffers' data: An OpenCL context will contain buffers and images. gDEBugger allows us to view the object's data. For Image types, gDEBugger allows us to see the image data visualized in the “Image view.”
• Memory checking: gDEBugger allows us to view the memory consumption for a specific context's buffers. The memory checking functionality provided by gDEBugger can be used to trace memory leaks and unneeded objects that were created or were not released in time, consuming device memory and making debugging more difficult.
• API usage statistics: gDEBugger shows statistical information about the currently selected context's API usage. By viewing a breakdown of the OpenCL API calls made in this context by various categories, we can see the number of times a function is called. This allows us to understand the performance of different runtime functions for different implementations and devices.
Kernel Debugging
gDEBugger also enables debugging within the compute kernel that is executing on the device. There are two ways to start debugging an OpenCL kernel with gDEBugger:
1. Setting a breakpoint in the kernel code
2. Stepping into the kernel execution from its corresponding clEnqueuNDRangeKernel call
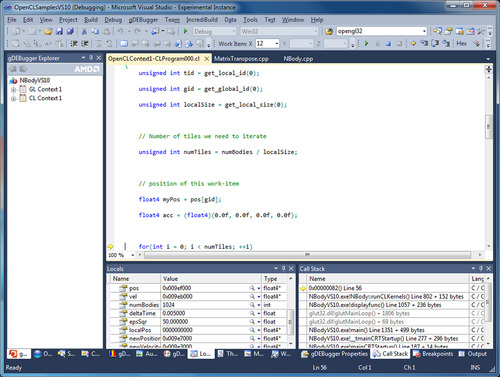
A common concern when debugging an OpenCL application is keeping track of state in the presence of a large number of work items. A kernel on a GPU device will commonly be launched with many thousands of work items. gDEBugger assists the developer by allowing us to focus on a particular active work item by displaying the work item's variable's values and enforcing possible breakpoints for the work item. Figure 12.11 shows the appearance of OpenCL kernel code while debugging with gDEBugger.
AMD Printf Extension
The AMD printf extension is another useful debugging tool. The printf extension is enabled by adding the line #pragma OPENCL EXTENSION cl_amd_printf : enable to the kernel source code. OpenCL extensions were described in detail in Chapter 11. The pragma lets the OpenCL compiler know about the possible usage of the printf function within a kernel body.
As seen in the following vector addition code, the usage of printf for OpenCL kernels is similar to its usage in C/C++ programming. Note that printf outputs the results of the format string for every work item of the NDRange on which it will be executed.
#pragma OPENCL EXTENSION cl_amd_printf : enable
//! Simple example showing usage of printf in a vector add kernel.
__kernel void vec_add(__global float * d_ip1, __global float * d_ip2, __global float d_op, int N)
{
int tid = get_global_id(0)
if (tid < N)
{
float value_0 = d_ip0[tid];
float value_1 = d_ip0[tid];
//This line will print out the format string below ‘N’ times.
printf(“Values read in %f %f
”, value_0, value_1);
d_op[tid] = value_0 + value_1;
}
}
..................Content has been hidden....................
You can't read the all page of ebook, please click here login for view all page.