

12.14 Flotation Cell and Gas Dispersion Characterization
Improvements in flotation cell operation require parameters that can be measured and are related to the recovery and separation processes. The initial work adapted the approach taken to characterize mixers, leading to a series of scale-up criteria. Later work focused on the properties of the air dispersed into bubbles. Both approaches are briefly reviewed.
12.14.1 Mechanical Cell Scale-Up Parameters
Partly based on fluid mixing and gas–liquid reactor design in chemical engineering (Oldshue, 1983), several scale-up numbers have been used in flotation cell design (Harris, 1976; Harris, 1986; Deglon et al., 2000). Power intensity is the net power per unit volume (PI=Pnet/V) with typical values 1–3 kW m−3 but the range can extend from 0.8–9.5 kW m−3 (Deglon et al., 2000). Power number is the ratio of net power to theoretical power (NP=Pnet/ρN3D5), where ρ is the effective fluid density, N is impeller speed (rps), and D is the diameter of the impeller. Typical values are 3.4–6.6. Note that introducing air lowers the effective density and the net power. Impeller tip speed (S=πND) is typically 5–7 m s−1 but can go as high as 10 m s−1. Recalling that power goes up as N3 energy costs and motor size increase quickly with increasing N. Air flow number is the ratio between air flowrate and theoretical pumping rate (NQ=Q/ND3) where Q is volumetric air flowrate (m3 s−1). The range is quite large, 0.01–0.25, and thus NQ is more a guideline than a scale-up criterion. Air flow velocity is the ability of the impeller to handle the volumetric flowrate of gas (UQ=Q/D2). Again a wide range is reported, 0.02–0.5 m s−1, so not strictly a scale-up number. The air flow velocity is related to the gas superficial velocity (Jg see Section 12.14.2) as there is usually a relationship between impeller size and cell size.
The scale-up parameters lack an important component of the flotation system: bubble size. Bubble size measurement is now included as one of the gas dispersion parameters (Harbort and Schwarz, 2010).
12.14.2 Gas Dispersion Parameters
This term, also referred to as “hydrodynamics”, is applied to a suite of measurements: BSD, gas superficial velocity (Jg), GH (εg), and the derived parameter BSAF (Sb). Given its importance in controlling bubble size, determination of the frother concentration also now tends to be included in the suite. Relationships among these parameters are used in cell characterization. Measurements and applications are reviewed in detail by Gomez and Finch (2007), Harbort and Schwarz (2010), and Nesset (2011).
An obstacle to measurement of BSD in industrial machines is the presence of slurry. The last 20 years have seen several measurement techniques developed for flotation systems (Randall et al., 1989; Yianatos et al., 2001; Gomez and Finch, 2002; Grau and Heiskanen, 2002; Rodrigues and Rubio, 2003; Miskovic and Luttrell, 2012). Most are variations on sampling bubbles to present to an imaging camera. The McGill Bubble Size Analyzer (Gomez and Finch, 2007), which has a viewing chamber with a sloped window to spread bubbles into a near monolayer and give an unambiguous focal plane (Figure 12.93), has gained quite wide acceptance (Harbort and Schwarz, 2010). A related device is the Anglo Platinum Bubble Sizer, which combines BSD with measurement of superficial gas velocity. The BSD can be output as number frequency, surface area or volume. Treating the full distribution is cumbersome and a single metric (mean) is preferred. The two most common are the arithmetic mean (D10) and the Sauter mean diameter (D32) given by, where di is bubble diameter:
(12.55)
(12.56)

The Sauter mean size gives the same surface area to volume ratio as the BSD, and as collection of particles depends on bubble surface area, D32 is considered the appropriate flotation metric. The Sauter mean is derived by preservation of volume and surface area by solving the following system of two equations:
(12.57)
(12.58)
where n32 is the number of bubbles (note, not the actual number as we cannot satisfy three constraints simultaneously). The D32 is always greater than D10; the closer they are the narrower the distribution. In most flotation cells, the bubble size range is approximately 0.5 < D32 < 2.5 mm.
Gas superficial velocity (or just air velocity) is the volumetric air flowrate divided by cell cross-sectional area. The common unit is cm s−1. With measurement of volumetric air rate to the cell, this definition works, provided the sectional area of the cell is well defined as, for example, in a flotation column. In many cases the area is difficult to ascertain because of baffles and launder inserts. Measurement is then made locally. This is achieved by a variety of methods, all based on collection of rising bubbles in a vertical tube filled with water. Measurement can be direct, using a flow meter on the exit of the tube to measure air rate and dividing by the tube cross-sectional area (Figure 12.94(a)); by measuring the rate of descent of the water in a transparent tube once the exit valve is closed (Figure 12.94(b)), which approximates the air velocity; or by measuring the rate of increase in pressure once the exit valve is closed (Figure 12.94(c)) where, with pressure in cm water, the rate of increase approximates the air velocity. Strictly, corrections to the latter two measurements are required for comparison between different locations (Gomez and Finch, 2007). The first and third methods give opportunity to record data; the second is the simplest (and is the technique used in the Anglo Platinum Bubble Sizer).

The air velocity depends on the local cell cross-sectional area, which will vary with inserts such as internal launders. The sensor is best located at some repeatable point in the cell, for example, the same position relative to the impeller shaft, and which is accessible to all cells to be measured, for example, in a bank. The Jg can be calibrated against the control room air flowrate in the case of cells with individual air flow measurement.
The third gas dispersion measure, GH, is the fraction of air in the air–slurry mix. It can be measured manually by trapping a sample of cell contents and allowing air to escape and recording the drop in slurry volume. Attention is required with this method to ensure the sampling chamber is initially filled with aerated slurry. Automatic methods use electrical conductivity or sonar-based technology (Figure 12.95). The conductivity technique uses two “flow conductivity cells,” one measuring air–slurry conductivity and the other, excluding air using a “syphon cell”, measuring slurry only conductivity, the ratio of the two signals being used to calculate GH from a fundamental model due to Maxwell (Gomez and Finch, 2007). The sonar-based technology uses the velocity of acoustic waves to determine GH (Chapter 3, Section 3.3.6).

GH increases as air flowrate to the cell is increased and increases by adding frother, which reduces bubble size and bubble rise velocity. The relationship between GH and air velocity can be used to define the cell operating range. An example is Figure 12.96: the operating range is the linear section. The trend is linear up to a certain air velocity, ca. 2.2 cm s−1 in this case, above which the cell “boils”; that is, the air rate exceeds the flow that can be dispersed by the mechanism and large bubbles (“slugs”) form which disrupt the froth. In that situation the air dispersing mechanism is said to be “flooded.” The upper air velocity limit is dictated by the GH. The maximum GH is typically about 15% (the dashed line on the figure). The 15% GH maximum may be reached at quite different air velocities, depending on bubble rise velocity: small bubbles rising slowly due to frother addition (or high salt content) may result in GH reaching 15% at Jg < 1 cm s−1. In carefully operated laboratory columns the 15% maximum GH can be well exceeded.
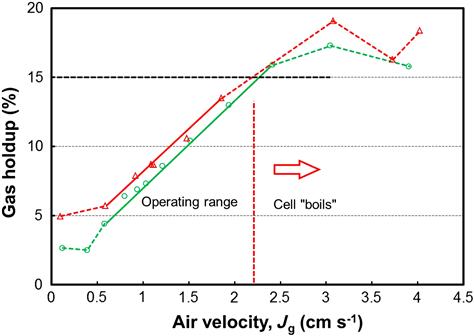
A lower air velocity limit is determined in some cases by solids sanding out. In the example in Figure 12.96 there appears to be a minimum GH at Jg ~ 0.5 cm s−1; this usually indicates air coming from upstream (e.g., the neighboring upstream cell). Determining the cell operating range is essential in designing air distribution strategies to avoid setting an air velocity that is either too high or too low.
Flotation kinetics is related to GH. The relationship can be understood by noting that the specific surface area of bubbles (i.e., surface area relative to air volume, units length−1), which drives collection of particles, increases linearly with GH, as discussed in Section 12.9.5.
The last gas dispersion parameter is the BSAF, the bubble surface area per unit time per unit area. Introduced in Section 12.5.1, to remind it is calculated from (remembering to convert D32 to cm if Jg is in cm s−1):
(12.7)
The common unit is m2 m−2 s−1 or s−1. The pulp zone flotation rate constant k has been shown to be linearly related to Sb as discussed in Section 12.9.3.
The gas dispersion measurement devices (sensors) have seen a variety of applications. An early use was troubleshooting, identifying malfunctioning valves and air flow meters (Dahlke et al., 2001). Measuring bubble size given by Microcel™ spargers helped justify their replacement of perforated rubber spargers in a flotation column (Hernandez-Aguilar et al., 2010). Comparison of a jet sparger, Microcel™, and a mechanical cell showed the latter was hard to match for fine bubble production (Finch et al., 2007b). Low recovery of Pt minerals at Lac des Iles was traced to large bubbles in the downstream cells of the bank, which was corrected by addition of frother (Hernandez-Aguilar et al., 2006). That same work also noted the differences in bubble size between lab, pilot, and the full size units, a problem in scaling kinetic data. Derived from a bubble size database, a bubble size prediction model has been used to benchmark operations (Figure 12.97), for example, to identify possible opportunities for bubble size reduction by addition of frother (Nesset et al., 2012). Several groups have addressed the role of impeller speed on bubble size, as reviewed by Amini et al. (2013). It would seem that in commercial scale cells the effect of tip speed over a wide range, 5–9 m s−1, does not have much impact on bubble size. Impeller speed will affect bubble–particle collision rates and thus have an impact on flotation kinetics, but it does mean that seeking the source of increased kinetics with impeller speed (or power) does not have to consider any role of bubble size. Training sessions to transfer gas dispersion technology to operations have been known to identify opportunities, leading to improved performance (Sweet et al., 2013).

12.14.3 Cell Power and Hydrodynamics
This section started with parameters, some of which reflected power dissipation in the cell, then moved to hydrodynamics. Clearly we need to integrate both aspects. This is being aided by new instrumentation to measure flow patterns and turbulence in a cell (e.g., Yang and Telionis, 2012; Amini et al., 2013). Integration of power measurements and hydrodynamics is being applied to analyze the new generation of large tank cells, and coupled with CFD modeling, further advances are envisaged (Grönstrand et al., 2012).
12.15 Control of Flotation Plants
Process control is increasingly used in flotation circuits, the strategies being almost as numerous as the number of plants involved. The key when considering the metallurgical performance (i.e., grade and recovery) is online chemical analysis (Chapter 3), which produces real-time analysis of the metal composition of process streams. This being said, the most fundamental objective in industrial practice is to achieve effective regulatory control, enabling a steady operation (e.g., flowrates, densities, froth depth), which is an absolute prerequisite to reach and maintain target key production indicators. It must be emphasized that regulatory control does not generally rely on on-stream chemical analysis.
Control strategies are implemented in distributed control systems (DCS) or programmable logic controllers (PLC), and sometimes in advanced process control systems (additional hardware external to the plant main control system), mainly for model-based predictive control (MPC) and fuzzy logic (FL) applications. There are many vendor-supplied solutions available.
Although several successful applications have been reported, in reality few if any plants can claim to be fully automatic in the sense of operating unattended over extended periods. This is despite the availability of robust instrumentation, a wide range of control algorithms (PID (proportional-integral-derivative)-based, MPC, and FL), and powerful computing assets. McKee (1991) reviewed some of the reasons explaining this gap, observations that remain pertinent today. The main problems have been in first stabilizing a complex process in a sustainable manner, and then developing process models that will define set-points and limits to accommodate changes in ore type, mineralogy, texture, chemical composition of the mine water, and contamination of the feed.
Process control practitioners Ruel (2007) and Bouchard et al. (2010) have more recently identified fundamental reasons why process control has been unsuccessful in many cases, among them:
• inadequate installation and maintenance of instrumentation and control elements,
Ruel (2007) presented astonishing figures that 30% of control valve installations are in poor mechanical condition, 85% of PID controllers exhibit inadequate tuning, and 85% of control loops are not performing according to the design objective. With all these commonly encountered problems, only 25% of control loops perform better in automatic mode than in manual mode. Fortunately, these housekeeping issues can be tackled.
12.15.1 Instrumentation
It is essential that all online instrumentation be regularly serviced and calibrated according to a scheduled program. However, this alone is not sufficient. Instruments must be installed following industry best practices to avoid problems such as systematic biases, premature wear, catastrophic failure, or lack of accuracy and precision. For instance, pH probes must not only remain clean, but they also have to be judiciously positioned. Factors to be considered include:
As the latter distance increases, more time is allocated for the reagent to react and the mixing tends to improve, thus increasing the likelihood of exposing the probe to a representative sample. On the other hand, increasing the distance between the points of addition and measurement also increases the time before the effect of the reagent on the pH can be detected; or in other words, there is a process time delay. This is detrimental for both control performance and robustness. The optimal location will establish a compromise between the effects of adequate mixing and minimizing the time delay. Other instruments will likewise require specific best setup arrangements.
A comprehensive control system thus involves investment that may seem significant, but that generally represents only 1–1.5% of the total project capital outlay. Moreover, the payback period of process control projects typically lies within the first year following commissioning. Figure 12.98 shows the instrumentation requirement for a simple feedforward strategy, which could assist in control of a sulfide rougher bank; and Figure 12.99 depicts the instrumentation used in the 1970s at Mount Isa copper flotation circuit in Queensland, Australia (Fewings et al., 1979).


Lynch et al. (1981) analyzed the cost of such installations. The majority of plants that installed instrumentation for manual or automatic control purposes reported improved metal recoveries, varying from 0.5% to 3.0%, sometimes with increased concentrate grades. Reductions in reagent consumptions in the 10–20% range have also been reported. These figures are still valid today, but it must be emphasized that monitoring capabilities alone (i.e., the instrumentation) are generally not enough, and to enable real and sustained savings requires the implementation of control loops.
12.15.2 Process Control Objectives
Implementation of high-level control strategies, involving grades and recoveries, at the plant design stage is challenging, partly because the most significant control variables are often not identified until plant operational experience has been gained, and partly because process control standards have not yet been well defined. Even following commissioning, the training of production and metallurgical staff in the principles and application of process control systems is not always straightforward. A shortage of skilled control engineers exacerbates the situation. The most successful applications have been those where the control room operator can interact with the plant control system when necessary to adjust set-points and limits. This allows taking advantage of the complementarity qualities of the human, able to cope with extraordinary situations, and a PLC or a DCS, constantly vigilant, not being affected by shift changeovers, coffee breaks, and other interruptions.
The aim of high-level control strategies should be twofold:
Controlling the circuit at the optimal operating point will produce the most economic return based on throughput, as depicted in Figure 12.100, despite disturbances entering the circuit.

Disturbances caused by variations in feed rate, pulp density, and particle size distribution should be minimal if grinding circuit control is properly implemented. That being said, surge capacities, such as pump boxes and conditioning tanks, must be used to help maintain a steady throughput. Tight level control must then be avoided, as the slurry volume should be allowed to fluctuate within a certain operating range, thus allowing the buffering of disturbances, as long as complete cell drainage and pulp overflow are avoided.
The prime function of flotation control is to compensate for variations in mineralogy and floatability. Manually or automatically manipulated variables affecting this include: mass flowrates; reagent and air addition rates; pulp and froth levels; pH; and circulating loads through the control of cell-splits on selected banks. Best practice involves establishing basic control objectives, such as stabilizing control of pulp and sump levels, air, and reagent flows. More advanced stabilizing control can then be attempted, such as pH, reagent ratio control (based on plant input flows and assays), pulp flow, circulating load, concentrate grade, and recovery. Finally, true optimizing control can be developed, such as maximum recovery at a target grade. In any case, higher level optimizing control is generally not possible until stable operation has first been achieved (Bouchard et al., 2010). It is worth mentioning in this regard that simple, but properly implemented stabilizing control generally enables metallurgical gains deriving from the steadier operation.
12.15.3 Fundamental Controlled Variables: Pulp Level, Air Rate, pH, and Reagent Addition
The key variable to control is the pulp level in the cell, to ensure stable and efficient flotation performance. The pulp level can be measured by a number of different means. The most common and reliable system is a “float” resting at the froth/pulp interface, coupled with an ultrasonic sensor. The float is connected to a vertical shaft mounted with a plate target. The instrument measures the time sound waves take to reach the plate target and return to the source, and infers how far the float moves as the pulp level changes. A properly designed and maintained sensor of this kind is generally expected to be responsive (time constant less than a second), smooth, and nonoscillating. One problem that can occur is build-up of solids on the float altering its density.
Other systems such as conductivity probes, and differential pressure gauges are also in use in mineral processing plants. Conductivity probes register the difference in electrical conductivity between the froth and the pulp to determine the pulp level. Differential pressure cells are submerged in the flotation tank and measure the static head exerted by the slurry above. Image-based techniques have also been proposed (Jampana et al., 2009).
Control of pulp level is effected by dart valves or pinch valves. In older flotation plants, movable weirs are also used. In general, each bank of cells will have a level detection transducer (usually a float-based device) and the level is then controlled by a simple feedback PI loop which adjusts the valve on the bank tailings outlet based on a set-point either entered by the operator or determined by a higher-level control strategy responding to changes in grade, recovery, froth condition, or other criteria. Feedforward, in combination with feedback control, is often required to avoid disturbing interactions between different flotation banks. Feedforward control is based on feed flow measurement or inference (e.g., from a variable speed pump or preceding level controllers).
Level control can either be simple, as outlined above, or involve more complex interactions (Kämpjärvi and Jämsä-Jounela, 2003). Float-Star™, developed by Mintek in South Africa, is one example of an integrated package providing level control throughout a flotation circuit, and additional capabilities such as an algorithm to calculate optimum level set-points and/or aeration rates that aim to optimize the residence times, mass pulls, and circulating loads within a flotation circuit (Singh et al., 2003). Another, more current example, is Portage Froth Characterization System® (PFC), from Portage Technologies in Canada, implemented in the control system (DCS or PLC) (Kewe et al., 2014), and allowing monitoring of froth characteristics (bubble size classification, velocity, stability, texture, and color) for process control purposes.
There is interest in monitoring and controlling the air flowrate to flotation cells which promise metallurgical gains (Section 12.10). In forced air flotation systems (e.g., tank cells and flotation columns), the available technology (flowrate sensors and butterfly valves) enables managing how much gas is introduced to the cell. Shean and Cilliers (2011) provide a comprehensive review on this topic. The case of self-aspirated cells is not as straightforward as the air addition rate is mainly dictated by the impeller speed and pulp level.
Control of slurry pH is an important requirement in many selective flotation circuits, the control loop generally being independent of the others, although in some cases the set-point is varied according to changes in flotation characteristics. Lime is often added to the grinding mills to minimize media corrosion and to precipitate heavy metal ions from solution. A typical pH control circuit is depicted in Figure 12.101. Lime addition is controlled by ratioing to the solids mass flow to the mill (feedforward control), with or without a bias term. A pH controller adjusts the ratio set-point from the difference between the pH measurement and a set-point established by the operator (feedback control). Lags are sufficient to allow appropriate mixing in the grinding mill.

Control of collector addition rate is sometimes performed by feedforward ratio control based on a linear response to assays or tonnage of valuable metal in the flotation feed. Typically, increase in collector dosage increases mineral recovery until a plateau is reached, beyond which further addition may either have no practical effect, or even a slight reduction in recovery may occur. The gangue recovery also increases with collector addition, such that beyond the plateau region selectivity is reduced, as illustrated in Figure 12.102. The operator can intervene to modify the ratio set-point (slope of the linear function) or bias (intercept of the linear function, see “reagent flowrate” equation below for an example) to respond to changing feed conditions.

The most common aim of collector control is to maintain the addition rate at the leading edge of the plateau, the main difficulty being in identifying this point, especially when the recovery–collector addition response changes due to changes in ore type, or interaction with other reagents. For this reason, automatic control using feedforward loops has rarely been successful in the long term. There are many cases of successful semiautomatic control, however, where the operator adjusts the set-point to accommodate changes in ore type, and the computer controls the reagent addition over fairly narrow limits of feed grade. For example, feedforward control of copper sulfate activator and xanthate to the zinc roughers has been used in the control strategy at Mattagami Lake Mines, Canada (Konigsmann et al., 1976). The reagents were varied in proportion to changes in feed grade according to a simple ratio/bias algorithm, which is a standard feature of all DCSs or PLCs:
where A and B vary for different reagents. The operator may change the base amount A (bias) as different ore types are encountered. Almost four decades later, this kind of strategy has become part of standard practice in several plants. The Raglan Mine mill in Canada, for instance, controls the xanthate addition based on the combined feed grade of copper and nickel.
Although feedforward ratio control can provide a degree of stability, stabilization is more effective using feedback data. The time delay experienced with feedback loops utilizing tailings assays can be overcome to some extent by making use of the fact that the circuit begins to respond to changes in flotation characteristics immediately when the ore enters the bank. This can be detected by measurements in the first few cells. Controlling the rougher concentrate grade is a useful strategy, as this strongly influences the final cleaner concentrate grade.
The amount of frother added to the flotation system is an important variable, but automatic control has been unsuccessful in many cases, as the action of the frother is dependent on only very minor changes in addition rate and is much affected by intangible factors such as contamination of the feed, mine water chemistry, variation in particle composition, etc. At low addition rates, large bubbles are formed and the froth is unstable and recovery of minerals is low, whereas increasing the frother addition rate has a marked effect on increasing the flotation rate, increasing the mass pull and entrainment recovery thus reducing the grade of concentrate produced. The usual approach is to manually adjust the frother set-point, or less commonly to ratio the frother to the feed rate of solids and water.
12.15.4 Higher Level Controlled Variables: Mass Pull, Grade, and Recovery
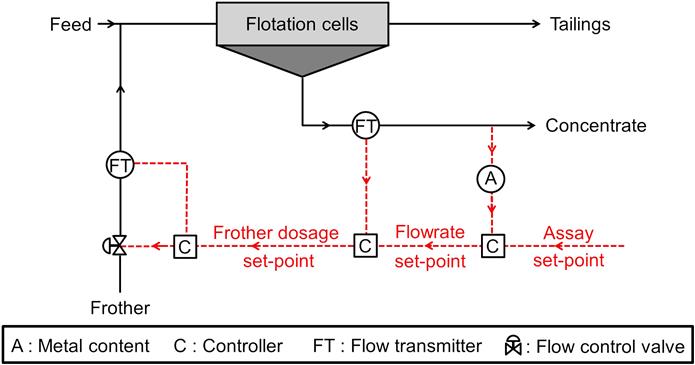
From the perspective of controlling the metallurgical performance, frother dosage is not a controlled variable per se, but rather a manipulated variable as it highly impacts the flowrate of concentrate. Some systems capitalize on this feature. Cascade control can be used, where the concentrate grade controls the concentrate flowrate set-point, which in turn controls the frother addition set-point as illustrated in Figure 12.103.
Progress in froth imaging systems, with several off-the-shelf packages available today, opens new opportunities for froth velocity or mass pull control strategies manipulating the froth depth, gas (air) rate and/or the frother addition using standard feedback PID controllers.
Froth depth, gas rate, and frother addition directly affect recovery and can be used to control the concentrate grade, tailings grade, or mass flowrate of concentrate. Aeration and froth depth do not, however, have a lingering effect on subsequent operations (i.e., they provide local cell control), in contrast to frother (or other reagents), which are carried over from cell to cell and from previous stages. Aeration and froth depth are thus often used as primary manipulated variables. Flotation generally responds faster to changes in aeration than to changes in froth depth, and because of this, aeration is often a more effective control variable, especially where circulating loads have to be controlled. There is obviously interaction between frother addition, aeration, and froth depth, and where control loops are used, it is necessary to account for process dynamics and multivariable effects in the control system design. This can be achieved using fine/coarse control, where one variable (e.g., froth depth) is positioned (coarse control) in order to allow another (e.g., gas flowrate) to remain within a workable range to (fine) control the process variable of interest (e.g., concentrate grade). Some progress is reported in manipulating froth depth and air rate down a bank of cells, referred to as “profiling” (Section 12.11.2).
At Porgera in Papua New Guinea, Kewe et al. (2014) implemented a comprehensive system including vision cameras and on-stream analysis integrated with an expert system (AwaRE) strategy. The result was a stabilized circuit with reduced spillage and increased gold recovery by over 1.5%.
12.15.5 Advanced Control
The ultimate aim of a control system is to increase the economic efficiency of the process by seeking the optimal performance. There are several strategies that can be adopted to achieve this. Real-time optimization using quadratic programming has the potential for flotation optimization, but has not yet been used. The method involves periodically adjusting the set-points of the controlled variables in order to minimize an objective function factoring in the economic efficiency. The optimization problem can be stated mathematically as (Edgar et al., 2001):

where x is a vector of n decision variables (i.e., the set-points) with lower and upper bounds l and u, f is the objective/cost function to be minimized, and gi is the problem constraint (e.g., maximum tailings grade), with upper and lower limits ai and bi.
The set-points are then shifted slightly to move in the direction of the optimum, and the process is repeated until an optimum is encountered. Such methods cannot, however, be fully effective unless:
• satisfactory stabilization of plant performance can be achieved over long periods,
• normal operation does not rely on unmonitored/uncontrolled water or reagent addition manually adjusted in the field,
• maintenance issues (mechanical, instrumentation, etc.) are addressed in a timely manner.
McKee (1991) reviewed early attempts of process control applications based on metallurgical objectives, and a few examples from the 1980s were reported by practitioners (Thwaites, 1983; Twidle et al., 1985; Miettunen, 1983). Interest seems to have faded over the years, and plant practice today does not generally rely on process control systems explicitly based on economic criteria. Given how process control capabilities have leapt forward with technological progress in the last decades, this may seem paradoxical. However, considering that plant engineers exclusively dedicated to process control are few in number and that the expertise is now generally sourced outside the organization, it becomes difficult to undertake long term projects, especially with the high personnel turnover rate experienced in the mining industry. These problems make the case for remote control centers (Chapter 3).
A good example of an early implementation of an advanced control strategy is the Black Mountain concentrator in South Africa, which developed a real-time optimization application to control lead flotation (Twidle et al., 1985). Optimizing control calculated the combination of metal recovery and concentrate grade that would achieve the highest economic return per unit of ore treated under the prevailing conditions. The criterion used to evaluate plant performance was the concept of economic efficiency (Chapter 1), in this case defined as the ratio between the revenue derived per ton of ore at the achieved concentrate grade and recovery, and that derived at the target grade and recovery. Target concentrate grade and recovery were calculated from the operating grade–recovery curve, which was continuously updated based on a 24-h data bank, to allow for changes in the nature of the ore, quality of grinding, etc. Many factors influence the optimum combination of recovery and grade, such as commodity prices, reagent and treatment costs, transport costs, etc. The fundamental principle of real-time optimization is that online multivariable linear regression models can predict both the concentrate grade and recovery. The coefficients of the models are continuously updated from the 24-h data bank. Independent variables determining the grade and recovery can be reagent additions, grades of rougher concentrate and cleaner tailings, feed grade, and throughputs. Some independent variables are controllable whilst others are not.
In the last 25 years, adaptive control (Thornton, 1991), expert systems (Kittel et al., 2001; Kewe et al., 2014), and neural networks (Cubillos and Lima, 1997) have all been applied to flotation systems with varying degrees of success. In practice, the sustainability of these types of strategies is always challenging, the use of automatic controllers typically tending to decrease sharply following commissioning.
The texture, velocity, and color of flotation froths are diagnostic of the flotation condition. Skilled operators can use this information to adjust set-points, particularly air addition rates. This function has now been implemented in machine vision systems, which measure these properties online (van Olst et al., 2000; Holtham and Nguyen, 2002; Kewe et al., 2014), allowing control systems to make use of froth characteristics in optimizing performance (Kittel et al., 2001; Kewe et al., 2014). Innovation continues in the field of vision technology, resulting in more consistent and effective measurement. This includes the ability to view various areas of the cell with a single camera as well as better on-board diagnostics that recognize when the signal has become degraded and alarms operations. However, it seems that only froth velocity can currently be monitored with enough robustness to be used as a controlled variable for long-term industrial applications.
12.16 Reagent Addition and Conditioning
Each ore is unique and reagent requirements must be carefully determined by testwork. Guidelines for reagent selection, based on ore type, are available from reagent suppliers based on experience with many operations and with prior testwork programs. One vital requirement of a collector or frother is that it becomes totally dissolved or dispersed prior to use. Suitable emulsifiers must be used if this condition is not apparent.
Selection of reagents must be followed by careful consideration of the points of addition in the circuit. It is essential that reagents are fed smoothly and uniformly to the pulp, which requires close control of reagent feeding systems and pulp flowrate. When possible, frothers are added last, as they do not react chemically and only require dispersion in the pulp and long conditioning times are unnecessary. Adding frothers early can result in froth formation in conditioning tanks due to entrained air, which could cause pulp overflow and potentially cause uneven distribution of the collector.
In flotation, the amount of agitation and consequent dispersion are closely associated with the time required for physical and chemical reactions between the reagents and the mineral surfaces. Conditioning prior to flotation is considered standard practice. Effective conditioning can potentially result in decreased flotation time (i.e., increased rate constant), which is perhaps the most economical way of increasing the capacity of a flotation plant.
Although it is possible to condition in a flotation machine, the practice is generally not economic, although stage-addition of certain reagents is common practice. Many circuits add collector down a bank, particularly at the transition from rougher to scavenger collection. Agitated tanks, into which reagents can be fed, may be interposed between the grinding mills and the flotation circuit as surge capacity, which can stabilize feed rate and grade from the mills. Alternatively, reagents may be added to the grinding circuit in order to ensure optimum dispersion. Tumbling action in the ball mill is ideal for reagent mixing, especially for the case of oily collectors, which require emulsifying and long conditioning times. An added advantage of conditioning in the mill is that the collector is present as new “fresh” mineral surface is being formed, before oxidation can take place. The disadvantage is that control of reagent addition rate can be difficult due to continual minor feed grade fluctuations, and the mill may have a high circulating load which could result in over-conditioning. Where close control of conditioning time is essential, such as in the selective flotation of polymetallic ores, special conditioning tanks may be incorporated. Stage addition of reagents can yield higher recoveries at lower cost than if all the reagent is added at the head of the flotation bank or circuit (Bazin and Proulx, 2001). It is common practice to employ distribution boxes where slurry is split to feed parallel flotation banks. In this case, it is necessary to ensure equal splits between the banks to ensure proper reagent dosing if done after the split, which is not necessarily a simple task.
It is a common finding that the effectiveness of a separation may occur within a narrow pH window, in which case the key to success lies with the pH controller. This is especially true in selective flotation where separation pH may vary from one stage to the next. This, of course, makes it vitally important to regulate reagents to ensure conditions that promote separation. In some sulfide flotation systems control of the pulp potential is important.
Initial pH control is often undertaken by adding dry lime to the fine ore-bins, which tends to reduce oxidation of sulfides. Final close pH control may be carried out on the classifier overflow. Care must be taken to keep lime slurry moving, because otherwise it forms a hard cement within the pipelines. Reagents are typically added via either positive displacement metering pumps or automatically controlled valves, where reagents are added in frequent short bursts from a ring main or manifold. Where small dosages are required, peristaltic pumps can be used, where rollers squeeze a carrier tube seated in a curved track, thus displacing the reagent along the tube. Solid flotation reagents can be fed by rotating disc, vibro, and belt feeders, but more commonly reagents are added in liquid or slurry form. Data from the pumps and feeders are logged to enable remote monitoring, typically in the control room.
Insoluble liquids such as pine oil are often fed at full strength, whereas water-soluble reagents are made up to fixed solution strengths, normally about 10%, before addition. Reagent preparation is typically performed on day shifts in most mills, under close supervision, to produce a 24-h supply. Long storage times of reagent solutions should be avoided.
12.17 Flotation Flowsheets and Plant Practice
Although flotation is increasingly used for nonmetallic and oxidized minerals, the main tonnage is currently sulfide minerals of copper, lead, and zinc, often associated in complex ores. Comprehensive reviews of the complete range of sulfide, oxide, and nonmetallic flotation separations can be found elsewhere (Fuerstenau et al., 2007). The following presents example flotation flowsheets for a variety of ore types. The examples were selected to illustrate the variety of reagents, machine types, and circuit configurations encountered in industry. The flowsheets have been taken from recent sources but may not represent current configurations. The first five are examples of sulfide processing, the next three non-sulfides, and the final two energy minerals. All the flowsheets have been redrawn from the originals to try to maintain some uniformity in their presentation. The accompanying descriptions of flotation practice should be read also with reference to Sections 12.4–12.8.
12.17.1 Copper Ores
In 2013, world copper production was over 17 Mt, with over 30% originating from Chile (USGS, 2014). Significant tonnages were also produced in China (9%), Peru (7%), the United States (7%), and Australia (6%) (USGS, 2014). In 2010, four of the five top producing copper mines were located in Chile (Table 12.8).
Table 12.8
Top Producing Copper Mines in 2010 (ICSG, 2010; Schlesinger et al., 2011)
| Mine | Country | Capacity (kt a−1 Cu) |
| Escondida | Chile | 1,330 |
| Codelco Norte | Chile | 950 |
| Grasberg | Indonesia | 780 |
| Collahuasi | Chile | 518 |
| El Teniente | Chile | 457 |
Several copper-bearing minerals are economically extracted (Appendix I), many of which may occur in the same deposit. Copper sulfides in the upper part of an ore body are often oxidized, resulting in the presence of a cap zone containing secondary copper minerals such as malachite (CuCO3·Cu(OH)2) and azurite ((CuCO3)2·Cu(OH)2). Dissolved copper may also pass below the water table into reducing conditions, where high grade secondary sulfides (e.g., covellite (CuS) and chalcocite (Cu2S)) may form.
The development of flotation, coupled with the introduction of vast tonnage open-pit mining methods, had an enormous impact on the copper industry. This made economical the processing of the huge low-grade copper sulfide deposits known as porphyries. Higher demand for copper, coupled with decreasing ore grades, has resulted in the expansion of these operations and prompted the increase in grinding mill and flotation cell size to enable concentrators to process tens of thousands of tons of ore per day.
The exact definition of copper porphyry has long been the subject of debate among geologists. Porphyries are essentially very large oval or pipe-shaped deposits (commonly referred to as disseminated) containing on average 140 Mt of ore, averaging about 0.8% Cu and 0.015% Mo, and a variable amount of pyrite (Sutolov, 1975).
Copper sulfide minerals are readily floatable and respond well to thiol collectors such as xanthates, notably amyl, isopropyl, and butyl. Alkaline circuits of pH 8.5–12 are generally used, with lime controlling the pH and used to depress pyrite. Frother usage has shifted away from natural reagents such as pine oil and cresylic acids, to synthetic frothers such as MIBC and polyglycol-types. Cleaning of rougher concentrates is usually necessary to achieve economic smelter grades (25–50% Cu depending on mineralogy), and rougher concentrates as well as middlings must often be reground for maximum recovery, which is usually between 80% and 90%. Typical flotation feed is ground to ca. 80%−250 µm, rougher concentrates being reground to ca. 80%−75 µm for further liberation. Reagent consumption is typically in the range 1–5 kg lime t−1 ore, 0.002–0.3 kg t−1 of xanthate, and 0.02–0.15 kg t−1 of frother.
All porphyry copper deposits contain at least traces of molybdenite (MoS2), and in many cases molybdenum is an important by-product. Molybdenite, which is naturally floatable, is separated from the copper minerals after regrinding and cleaning of the copper rougher concentrates. Regrinding to promote optimum liberation requires careful control, as molybdenite is a soft mineral which slimes easily and whose floatability decreases as particles become finer (see Section 12.3). Bulk copper–molybdenum concentrates are thickened, after which the copper minerals are depressed, allowing molybdenite to float. Cleaning is important as molybdenite concentrates are heavily penalized by the smelter if they contain copper and other impurities, and the final copper content is often adjusted by leaching in sodium cyanide, which easily dissolves chalcocite and covellite and some other secondary copper minerals. Chalcopyrite, however, does not dissolve in cyanide, and in some cases is leached with hot ferric chloride.
Copper depression is achieved by the use of a variety of reagents, sometimes in conjunction with prior heat treatment. Heat treatment is used to destroy residual flotation reagents and is most commonly achieved by the use of steam injected into the slurry. Depression of chalcopyrite is usually effectively accomplished by the use of sodium sulfide or sodium hydrosulfide. Nitrogen is often used as the flotation gas, which helps avoid loss of reagent by side oxidation reactions and maintains low pulp potential that aids chalcopyrite depression. Other copper depressants are “Nokes Reagent,” a product of the reaction of sodium hydroxide and phosphorus pentasulfide, arsenic Nokes (As2O3 dissolved in Na2S), and thioglycolic acid. Replacement of these environmentally challenging reagents with more benign polymer-based depressants is on-going area of research now showing industrial promise (Section 12.6.5). Ye et al. (1990) have shown that ozone conditioning can also effectively depress copper minerals. The molybdenite is floated using a light fuel oil as collector. There can often be high circulating loads of molybdenite in the common C-CS type circuit (Section 12.11.3) using columns as cleaners and mechanical cells as cleaner–scavengers.
Highland Valley Copper (Teck Resources) located in British Columbia, Canada, is an example of a concentrator that produces copper and molybdenum concentrates. In 2013, the operation processed ca. 45 Mt of ore (ca. 125,000 t d−1) with an average grade of 0.29% Cu (Teck, 2014) producing ca. 113,000 t of copper in concentrate and ca. 2,700 t of molybdenum in concentrate. The major copper-bearing minerals in the ore are chalcopyrite and bornite and the major molybdenum-bearing mineral is molybdenite.
A simplified flowsheet is shown in Figure 12.104 (Damjanović and Goode, 2000; Hernandez-Aguilar, 2010) with an equipment summary in Table 12.9. Crushed ore is divided among three SAG (A, B, and C) and two fully-AG (D and E) grinding lines. Each SAG mill feeds two ball mills, with each AG mill feeding a single ball mill. The AG/SAG mills are in closed-circuit with the AG mills employing pebble crushing. All ball mills are in closed-circuit with hydrocyclones.

Table 12.9
Summary of HVC Bulk Flotation Circuits
| Hydrocyclone Overflow from | No. Banks | Cell Type | No. Rougher Cells | No. Scavenger Cells |
| A+B | 4 | Denver 600 H-DR | 8 | 14 |
| C | 4 | Denver 1275 DR | 3 | 5 |
| D+E | 4 | Denver 300 DR | 3 | 6 |

Note: Denver 600, 1275, and 300 refer to cell volume in ft3.
Fuel oil (0.1 g t−1 ore), PAX (1.1 g t−1), and pine oil (5.5 g t−1) are added in the grinding circuit, which operates at pH 9.2 by lime addition. The hydrocyclone overflow (55% passing 150 µm) from each grinding line reports to one of three bulk Cu–Mo rougher–scavenger–cleaner circuits (modified R-S-C, which includes regrinding of the rougher concentrate, Table 12.7). The scavenger concentrates are recycled to the head of the roughers with the scavenger tailings reporting to tailings impoundment. Dowfroth 250 (7.2 g t−1) and PAX (2.6 g t−1) are stage-added in the bulk rougher–scavenger stages. A, B, and C rougher concentrates feed a regrind ball mill that operates in closed circuit with the cyclone overflow feeding the cleaner (two banks of six cells) and recleaner (two banks of five cells) section (all Denver 300 DR machines). Recleaner tails are fed to the head of the rougher circuit with the concentrate feeding Cu–Mo separation. The bulk cleaning stage pH is maintained at 10.5.
The D+E flotation circuit is operated in a slightly different manner to the A, B, C circuits, with the regrind cyclone overflow feeding two parallel flotation columns (2.13 m diameter). The circuit configuration also allows for tailings from one column to be reground in closed-circuit with the second column acting as a recleaner. For all circuits the column concentrate feeds Cu–Mo separation. The final bulk concentrate (from all bulk flotation circuits) is ca. 36% Cu and 0.7% Mo (Hernandez-Aguilar, 2010).
The bulk concentrate thickener produces an underflow stream ca. 60% solids which is fed to a Cu–Mo separation conditioning tank where sodium hydrosulfide (45 g t−1) addition is used for copper sulfide depression. Fuel oil (0.2 g t−1) is also added as a molybdenite collector. Denver 30 DR cells are configured into 5 roughers and 13 scavengers. Carbon dioxide is used in the first cell to maintain a pH of 9.0. The remaining cells utilize nitrogen as flotation gas to maintain reducing conditions and limit oxidation (loss) of the hydrosulfide. Scavenger tailings constitute the copper concentrate with the scavenger concentrate being recycled to the head of the copper–molybdenum separation circuit. Rougher concentrate is reground and cleaned in two 1 m diameter columns with the concentrate feeding the molybdenum leach plant. Column tailings are recycled to the head of Cu–Mo separation. (Note: current arrangement now employs tank cells and two columns, Hernandez-Aguilar (2010).) Column concentrate is typically 49% Mo and 2.5–3% Cu. Selective copper leaching using ferric chloride in the molybdenum leach plant reduces the final copper content to less than 0.25%.
Bulatovic et al. (1998), Castro and Henriquez (1998), and Amelunxen and Amelunxen (2009) have reviewed the various reagents, machine types, and circuits employed in copper–molybdenum flotation plants.
One of the largest copper concentrators is at the Freeport mine (Grasberg) in Indonesia (Table 12.8). The plant was progressively expanded since initial start-up in 1972 from 7,500 to 200,000 t d−1 to compensate for the lower grade ore encountered as the open pit deepened. The principal copper mineral in the porphyry deposit is chalcopyrite. Gold and silver are also present in the primary ore, which in 2013 graded 0.76% Cu, 0.69 g t−1 Au (Freeport-McMoran, 2013). The operation boasts the largest known gold and third largest copper reserve in the world.
The Grasberg flotation circuit is large (comprising four concentrators), but fairly simple. After primary grinding to produce a flotation feed grind size of 15% passing 212 µm, the ore is conditioned with lime, frother, and collector, before being fed to the rougher flotation circuit, which comprises four parallel banks of nine Wemco 127 m3 cells. The cleaner circuit consists of 14 column cells for primary and secondary cleaning and 12 85 m3 mechanical cleaner–scavenger cells (i.e., C-CS configuration). The concentrate produced from the columns reports to final concentrate, while the concentrate from the scavengers is recycled back to the cleaner feed. In 2006, the Grasberg operation produced 610,800 t of copper and 58,500 g of gold and 174,500 g of Ag (Anon, 2014a). Typical copper and gold recoveries are 86 and 76%, respectively.
The move to ever larger cells driven by the processing of these large tonnage low-grade porphyry copper ores is further illustrated at Chuquicamata (Codelco Norte), another of the world’s large flotation plants (Table 12.8). The newer A1, A2 rougher lines comprise 160 m3 Outotec tank cells, and testing of larger cells is on-going.
By-products play an important role in the economics of the Palabora Mining Co. in South Africa, which treats a complex carbonatite ore to recover copper, magnetite, uranium, and zirconium values. The ore assays ca. 0.5% Cu, the principal copper minerals being chalcopyrite and bornite, although chalcocite, cubanite (CuFe2S3), and other copper minerals are present in minor amounts. The flotation feed is coarse (80%−300 µm) due to the high grinding resistance of the magnetite in the ore, which would increase grinding costs if ground to a finer size, plus the fact that the flotation tailings are treated by low-intensity magnetic separation to recover magnetite, and Reichert cone gravity concentration to recover uranothorite and baddeleyite both of which benefit from the coarser size.
The flotation circuit consists of eight separate sections, the last two sections being fed from an AG grinding circuit. The five parallel sections of the original Palabora flowsheet (Figure 12.105) each operate nominally at 385 t h−1. Flotation feed is conditioned with sodium isobutyl xanthate and frother before being fed to the rougher flotation banks. The more readily floatable minerals, mainly liberated chalcopyrite and bornite, float in the first few cells. Collector is also added before the final scavenger cells to recover the less floatable minerals, such as cubanite and valleriite, the latter a copper–iron sulfide containing Mg and Al in the crystal lattice. Rougher and scavenger concentrates are reground to 90% −45 µm, before being fed to the cleaner circuit at a pulp density of 14% solids. This dilution is possible due to the rejection of magnetite and other heavy minerals into the tailings, and aids separation of the fine particle size produced after regrinding.

12.17.2 Lead–Zinc Ores
The bulk of the world’s lead and zinc is supplied from deposits, which often occur as finely disseminated bands of galena and sphalerite, with varying amounts of pyrite, as replacements in various rocks, typically limestone or dolomite. This banding sometimes allows dense medium preconcentration prior to grinding.
Although galena (PbS) and sphalerite ((Zn,Fe)S) usually occur together in economical quantities, there are exceptions, such as the lead ore body in S.E. Missouri, where the galena is associated with relatively minor amounts of zinc (Watson, 1988), and the zinc-rich Appalachian Mountain region, mined in Tennessee and Pennsylvania, where lead production is small.
Feed grades are typically 1–5% Pb and 1–10% Zn, and although relatively fine grinding (<75 µm) is usually required, fairly high flotation concentrate grades and recoveries can be achieved. In an increasing number of cases, ultrafine grinding down to 10 µm is needed to produce acceptable flotation performance from very fine grained ores such as those at the Century mine in Australia. Typically, lead concentrates of 55–70% lead are produced containing 2–7% Zn, and zinc concentrates of 50–60% Zn containing 1–6% Pb. Sphalerite always contains some Fe in the lattice, which determines the maximum possible Zn concentrate grade. Although galena and sphalerite (including marmatite, sphalerite with high Fe) are the major ore minerals, cerussite (PbCO3), anglesite (PbSO4), and smithsonite (ZnCO3) can also be significant and pose a challenge to flotation. In some deposits, the value of associated metals, such as silver, cadmium, gold, and bismuth, is almost as much as that of the lead and zinc, and lead–zinc ores are the largest sources of silver and cadmium.
Several processes have been developed for the separation of galena from zinc sulfides, but by far the most widely used method is that of two-stage selective flotation, where the zinc and iron minerals are depressed, allowing the galena to float, followed by the activation of the zinc minerals by copper sulfate addition in the lead tailings to allow a zinc float.
Lead (galena) flotation is usually performed at a pH of between 9 and 11. Low-cost lime is typically the preferred reagent for pH control. Not only does lime act as a strong depressant for pyrite, but it can also depress galena to some extent. Soda ash can be substituted in that case, especially when the pyrite content is relatively low.
Heavy metal ions, often present in process waters and derived from the ore, can accidentally activate sphalerite. Lime and soda ash addition in this case can play a deactivating role by precipitating (sequestering) the heavy metals. In most cases other depressants are also required, the most widely used being sodium cyanide (up to 0.15 kg t−1) and zinc sulfate (up to 0.2 kg t−1), either alone or in combination. These reagents are typically added to the grinding circuit, as well as to the lead flotation circuit, and their effectiveness depends on pulp alkalinity.
The effectiveness of depressants also depends on the concentration and selectivity of the collector. Xanthates are most widely used in lead–zinc flotation, and the longer the hydrocarbon chain, the greater the stability of the metal xanthate in cyanide solutions and the higher the concentration of cyanide required to depress the mineral. If the galena is readily floatable, ethyl xanthate may be used, together with a frother such as MIBC. Isopropyl xanthate may be needed if the galena is tarnished, or if considerable amounts of lime are used to depress pyrite. Powerful collectors such as amyl xanthate can be used if the sphalerite is clean and hydrophilic (i.e., highly nonfloatable) and are needed where the galena is highly oxidized and floats poorly.
After galena flotation, the tailings are usually treated with copper sulfate, between 0.2 to 1.6 g Cu per kg Zn. Lime (0.5–2 kg t−1) is used to depress pyrite, as it has no depressing effect on the activated zinc minerals, and a high pH (10–12) is used in the circuit. Isopropyl xanthate is perhaps the most commonly used collector, although ethyl, isobutyl, and amyl xanthates are also used, sometimes in conjunction with dithiophosphate, depending on conditions. As activated sphalerite behaves similarly to chalcopyrite, thionocarbamates are also common collectors, selectively floating the zinc minerals from the pyrite.
Careful control of reagent feeding must be observed when copper sulfate is used in conjunction with xanthates, as xanthates react readily with copper ions. Ideally, the minerals should be conditioned with the activator separate from the collector, so that when the conditioned slurry enters the collector conditioner there is little residual copper sulfate in solution. Although the activation process is fairly rapid in acidic or neutral conditions, in practice it is usually carried out in an alkaline circuit used to depress pyrite flotation, and a conditioning time of ca. 10–15 min is required to make full use of the reagent. The alkali precipitates the copper sulfate as basic compounds which are sufficiently soluble to provide a reservoir of copper ions for the activation reaction. As noted in Section 12.6.1 some operations have switched, to add copper sulfate before final raising of pH.
The fine-grained nature and complexity of some lead–zinc ores has led to the need for ultrafine grinding. Flotation was undertaken at MacArthur River Mine in Australia on material ground to 12 µm to produce a bulk lead–zinc concentrate. At Mount Isa Mines rougher concentrates of lead and zinc are reground to 10 and 15 µm, respectively, prior to cleaner flotation (Young and Gao, 2000). At the Century Mine, zinc concentrates are reground to below 10 µm to effectively liberate fine-grained silicates (Burgess et al., 2003). Ultrafine grinding now commonly employs stirred mills which are more efficient than conventional tumbling mills for this duty (Chapter 7). Due to the high intensity of ultrafine grinding, inert grinding media is often used to prevent release of depressant iron oxy-hydroxyl complexes. The production of ultrafine concentrates usually results in tenacious froths, with pulping and material handling problems being common.
In some cases sphalerite is activated by copper ions released from copper minerals in the ore to such an extent that depression of sphalerite fails, even when the most powerful combinations of reagents, such as zinc sulfate and cyanide, are used. (An example where this problem was overcome by judicious combination of reagents is discussed below under “Cu–Zn ore” processing, Section 12.17.3.) Bulk flotation of lead and zinc minerals may in such cases have a number of economic advantages. Coarse primary grinding is often sufficient with bulk flotation, as the valuable minerals need be liberated only from the gangue, not from each other. The flotation circuit design is normally relatively simple. In contrast, selective flotation calls for finer primary grinding, in order to free the valuable minerals not only from the gangue, but also from each other. This increases grinding mill size and energy requirements.
However, the production of bulk lead–zinc concentrates is only reasonable if there are smelters which are equipped for such concentrates. The only smelting process available is the Imperial Smelting Process (ISP), which was developed at a time when most lead and zinc was recovered from low-pyrite ores. In recent years lead and zinc are increasingly being recovered from complex and highly pyritic ores which is problematic for the ISP process.
Bulk flotation followed by separation can sometimes be used, although subsequent depression of activated sphalerite and pyrite is difficult. Every attempt is made at plants using bulk flotation to use a minimum amount of collector. Bulk flotation followed by selective flotation is performed at the Zinkgruvan mine, Sweden (Anon., 2014b).
12.17.3 Copper–Zinc and Copper–Zinc–Lead Ores
Copper–Zinc Ores
In the flotation of copper–zinc ores, where lead is absent (or is not present in economic quantities), lime is almost universally used to control pH in the range 8–12. In certain instances, the addition of lime to the grinding mills and flotation circuit is sufficient to prevent the flotation of zinc minerals (by precipitating activating heavy metal ions), but in most cases supplementary depressants are required. Sodium cyanide is often added in small quantities (0.01–0.05 kg t−1) to the grinding mills and cleaners. Zinc sulfate is also used in conjunction with cyanide, and in some cases sodium sulfite, bisulfite, or sulfur dioxide depressants are used.
After conditioning, the copper minerals are floated using either xanthates, or if the mineralogy allows, a selective copper collector such as thionocarbamate. Typically, copper concentrates contain 20–30% Cu and up to 5% Zn. Copper flotation tailings are activated with copper sulfate and zinc minerals floated as described above for Pb–Zn ores.
One example of a plant that uses cyanide as a depressant is the Canatuan Cu–Zn operation (TVI Resources) in the Philippines (Umipig et al., 2012). The operation began processing ore of 1.5–2% Cu with low levels of Zn (Cu:Zn ratio of > 5:1). The original plant produced acceptable copper grades by grinding to ca. 120 µm and flotation at a pH of 11.5–12 (using lime) with IPETC (45 g t−1) as collector and Nasfroth HEL frother. No regrinding or cleaning stages were necessary.
In year three of operation, the ore transitioned to higher zinc, which prompted the construction of a Cu–Zn separation circuit. The high zinc grades, coupled with the presence of soluble secondary copper sulfides (67% of copper in the feed is present as chalcocite and 10% as covellite) which released Cu ions into the pulp, led to zinc “super activation.” An extensive laboratory test program led to the development of a complex reagent addition scheme (Figure 12.106) to combat zinc activation. The inclusion of sodium cyanide as a reagent necessitated the implementation of a cyanide detoxification (destruction) circuit.

The new flowsheet (2,500 t d−1 ca. 1.2% Cu and 1.3% Zn) has bulk flotation at pH 11.8 with lime, again using IPETC, but with downstream addition of PAX. The bulk rougher tailings are discarded to the tailings pond with the bulk concentrate reporting to a regrind circuit (P80 ~ 45 µm), followed by Cu–Zn separation (Cu rougher) flotation. Sodium metabisulfite (SMBS) is added to the regrind mills, followed by aeration. The SMBS/aeration step at pH < 7 was key to the collector desorption necessary to effect Cu–Zn separation. The action appears to be due to formation of SO2, which in combination with oxygen forms a powerful oxidizing environment. The Cu-rougher circuit operates at a pH of ca. 10.5, with sodium cyanide and zinc sulfate added to depress (deactivate) the sphalerite. Potassium ethyl xanthate (PEX) is used as a collector in the copper roughers with sodium sulfide stage added to control low pulp potential (−200 mV on SHE scale) and precipitate Cu ions. The Cu circuit concentrate assays ca. 24% Cu and 11% Zn.
The Cu rougher tailings feed the Zn flotation circuit, which consists of a rougher and four counter-current cleaner stages. The reagents (lime, SMBS, PAX, and Nasfroth HEL) are added ahead of an aerator which is held at pH 11. This aeration step effects partial destruction of the cyanide, again likely through SO2/O2 creating strong oxidizing conditions. Notably, copper sulfate addition was not required, the “natural” release of Cu ions providing the necessary sphalerite activation. The zinc rougher tailings undergo final cyanide detoxification (final discharge: CNfree ~ 0.026 ppm, CNwad ~ 0.057 ppm) and then report to the tailings pond. The final zinc concentrate is ca. 52% Zn and 4% Cu.
Copper–Lead–Zinc Ores
The production of separate concentrates from copper–lead–zinc ores is complicated by the similar metallurgy of chalcopyrite and activated zinc minerals. The mineralogy of many of these ores is a complex assembly of finely disseminated and intimately associated chalcopyrite, galena, and sphalerite in a gangue consisting predominantly of pyrite or pyrrhotite (iron sulfides often constitute 80–90% of the ore), quartz, and carbonates. Such massive sulfide ores of volcanosedimentary origin are also a valuable source of silver and gold. Ore grades are 0.3–3% Cu, 0.3–3% Pb, 0.2–10% Zn, 3–100 g t−1 silver, and 0–10 g t−1 gold, on average.
The major processing problems encountered are related specifically to the mineralogy of the assemblies. Due to the extremely fine dissemination and interlocking of the minerals, extensive fine grinding is often required, usually below 75 µm. The New Brunswick deposits in Canada required grinding to 80%−40 µm.
In most cases, concentrates are produced at relatively poor grades and recoveries, typical grades being:
| Cu (%) | Pb (%) | Zn (%) | |
| Copper concentrates | 20–30 | 1–10 | 2–10 |
| Lead concentrates | 0.8–5 | 35–65 | 2–20 |
| Zinc concentrates | 0.3–2 | 0.4–4 | 45–55 |

Recoveries of 40–60% for copper, 50–60% for lead, and 70–80% for zinc are typical for New Brunswick deposits. Smelting charges become excessive with contaminated concentrates, as very rarely is a metal paid for when it is not in its proper concentrate and penalties are often imposed for the presence of zinc and lead in copper concentrates. Silver and gold are well paid for in copper and lead concentrates, whereas payment in zinc concentrates is often zero.
A wide variety of flowsheets are in use involving sequential flotation or bulk flotation of copper and lead minerals followed by separation (Figure 12.52). Bulk flotation of all economic sulfides from pyrite has also been investigated.
The method most widely used to treat ores containing economic amounts of lead, copper, and zinc is to initially float a bulk lead–copper concentrate, while depressing the zinc and iron minerals. The zinc minerals are then activated and floated, while the bulk concentrate is treated by the depression of either the copper or lead minerals to produce separate concentrates.
The bulk float is performed in a moderately alkaline circuit, usually at pH 7.5–9.5, lime, in conjunction with depressants such as cyanide and zinc sulfate, being added to the grinding mills and bulk circuit. Depression of zinc and iron sulfides is sometimes supplemented by the addition of small amounts of sodium bisulfite or sulfur dioxide to the cleaning stages, although these reagents should be used sparingly as they can also depress galena.
The choice and dosage of collector used for bulk flotation are critical not only for the bulk flotation stage but also for the subsequent separation. Xanthates are commonly used, including combinations, and while a short-chain collector such as ethyl xanthate gives high selectivity in floating galena and chalcopyrite and permits efficient copper–lead separation, it does not allow high recoveries into the bulk concentrate, particularly of the galena. Much of the lost galena subsequently floats in the zinc circuit, contaminating the concentrate, as well as representing an economic loss. Because of this, a powerful collector (i.e., longer chained) such as amyl or isobutyl xanthate is commonly used, and close control of the dosage is required. Usually, fairly small collector additions, between 0.02 and 0.06 kg t−1, are used, as an excess makes copper–lead separation difficult, and large amounts of depressant are required, which may depress the floating mineral.
Although the long-chain collectors improve bulk recovery, they are not as selective in rejecting zinc, and sometimes a compromise between selectivity and recovery is needed, and a collector such as isopropyl xanthate is chosen. Dithiophosphates, either alone or in conjunction with xanthates, are also used as bulk float collectors, and small amounts of thionocarbamate may be used to increase copper recovery.
The choice of the method for separating copper and lead minerals depends on the response of the minerals and their relative abundance. It is preferable to float the mineral present in least amount, for example, galena depression is usually performed when the ratio of lead to copper in the bulk concentrate is greater than unity.
Lead depression is also undertaken if economic amounts of chalcocite or covellite are present, as these minerals do not respond to depression by cyanide, or if the galena is oxidized or tarnished and does not float readily. It may also be necessary to depress the lead minerals if the concentration of copper ions in solution is high, as may be the case due to the presence of secondary copper minerals in the bulk concentrate. The standard copper depressant, sodium cyanide, combines with these ions to form complex cuprocyanides, thus reducing free cyanide ions available for copper depression. Increase in cyanide addition only serves to accelerate the dissolution of secondary copper minerals.
Depression of galena is achieved using sodium dichromate, sulfur dioxide, and starch in various combinations, whereas copper minerals are depressed using cyanide, or cyanide–zinc complexes. Methods of depression used at various concentrators can be found elsewhere (Wills, 1984).
In some plants, galena depression is aided by heating the slurry to about 40°C by steam injection. Kubota et al. (1975) showed that galena can be completely depressed, with no reagent additions, by raising the slurry temperature above 60°C. The xanthate adsorbed on the galena is removed, but that on the chalcopyrite surface remains. It is thought that preferential oxidation of the galena surface at high temperature is the mechanism for depression. At Woodlawn in Australia, the lead concentrate originally assayed 30% Pb, 12% Zn, 4% Cu, 300 ppm Ag, and 20% Fe, and received very unfavorable smelter terms (Burns et al., 1982). Heat treatment of the concentrate at 85°C for 5 min, followed by reverse flotation, gave a product containing 35% Pb, 15% Zn, 2.5% Cu, 350 ppm Ag, and 15% Fe, with improved smelter terms.
At the Brunswick Mining concentrator in Canada (McTavish, 1980; Damjanović and Goode, 2000), the bulk copper–lead concentrate is conditioned with 0.03 kg t−1 of a wheat dextrin–tannin extract mixture to depress the galena, and then the pH is lowered to 4.8 with liquid SO2. The slurry is further conditioned for 20 min at this low pH, then 0.005 kg t−1 of thionocarbamate is added to float the copper minerals. The rougher concentrate is heated by steam injection to 40°C, and is then cleaned three times to produce a copper concentrate containing 23% Cu, 6% Pb, and 2% Zn. The lead concentrate produced is further upgraded by regrinding the copper separation tails, and then heating the slurry with steam to 85°C, and conditioning for 40 min. Xanthate and dithiophosphate collectors are then added to float pyrite. The rougher concentrate produced is reheated to 70°C and is cleaned once. The hot slurry from the lead upgrading tailings contains about 32.5% Pb, 13% Zn, and 0.6% Cu, and, after cooling, is further treated to float a lead–zinc concentrate, leaving a final lead concentrate of 36% Pb and 8% Zn. The Brunswick concentrator experienced a marked summer–winter change in metallurgical performance which correlated with changes in the thiosulfate levels in the recycle waters drawn from the tailings pond. Other operations in Canada, at least, note a similar shift in metallurgy with the season.
A simplified Brunswick flowsheet is shown in Figure 12.107 (Orford et al., 2005). It is similar to the type “c” circuit in Figure 12.52. Some specific features are: the Cu–Pb circuit includes a flotation stage after the SAG mill (“stage flotation”) aimed at early removal of galena to reduce release of activating Pb ions; the Zn circuit is an example of the R-C-SC arrangement (Table 12.7), in this case with four cleaning stages (i.e., R-C4-CS); the Pb upgrading circuit produces a pyrite concentrate primarily sent to tailings but with a side stream (indicated by dashed arrow) going to the Pb concentrate to maintain the pyrite “fuel” demanded by the Pb smelter. Although now closed (as of 2013), the experiences at the Brunswick Mine concentrator detailed in Orford et al. (2005), including the extensive use of the six sigma statistical toolbox, should prove invaluable to future Cu–Pb–Zn operations.

In general, where the ratio of lead to copper in the bulk concentrate is less than unity, depression of the copper minerals by sodium cyanide may be preferred. Where standard cyanide solution may cause unacceptable dissolution of precious metals and small amounts of secondary copper minerals, a cyanide–zinc complex can sometimes be used to reduce these losses. At Morococha in Peru (Pazour, 1979), a mixture of sodium cyanide, zinc oxide, and zinc sulfate has been used, allowing a recovery of 75% of the silver in the ore (Ag head grade ca. 120 g t−1). Zinc oxide can prove superior to zinc sulfate for sphalerite depression, but is not necessarily the economic choice (Umipig et al., 2012).
Close alkalinity control is necessary when using cyanides, a pH of between 7.5 and 9.5 being common, although the optimum value may be higher, dependent on the ore. Cyanide depression is not used if economic quantities of chalcocite or covellite are present in the bulk concentrate, since it has little depressing action on these minerals. As cyanide is a very effective sphalerite depressant, most of the zinc reporting to the bulk concentrate is depressed into the copper concentrate, which may incur smelter penalties. Cyanide, however, has little action on galena, allowing effective flotation of the galena from the chalcopyrite, and hence a low lead copper concentrate. Lead is never paid for in a copper concentrate and is often penalized.
In a few cases, adequate metallurgical performance cannot be achieved by bulk flotation, and sequential selective flotation must be performed. This necessarily increases capital and operating costs, as the bulk of the ore—often iron sulfide gangue minerals—is present at each stage in the separation, but it allows use of selective reagents to suit the mineralogy at each stage. The general flowsheet for sequential flotation involves conditioning the slurry with SO2 at pH 5–7, and using a selective collector such as ethyl xanthate, dithiophosphate, or thionocarbamate, which allows a copper concentrate that is relatively low in lead to be floated. The copper tailings are conditioned with lime or soda ash, xanthate, sodium cyanide, and/or zinc sulfate, after which a lead concentrate is produced, the tailings being treated with copper sulfate prior to zinc flotation.
Sequential separation is required where there is a marked difference in floatability between the copper and lead minerals, which makes bulk rougher flotation and subsequent separation of the minerals in the bulk concentrate difficult, as at the Black Mountain concentrator in South Africa (Beck and Chamart, 1980). Metallurgical development at Woodlawn in Australia was an ongoing process. The original circuit, designed to depress lead with dichromate, was never effective for various reasons, and a combination of bulk and sequential flotation was then used (Roberts et al., 1980; Burns et al., 1982). The feed, containing roughly 1.3% Cu, 5.5% Pb, and 13% Zn, was conditioned with SO2, starch, SMBS and a dithiophosphate collector, after which a copper concentrate was produced, which was cleaned twice. The copper tailings were conditioned with lime, NaCN, starch, and secondary butyl xanthate prior to flotation of a lead concentrate, which contained the less floatable copper minerals. This concentrate was reverse cleaned by steam heating to 85°C prior to flotation of the copper minerals with no further reagent addition. The floated copper minerals were pumped to the initial copper cleaning circuit. Lead rougher tailings fed the zinc roughing circuit.
12.17.4 Nickel Ores
Nickel is produced from two main sources: sulfidic ores and lateritic ores. Seventy percent of land-based nickel resources are contained in lateritic deposits, though the majority of the world’s current production of nickel still derives from sulfidic sources (Bacon et al., 2002). The dominant nickel mineral in these deposits is pentlandite—(NiFe)9S8. However, many ores also have minor amounts of millerite (NiS) and violarite (Ni2FeS4). Nickel can also be found within the pyrrhotite (Fe8S9) lattice, substituting for iron. In some Sudbury area deposits of Canada, up to 10% of the nickel is in pyrrhotite (Kerr, 2002). Depending on the downstream smelting requirements, nickel flotation can occur by two processes: bulk sulfide flotation (e.g., in Western Australia’s nickel operations) or separate Ni-mineral flotation (e.g., Canada’s Sudbury area). In addition to iron sulfides, nickel often occurs with economic concentrations of copper (Sudbury), cobalt (Western Australia), and precious metals such as gold and platinum-group metals (e.g., Sudbury operations, the Noril’sk operation in northwest Siberia, and in the Bushveld Complex in South Africa). Kerr (2002) reviewed six of the major nickel flotation operations, which include those in Sudbury, Western Australia, and Russia.
Figure 12.108 shows an example nickel–copper processing flowsheet from Vale’s Clarabelle mill (Doucet et al., 2010). Typical head grades are ca. 1.2% Ni (primarily pentlandite) and 1.3% Cu (primarily chalcopyrite), 20% pyrrhotite, and 75% NSG. The feed first undergoes magnetic separation. The magnetic stream (rich in pyrrhotite) is reground and feeds a flotation circuit in rougher–cleaner arrangement. Rougher tailings (largely comprising magnetic pyrrhotite) are discarded as final sulfide tailings, while the cleaner concentrate reports to final nickel concentrate. Cleaner tailings are recycled to the regrind mill. The non-magnetic stream reports to a rougher (A+B)-scavenger circuit. The rougher A concentrate comprises the fast floating copper minerals, which are upgraded in a copper rougher–scavenger–column cleaner arrangement (Cu circuit) to produce copper concentrate, and the copper scavenger tailings reporting to the final nickel concentrate. (The Cu circuit includes recycle of column tails to the scavenger, making it an R-S-C-CS circuit.) The rougher B and the scavenger have their own cleaning stages in a modified (R-C-CS)2 type circuit. The rougher B concentrate is reground and cleaned (cleaner B) with concentrate reporting to final nickel concentrate and tails to the scavenger/cleaner. The scavenger concentrate is thickened and cleaned (scavenger/cleaner), with concentrate joining rougher B concentrate for regrinding and the tails reporting to final sulfide tailings. Scavenger tails is the final non-sulfide tailings, the scavenger acting to divide the rougher B tails into sulfide and non-sulfide fractions. The non-sulfide tailings are used to build tailings dams, while the sulfide tailings are impounded underwater at the center of the dams (Kerr, 2002). In this manner, oxidation of the sulfides to produce acid run-off (acid rock drainage) is contained (see Chapter 16).

PAX is used as the collector and Unifroth 250 C (a PPG methyl ether) as frother (Kerr, 2002). Kerr (2002) discusses the importance of pyrrhotite rejection in the flowsheet. The presence of nickel and copper ions in solution can result in pyrrhotite activation. The combination of TETA with sodium sulfite is used to minimize activation.
Vale’s Sudbury operation also includes a Matte Separation plant, a mineral processing plant in the smelter. Matte is slowly cooled to enlarge the mineral grains, ground, passed over magnets to remove a Cu/Ni alloy, then floated to produce Cu concentrate (chalcocite) and Ni concentrate (heazelwoodite), which are sent to their respective smelters.
12.17.5 Platinum Ores
Platinum is one of the Platinum Group Metals (PGMs), which also include palladium, iridium, osmium, rhodium, and ruthenium. They are generally found together in ores; 90% of PGM production comes from South Africa and Russia. In 2004, 44% of platinum was used in catalysts for motor vehicle emission control, and 33% in jewelry. The PGMs are classed with gold and silver as precious metals.
There are three main types of PGM deposit: PGM-dominant (e.g., the Bushveld Igneous Complex in South Africa), Ni–Cu dominant (e.g., Sudbury in Canada and Noril’sk in Russia), and miscellaneous. PGMs are usually recovered by flotation as a bulk low-grade sulfide concentrate, followed by smelting and refining.
There are over 100 known PGM-containing minerals, which include sulfides, tellurides, antimonides, arsenides, and alloys. Each of these has a unique metallurgical behavior, and the mode of occurrence and grain size varies considerably according to location (Corrans et al., 1982). The gangue minerals present specific challenges to flotation that affect downstream processing, notably talc (Shortridge et al., 2000) and chromite (Wesseldijk et al., 1999). Typical reagent suites include: thiol collectors (xanthate, sometimes with co-collectors dithiophosphate or dithiocarbamate); in some cases, copper sulfate as an activator; and polymeric depressants such as guar or carboxymethyl cellulose to inhibit recovery of naturally floatable talcaceous gangue (Wiese et al., 2005).
The wide range of valuable mineral densities in PGM ores presents problems in conventional classification in grinding circuits (see Chapter 9), so the South African flotation concentrators sometimes employ combined milling and flotation circuits without classification (Snodgrass et al., 1994). Flash flotation and preconcentration by DMS or gravity are also used.
12.17.6 Iron Ores
Iron ore minerals such as goethite (FeO(OH)) and hematite (Fe2O3) are floated by amine, oleate, sulfonate, or sulfate collectors. Processing involves preconcentration by gravity or magnetic separation, followed by flotation. Iron ore flotation has increased in importance due to market requirements for higher grade products. This requires the reverse flotation of silicate impurities. Amines are commercially used for the flotation of silica in many parts of the world (Das et al., 2005).
The requirement for higher grade product has seen an increase in the use of flotation columns in iron ore treatment. In Brazil, all new iron ore concentration circuits commissioned since the 1990s have consisted of rougher–cleaner–scavenger column-only configurations (Araujo et al., 2005b).
12.17.7 Niobium Ores
Niobec mine, located in the Saguenay region of Quebec, Canada, has been in operation since 1976 processing a niobium-bearing carbonatite ore. The minerals of economic interest are pyrochlore, (Na,Ca)Nb2O6F, and columbite, (Fe,Mn)(Nb,Ta)2O6. In 2012, the operation produced 4.7 million kg of niobium (Iamgold, 2014). The process is an example of non-sulfide flotation that can become quite complex. The plant employs desliming, carbonate reverse flotation, magnetic separation, pyrochlore flotation, and pyrite reverse flotation, followed by acid leaching to produce the niobium concentrate.
The Niobec mill flowsheet (ca. 1989) is shown in Figure 12.109 (Biss and Ayotte, 1989). Run-of mine ore is crushed in three stages to 100%−20 mm, which feeds an open-circuit rod mill followed by a closed-circuit ball mill (classification performed by a screen and screw classifier). The ball mill circuit product (95%−200 µm) is deslimed with the −10 µm material, which has a deleterious effect on flotation, being discarded.

The fine (10–40 µm) and coarse (40–200 µm) fractions are processed in separate carbonate flotation circuits. Flotation is at natural pH (ca. 8) using emulsified fatty acid collector and sodium silicate as pyrochlore depressant. Concentrates (i.e., carbonate concentrate) from both circuits are deslimed, with the fines being sent to the tailings pond and the coarse fraction recycled to the head of coarse carbonate flotation. The coarse fraction of the coarse carbonate concentrate moves on to magnetic separation. The desliming stage also replaces process water with potable water (Rao et al., 1988).
The magnetic separation stage employs two drum separators in series to remove magnetite. The magnetics stream, which contains ca. 68% Fe, 0.8% SiO2, and 0.08% Nb, is sent to the tailings pond with the nonmagnetic fraction continuing to pyrochlore flotation.
The pyrochlore flotation stage consists of a rougher and six cleaner stages and upgrades the feed from 1–1.2% Nb2O5 to 40–50% Nb2O5. Flotation is undertaken at gradually decreasing pH from 6.5 to 2.8 using hydrofluosilicic acid and carboxylic acid. The circuit utilizes secondary amine salts as collector, which in combination with the gradual pH decrease and the addition of modifiers (tapioca starch and sodium silicate) allows for a selective separation.
The pyrochlore cleaner concentrate comprises pyrochlores and pyrite (and small amounts of pyrrhotite) in roughly equal amounts, along with small concentrations of carbonates and apatite. A reverse flotation circuit using xanthate at ca. pH 10.5 produces a pyrite concentrate that is sent to the tailings pond and a pyrochlore tailings stream that undergoes hydrochloric acid leaching at ambient temperature to dissolve carbonates, apatite and some iron sulfide minerals. The leach residue undergoes a second pyrite flotation with the tailings stream being the final niobium concentrate, which is filtered and dried. Typical marketable concentrate quality requirements are: >55% Nb2O5, <4.0% SiO2, <0.23% P2O5, and <0.15% S.
12.17.8 Phosphate Ores
Phosphate ores are widely used in the production of fertilizer and phosphoric acid. In 2012, world phosphate production was estimated to be 181 Mt (USGS, 2012). Roughly 80% of world reserves are sedimentary phosphates, with the remainder being from igneous sources. The world’s largest reserves are found in the United States, Morocco, and China and are sedimentary deposits with major phosphate minerals francolite (carbonate rich apatite) and cellophane (Ca5(PO4,CO3)3F). Gangue minerals typically include clays, silica, calcite, and dolomite.
Figure 12.110 shows a simplified flowsheet for the IMC Four Corners operation in Florida, USA (Kawatra and Carlson, 2014). Feed from the washing plant is sized using screens and hydrocyclones into three size fractions which feed separate circuits:
| Size Fraction | Stream | Circuit |
| −16 +24 mesh | Spiral feed | Spiral and scavenger flotation |
| −24 +35 mesh | Coarse flotation feed | Crago process |
| −35 +150 mesh | Fine flotation feed | Crago process |

The coarse size fraction (0.7–1.2 mm), conditioned with a combination of fatty acid and fuel oil collectors, feeds a spiral film flotation circuit (Wiegel, 1999) (see Section 12.18.6). The spiral concentrate is of high-enough phosphate quality to report to final concentrate. The spiral tailings feed a scavenger flotation circuit that produces final phosphate concentrate and (mainly) silica tails, which are sent to the tailings pond.
The coarse and fine flotation feed streams report to separate rougher flotation stages. Both streams undergo the Crago double float process, which entails a first stage rougher phosphate flotation using fatty acid/fuel oil collectors at pH 9.0–9.5 (typically controlled using soda ash) and a second stage amine reverse silica flotation of the rougher concentrate. Prior to silica flotation, the slurry undergoes an acid scrub to remove adsorbed collector. (There is also a reverse Crago process where fine silica is first floated using amine collector, followed by phosphate flotation using fatty acid/fuel oil collector (Kawatra and Carlson, 2014).)
12.17.9 Coal
Unlike most metalliferous flotation, where all the feed is treated by flotation, in coal processing only a portion is treated. This is typically 10–25% of the feed tonnage and represents the fines fraction, usually below 250 µm, but sometimes up to 1 mm. Mining methods, in particular the increased use of longwall mining, have resulted in an increase in fines production and made the flotation of coal fines more important. In many countries, environmental legislation has limited the amount of coal fines that can be sent to tailings ponds, with flotation being the only effective recovery method.
Coal flotation circuits are relatively simple roughing and scavenging stages, with sometimes roughing alone being adequate. The mass recovery in coal flotation is high (up to 70%) and frother usage rates can be high as some is consumed (adsorbed) by the coal. Many flotation circuits use mechanical paddles to physically remove the heavy froth from the flotation cells. Petrochemical products are usually used as collectors, with the most common being diesel oil, liquid paraffin, and kerosene.
Coal operations can produce one of two products, depending on the quality of coal mined, either high value coking coal for pyrometallurgical industries or lower value thermal coal for power generation. Coking coal demands few impurities and the ash content (noncombustible content) is typically between 5% and 8%. Given the lack of cleaning stage and this demand for low impurity levels, coking coals often require froth washing and this has seen increasing use of Jameson cells and flotation columns. Flotation concentrates for thermal coals range from 8% to 14% ash content, which can often be achieved without froth washing and mechanical flotation cells are still common (Nicol, 2000).
12.17.10 Oil Sands—Bitumen
Oil sands (also referred to as tar sands or bituminous sands) are unconsolidated sand deposits that contain viscous petroleum, commonly termed bitumen (Masliyah et al., 2004; Rao and Liu, 2013). The two largest sources of bitumen are found in Canada and Venezuela. It is estimated in Alberta, Canada, that there are ca. 300 billion barrels of recoverable oil (using today’s technology).
Oil sands are composed of a mixture of bitumen and water-enveloped clays and silica (Takamura, 1982; Czarnecki et al., 2005). Pioneering work during the 1960s led to the development of the first commercially successful processing plant employing the Clark Hot Water Extraction (CHWE) process (Masliyah et al., 2004). Several water-based extraction processes now exist (Masliyah et al., 2004). The CHWE process uses hot water (50–80°C) and caustic soda (NaOH) to “liberate” the bitumen and this also releases natural surfactants which aid the flotation process (e.g., fine bubbles are “naturally” produced by the released surfactants so frothers are not required).
Over the years, oil sands processing has come to share many unit operations with mineral processing (Ritson and Ward, 2009; Nesset, 2011). Figure 12.111 shows a simplified flowsheet of the Muskeg river operation (Shell Canada). Crushers, tumblers, breakers, mixing boxes, and/or stirred tanks are used to break down the ore. Prior to the extraction plant the feed is conditioned in a hydrotransport pipeline into which warm water, reagents, and air are added. The conditioned slurry is fed to a large primary separation cell (PSC) (also referred to as PSV, primary separation vessel), unique to the oil sands industry, which acts as a gravity separator where bitumen buoyancy is augmented by attached air bubbles to rise and form froth. The PSC treats close to 10,000 t h−1. The PSC froth overflow is deaerated and feeds the froth treatment stage. Middlings from the PSC feeds a “primary” flotation stage comprising two parallel banks of four Dorr-Oliver Eimco 160 m3 cells. The froth product is recycled to the PSC. The tailings are combined with PSC underflow and screened with the coarse fraction sent to tailings. The fine fraction goes to a “secondary” flotation stage comprising three parallel banks of four Dorr-Oliver Eimco 160 m3 cells. The secondary froth product is recycled to the PSC and the secondary tailings are classified with the coarse fraction sent to final tailings and the fine fraction first thickened before disposal to final tailings. Overall bitumen recovery typically ranges from 88% to 95%, with the PSC froth product containing ca. 60% bitumen, 30% water, and 10% solids (Masliyah et al., 2004).
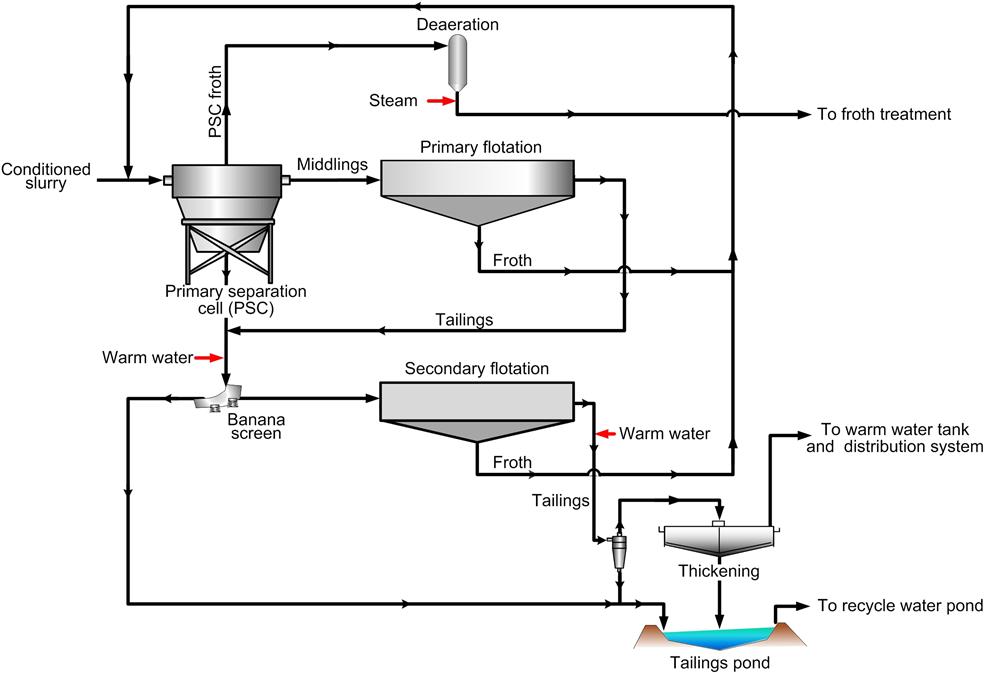
12.18 Other Surface Chemistry and Flotation-Based Separation Systems
12.18.1 Selective Flocculation
Recovery of fine particles in flotation is hampered by slow flotation kinetics. One option is selective flocculation; that is, to aggregate just the desired mineral particles (i.e., make them larger) and then separate (recover) the aggregates from the dispersed material. While attempts have been made to apply selective flocculation to a wide range of ore types, the bulk of the work has concerned the treatment of clays, iron, phosphate, and potash ores.
A prerequisite for the process is that the mineral mixture must be stably dispersed prior to introducing an aggregating reagent. Coagulating agents are a possibility, that is, manipulating surface charge to induce selective aggregation, but most work has been on using high molecular weight polymer flocculants which selectively adsorb on one of the constituents of the mixture (see Chapter 15 for further discussion on coagulation and flocculation). Selective flocculation is then followed by removal of the aggregates (flocs) from the dispersion by either flotation or sedimentation. The process of selective flocculation usually consists of four subprocesses: preparation of the material to be flocculated (particle dispersion, pH regulation, particle deactivation, etc.); selective adsorption of flocculant; floc formation and conditioning; and separation of flocs from nonflocculated material.
Selective flocculation has been successfully introduced in the treatment of fine-grained nonmagnetic oxidized taconites, which led to the development of Cleveland Cliffs Iron Company’s (now Cliffs Natural Resources) operation in the United States. The finely intergrown ore is autogenously ground to 85%−25 μm with caustic soda and sodium silicate, which act as dispersants for the fine silica. The ground pulp is then conditioned with a corn-starch flocculant which selectively flocculates the hematite. About one-third of the fine silica is removed in a deslime thickener, together with a loss of about 10% of the iron values. Most of the remaining coarse silica is removed from the flocculated underflow by reverse flotation, using an amine collector (Paananen and Turcotte, 1980; Siirak and Hancock, 1988).
In selective flotation of kaolin for removal of anatase impurity, one process includes dosing with sodium hexametaphosphate and sodium silicate to disperse the pulp and addition of high molecular weight (>106) PAM polymer to flocculate the anatase, which separates out in a thickener (Miller et al., 2002).
A related process is carrier flotation, where fine particles of the selected mineral attach to large particles of either the same or a different mineral added to the pulp, which are then removed with the attached fines. An application in kaolin processing was addition of ground limestone, conditioning with collector and flotation of the limestone with attached anatase. Rather than adding coarse particles followed by flotation, flocculation of fine magnetite selectively onto the target particle could render it (whether fine or coarse) recoverable by magnetic separation.
Selective flocculation remains a challenging technology, but an important one in seeking ways to treat the ever increasing volumes of fines as ore grades diminish and ore textural complexity increases. An attraction is the requirement of only small amounts of flocculant, usually several ppm. The most significant problem is the relatively low selectivity, with nontarget minerals entrapped in the flocs often requiring sequential dispersion and flocculation stages. Dewatering the flocs may also prove a challenge.
12.18.2 Oil-Assisted Separation Processes
The presence of a water-insoluble oil is used in several processes (Laskowski, 1992): to improve attachment of hydrophobic particles to bubbles (emulsion flotation), to increase size of fine particles to improve flotation rate (agglomerate flotation), or to allow separation by screening (oil agglomeration). In addition, there is also oily bubble flotation, where bubbles are precoated with oil to enhance attachment of particles (Su et al., 2006), and liquid–liquid extraction, where hydrophobic particles transfer to an oil phase (Lai and Fuerstenau, 1968). Outside of possible use in processing energy minerals coal and bitumen, the economics of employing oil (usually kerosene) seem questionable.
12.18.3 Gamma Flotation
In Section 12.3 the notion was introduced that high surface energy solids are wetted by water. This can be generalized to high surface energy solids are wetted by low surface energy liquids; and conversely, low surface energy solids are not wetted by high surface energy liquids (i.e., a contact angle forms). With water as the liquid, “high” and “low” energy refer to the surface energy (tension) of water, which for pure water at room temperature is about 72 mJ m−2. Thus we see that low surface energy solids can be floated in water; that is, they are naturally hydrophobic. If the surface energy of water (γl/a) is lowered, then there is a value when the solid is just wetted; this is the critical surface tension of wetting (γc) of the solid, a concept first introduced by Zisman (1964). Since minerals will have different γc, it follows for two solids A and B that if γcA < γl/a < γcB then solid A could be floated from solid B in water of surface energy γl/a. The technique has been demonstrated for separating naturally hydrophobic minerals (Kelebek and Smith, 1985) and plastics (Shent et al., 1999). Because it was surface tension being manipulated, the technique became known as “gamma (γ) flotation” (Buchan and Yarar, 1995).
Most of the literature focusses on measurement of γc. Surfactants can be used to control surface tension (Kelebek et al., 2001), but most work has used alcohol–water mixtures. The test procedure was either flotation in solutions of varying surface tension (Yarar and Kaoma, 1984), or film flotation, whereby particles placed on the surface of water would sink (be wetted) when the water surface tension was lowered below their γc (Fuerstenau and Williams, 1987).
While not a realistic practical option for mineral flotation, the concept has found application in characterizing naturally hydrophobic minerals by determining their γc. In the case of coals, which have variable composition, fractionating in solutions of controlled surface tension offers a way to describe the distribution in hydrophobicity (Hornsby and Leja, 1980).
While in principle the concept applies to high surface energy solids obviously the choice of liquid to determine their γc (let alone exploit for separation) is limiting. The addition of collector to high surface energy solids could be viewed as lowering the solid’s γc to less than γw/a, and making the solid floatable. The γc of some collector-coated minerals has been determined (Finch and Smith, 1975; Kelebek et al., 1986).
12.18.4 Colloidal Gas Aphrons
The flotation of fine particles is considered to require correspondingly fine bubbles. There appears to be a limit to the fineness of bubbles that can be produced in conventional flotation systems, of the order of 500 μm (Section 12.5.1). Stable (i.e., noncoalescing) bubbles less than 100 μm can be created in the presence of surfactant when stirred at a very high speed, typically 8,000 rpm (Jauregi et al., 2000). Referred to as “colloidal gas aphrons” (CGAs), they can be defined as surfactant-stabilized micro-bubbles. Of interest in several fields because of the high surface area, in mineral recovery they remain a research idea (Waters et al., 2008).
12.18.5 Electroflotation
In this process, direct current is passed through the pulp within the cell, generating a stream of hydrogen and oxygen bubbles at the two electrodes. Considerable work has been done on factors affecting the bubble size on detachment from the electrodes, such as electrode potential, pH, surface tension, and contact angle of the bubble on the electrode. On detachment, the majority of bubbles are in the 10–60 µm range, and bubble concentration (gas holdup) can be controlled by current density. Electroflotation has been used for some time in waste-treatment applications to float solids from suspensions (Chen and Chen, 2010); it may have a future role in the treatment of fine mineral particles.
Some other factors have also been noted in addition to the fine bubbles. For example, the flotation of cassiterite is improved when electrolytic hydrogen is used for flotation. This may be due to nascent hydrogen reducing the surface of the cassiterite to tin (metal elements tend to be hydrophobic), allowing the bubbles to attach.
12.18.6 Agglomeration–Skin Flotation
In agglomeration flotation, the hydrophobic mineral particles are loosely bonded with small air bubbles to form agglomerates. When the agglomerates reach a free water surface, they are replaced by skin-flotation of individual particles. In skin (or film) flotation, surface tension forces result in holding the hydrophobic particles at the water surface, while the hydrophilic particles sink. The reagentized feed is fed to gravity concentration devices such as tables and spirals and the particles are floated off. It is used in treating coarse phosphate in some operations (Section 12.17.8) (Moudgil and Barnett, 1979).
12.18.7 Dissolved Air Flotation
In this process, air is dissolved in water and released as fine bubbles (<100 μm) by a sudden drop in pressure. Two versions are employed: vacuum flotation, where air is dissolved in water at atmospheric pressure and released under vacuum; and the more common pressure flotation, where air is dissolved under pressure and released at atmospheric pressure. The technology is used in treating municipal waste and industrial waste including oil removal (deoiling) from refinery effluent where natural gas can be substituted (and is preferred) for air. The flotation appears to be due to the fine bubbles nucleating on and clustering the hydrophobic matter (i.e., forming aggregates of matter and bubbles). Sometimes considered for fine mineral flotation, there are two disadvantages: one is the limited amount of air that can be introduced (not an issue with the low solid content municipal effluents); and two, the fine bubbles are too small to levitate the particles on their own (unless clustering can be induced). The CavTube™ used to disperse air in flotation columns (Section 12.13.2) exploits pressure release to produce fine bubbles, the aim being to nucleate the fine bubbles on the mineral surface to improve subsequent attachment of flotation-size bubbles.
12.18.8 Adsorptive Bubble Separation Processes
These processes take advantage of the attachment to bubbles of naturally or induced hydrophobic material other than minerals. Foam fractionation is the flotation of naturally hydrophobic material, ranging from bacteria to surfactants. Ion flotation is the removal of metal ions through addition of surfactants with appropriate functional groups to form a hydrophobic precipitate. Direct flotation of ions may be effected by first coating bubbles with extractant, such as in the air-assisted solvent extraction process (Tarkan et al., 2012). Precipitate flotation includes precipitates in general, both naturally hydrophobic and those induced through addition of surfactants. The processes employ both dispersed air and dissolved air machines. Adsorptive bubble and related processes are reviewed by Wang et al. (2007).