
CHAPTER 11
Managing Project Risks
In this chapter, you will
• Plan for risk management
• Identify project risks
• Complete qualitative risk analysis
• Complete quantitative risk analysis
• Plan the risk responses
• Monitor and control project risks
A project risk is an uncertain event or condition that can have a positive or negative impact on the project. That’s correct—it’s possible for a risk to have a positive impact. Risks that have a positive impact are also known as opportunities. Technically, risk isn’t a bad thing. It’s the impact that can be painful, costly, or delay the project work. Most project managers look at risk the same way they’d look at leftover shrimp cocktail. Yuck. Some risks, though, are good for the project, and the project manager wants to accept them; other risks aren’t so welcome.
Let’s look at this from another point of view. Imagine a golfer teeing up. To the right of the tee box, there’s a water hazard, but just beyond the water is the green. The golfer can either avoid the water and take longer to get to the green, or try to shoot over the water and get on the green in fewer strokes. Driving up the fairway is the safer play, but cutting over the water will improve the golfer’s score. The risk with the water hazard is that if he can’t make the shot, then he’s down a penalty stroke.
 VIDEO For a more detailed explanation, watch the Creating a Risk Matrix video now.
Risk, as in the golfing scenario, must be in proportion to the reward the risk taker can realize as a result of taking the chance. The willingness to accept the risk is called the utility function. Some call the utility function your risk tolerance—the amount of risk you’ll take on in relation to the impact the risk event may bring. Your risk appetite (think yummy!) is how much risk you’ll accept in relation to the reward the risk may bring. An experienced golfer may have a high risk appetite, so he’s willing to accept the water hazard. A golf hack like me would likely have a low risk tolerance and drive up the fairway away from the water. Someone with a high tolerance for risk is called a risk seeker, while someone with a low tolerance for risk is called risk-averse.
It’s true in project management, too. With some projects, you and your organization are willing to accept risks to realize rewards such as cost savings, time savings, or on-the-job training. On other projects—typically, those projects with high-impact and high-profile characteristics—you’re not so willing to accept the risks. In this chapter, we’ll look at the six processes that dictate project risk management, and you’ll have plenty of risk management questions on your Project Management Institute (PMI) exam.
Let me be very clear: The risks you can readily identify are the known risks. The risks that are more ambiguous, like the weather or vendor delays, are called known unknowns. You can anticipate and plan for the known unknowns, but the planning is about the probability of the event and the impact the risk might have on the project objectives. Project risk describes the likelihood of the overall project being successful for the organization. Individual project risks are the risks within the project. When a risk event actually happens, it can shift from being just a risk to being an issue in the project.
The project management processes described here are presented in the most logical order. They are actually iterative processes throughout the project life cycle. Pay special attention to monitoring and controlling project risks because new risks can creep into the project or be discovered as the project moves toward closure.
Planning for Risk Management
Risk management planning is not the identification of risks or even the response to known risks within a project. Risk management planning is how the project management team will complete the risk management activities within the project. These activities really set up the project to effectively manage the five other risk management activities. Risk management planning creates the risk management plan.
By deciding the approach to each of the risk management activities before moving into them, the project management team can more effectively identify risks, complete risk analysis, and then plan risk responses. In addition, planning for risk management also allows the project management team to create a strategy for the ongoing identification and monitoring of existing risks within the project.
Preparing for Risk Management Planning
There are five inputs to risk management planning, although some are more important than others. It’s essential for the project management team to understand the priority of the project, which shouldn’t be too tough to do. Important projects, high-profile projects, or projects with hefty budgets are generally risk-averse. Smaller projects are generally more willing to accept risks. You’ll need the following to prepare for risk management:
• Project management plan Risk management planning considers all of the project’s subsidiary plans, baselines, project documentation, and supporting detail. The project manager will pay special attention to the project scope, project communications, cost, and schedule because these knowledge areas can be most widely affected by risk.
• Project charter The project charter is needed because it defines the high-level objectives for the project and also identifies the initial known risks.
• Stakeholder register The stakeholder register is referenced for stakeholder concerns, threats, perceived threats, contact information, and roles involved in the project.
• Enterprise environmental factors An organization’s attitude toward risk may vary (as I mentioned) based on the type, size, and profile of the project.
• Organizational process assets An organization may have a predefined approach to risk management. If that’s the case, the project management team uses the organization’s approach and follows its established procedures. For example, an organization could define risk tolerance levels, risk categories, templates, roles and responsibilities, and more. A project team may also use other similar projects to guide the current risk management planning activities.
Completing Risk Management Planning
Planning for risk happens in—surprise, surprise!—planning meetings, where the project team develops the risk management plan and analyzes the inputs previously mentioned to make the best decisions for the current project. While the project team is the primary participant at the risk management planning meeting, the attendees may actually include the project manager, stakeholders, and other subject matter experts within an organization who influence the risk management processes.
The purpose of these risk management planning meetings is to create the risk management plan and to define the cost and schedule for risk management activities. Let’s face facts: It’ll take time and monies for most projects to identify, test, and challenge the risks that may exist within the project. These initial meetings allow monies and time to be incorporated within the project. Risk responsibilities are also assigned in these meetings, as are the risk terminologies the project will use. Risk management planning also defines and tailors the following for the project:
• Risk templates the project should use
• Definitions and terms for risk levels
• Probability according to risk type
• Impact of the risks
• Guidelines for the probability and impact matrix to be used during risk analysis
Creating the Risk Management Plan
The whole point of risk management meetings and analysis is to create the risk management plan. This plan does not detail the planned responses to individual risks within the project—this is the purpose of the risk response plan. The risk management plan is responsible for determining how:
• The project will utilize the selected risk management methodology
• Risks will be identified
• Quantitative analysis will be completed
• Qualitative analysis will be completed
• Risk response planning will happen
• Risks will be monitored and tracked
• Ongoing risk management activities will happen throughout the project’s life cycle
Defining the Risk Management Methodology
The methodology is concerned with how the risk management processes will take place. It asks the following:
• What tools are available to use for risk management?
• What approaches are acceptable within the performing organization?
• What data sources can be accessed and used for risk management?
• What approach is best for the project type and the phase of the project?
• Which approach is most appropriate given the conditions of the project?
• How much flexibility is available for the project given the conditions, time frame, and the project budget?
Identifying Risk Roles and Responsibilities
The roles and responsibilities identify the groups and individuals who will participate in the leadership and support of each of the risk management activities within the project plan. In some instances, risk management teams outside of the project team may have a more realistic, unbiased approach to the risk identification, impact, and overall risk management needs than the actual project team does.
Creating a Risk Management Budget
Based on the size, impact, and priority of the project, a budget may need to be established for the project’s risk management activities. This section of the risk management plan defines a cost estimate for the resources needed to complete risk management. These costs are rolled into the project’s cost baseline. A project with high priority and no budget allotment for risk management activities may face uncertain times ahead.
Identifying the Risk Management Schedule
The risk management process needs a schedule to determine how often, and when, risk management activities should happen throughout the project. If risk management happens too late in the project, the project could be delayed because of the time needed to identify, assess, and respond to the risks. A realistic schedule should be developed early in the project to accommodate risks, risk analysis, and risk reaction.
Defining a Project’s Risk Categories
Based on the nature of the work, there should be identified categories of risks within the project. Figure 11-1 depicts one approach to identifying risk categories by using a risk breakdown structure (RBS). Throughout the project, the risk categories should be revisited to update and reflect the current status of the project. If a similar risk management plan is available from a previous project, the project team may elect to use this plan as a template and tailor the risk categories accordingly. There are four general categories of risks:
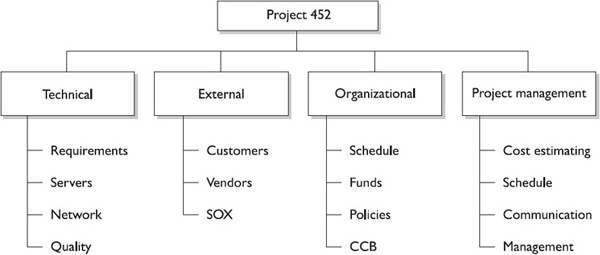
• Technical, quality, or performance risks Technical risks are associated with new, unproven, or complex technologies being used on the project. Changes to the technology during the project implementation can also be a risk. Quality risks are the levels set for expectations of impractical quality and performance. Changes to industry standards during the project can also be lumped into this category of risks.
• Project management risks These risks deal with faults in the management of the project: the unsuccessful allocation of time, resources, and scheduling; unacceptable work results (low-quality work); and poor project management as a whole.
• Organizational risks The performing organization can contribute to the project’s risks through unreasonable cost, time, and scope expectations; poor project prioritization; inadequate funding or the disruption of funding; and competition with other projects for internal resources.
• External risks These risks are outside of the project, but directly affect it— for example, legal issues, labor issues, a shift in project priorities, or weather. “Force majeure” risks can be scary, and usually call for disaster recovery rather than project management. These are risks caused by earthquakes, tornadoes, floods, civil unrest, and other disasters.
The discipline that you work in may allow you to identify and categorize risk beyond these generic categories I’ve listed here. The idea is to create risk themes so you can group associated risks by topic. This allows you to identify trends in the risk and look for root causes to attack many risks at once. An RBS is an ideal way to visualize where project risks are lurking in each phase or within the project as a whole.
Identifying the Project Risks
Risk identification is the systematic process of combing through the project, the project plan, the work breakdown structure (WBS), and all supporting documentation to identify as many of the risks that may affect the project as possible. Remember, a risk is an uncertain event or condition that may affect the project outcome. Risks can be positive or negative. In the big picture of risk identification, there are two categories of risks:
• Pure risks These risks have only a negative outcome. Examples include loss of life or limb, fire, theft, natural disasters, and the like. These risks are often referred to as insurable risks.
• Business risks These risks may have a negative or a positive outcome. Examples include using a less experienced worker to complete a task, allowing phases or activities to overlap, or forgoing the expense of formal training for on-the-job education. These risks are also known as speculative risks.
The initial risk identification meeting can be wild and unwieldy if the approach isn’t structured. The project manager may elect to address risks by category, project phase, or the project life cycle. The goal of these meetings is to capture all of the risks so that the project management team can plan adequately for the risk responses. The participants of the risk identification meetings can include:
• The project manager
• The project team
• The risk management team (if one exists, of course)
• Subject matter experts
• Customers
• End users
• Other project managers
• Risk management experts
Risk identification is not a one-time event. The project manager should encourage the project team and these participants to continually be on the lookout for risk events as the project moves toward closure. The risk management plan also includes timings for iterations of risk identification and management. Risk identification is an iterative process, because new risks can creep into the project, or existing risks may be identified later as more detail becomes available. You’ll need several inputs to complete risk identification:
• Risk management plan This lone output of risk management planning is needed during risk identification because the plan will identify the organization’s and the project’s proper approach for identifying risks within the project.
• Cost management plan You’ll likely need funds for risk identification and for risk responses. Your cost management plan should address the organization’s approach to requesting funds for contingency reserves and risk responses.
• Schedule management plan How the project is structured can actually create risks or avoid risks. Generally, the faster the pace of the project, the more risks the project will experience.
• Quality management plan The quality management plan and the organization’s approach to quality management may create risks or, more likely, help the project avoid risks.
• Human resource plan This plan helps the project manager anticipate how the project will be staffed and the roles that can contribute to risk identification and management. The staffing management plan can also help the project manager anticipate any risks associated with the resources leaving the project team.
• Project scope baseline The project scope statement includes the assumptions that the project is based on. These assumptions are often sources of risk within the project. You’ll use the work breakdown structure (WBS) and the WBS dictionary to examine the work packages and deliverables for risk events.
• Activity cost estimates The project’s activity cost estimates are needed to determine the likelihood of achieving the cost estimates based on the identified risks in the project. If risks come into fruition in the project, the cost of the activities will increase. An examination of the cost of the estimates, the cost of the risks, and the cost of risk responses is often needed as part of risk management planning and risk identification.
• Activity duration estimates Just as risks can affect the cost of the activities, so too can risks affect the duration of an activity. In addition, you may need to adjust activity duration to slow the work down to avoid risks, add labor, or consider risk responses and how these may affect the duration of activities.
• Stakeholder register Customers and other stakeholders need to participate in the risk identification process. You’ll need their expert judgment, experience, and knowledge to help identify risks in the project.
• Project documents The project manager will need several project documents to identify project risks. Consider the following:
• An assumptions log
• Work performance reports
• Project network diagrams
• Earned value findings
• Time, cost, and scope baselines
• Procurement documents There is always risk associated with hiring a third party to complete a portion of the project work. An analysis of the agreements is needed to identify the risks associated with the vendor completion of the project work, the reliability of the vendor, and the ramifications of vendor-based work on the project schedule, costs, quality, and scope.
• Enterprise environmental factors When it comes to risk identification, having commercial databases, academic studies, benchmarking results, white papers, and other statistics and information related to your discipline is ideal.
• Organizational process assets If an organization has completed projects similar to the current project, using the historical information can help with the risk identification.
Finding Project Risks
Now the fun part of risk identification: Anything goes as long as it can be perceived as a risk. All of the risk identification participants should identify as many risks as possible, regardless of their perceived initial threat. I’m not really talking about sunspots and asteroid crashes here, but relevant risks should be recorded, regardless of their size and impact on the project. What begins as a small risk can bloom into something much larger as the project progresses.
Reviewing the Project Documentation
One of the first steps the risk identification participants can take is to review the project documentation. The project plan, scope, and other project files should be reviewed. Constraints and assumptions should be reviewed, considered, and analyzed for risks. This structure review takes a broad look at the project plan, the scope, and the activities defined within the project.
Relying on Risk Identification Methods
There are five methods you can use when it comes to gathering project information regarding risks. You’ll likely see these on your exam:
• Brainstorming Good, old-fashioned brainstorming is the most common approach to risk identification. It’s usually completed by a project team with subject matter experts to identify the risks within the project. The risks are identified in broad terms and posted, and then the risks’ characteristics are detailed. Your pal, the risk breakdown structure (RBS), can help facilitate the brainstorming process. The identified risks are categorized and will pass through the qualitative and quantitative risk analyses later. I’ll discuss those in just a few pages—no peeking!
• The Delphi Technique The Delphi Technique, shown in Figure 11-2, is an anonymous method used to query experts about foreseeable risks within a project, phase, or component of a project. The results of the survey are analyzed by a third party, organized, and then circulated to the experts. There can be several rounds of anonymous discussion with the Delphi Technique without fear of backlash or offending other participants in the process. The Delphi Technique is completely anonymous, and the goal is to gain consensus on project risks within the project. The anonymous nature of the process ensures that no single expert’s advice overtly influences the opinion of another participant.

I’m often asked why this approach is called the Delphi Technique. It was developed during the Cold War as a forecasting and consensus-building device, and was named after the “Oracle at Delphi.” Delphi is a Greek archeological site that, according to legend, is the center of the universe. However, as fascinating as Greek mythology is, there won’t be any legends on your PMI examination. Sorry.
• Hosting interview sessions Interviewing subject matter experts and project stakeholders is an excellent approach to identifying risks on the current project based on the interviewees’ experiences. The people responsible for risk identification share the overall purpose of the project, the project’s work breakdown structure (WBS), and, likely, the same assumptions as the interviewee. The interviewee, through questions and discussion, shares his insight on what risks he perceives within the project. The goal of the process is to learn from the expert what risks may be hidden within the project, what risks this person has encountered in similar work, and what insight the person has into the project work.
• Root cause identification Project managers and the project team often see the impact of a risk, but not always its cause. Root cause identification aims to find out why a risk event may be occurring, the causal factors creating the risk events, and then, eventually, how the events can be mitigated or eliminated.
• Implementing SWOT analysis SWOT stands for strengths, weaknesses, opportunities, and threats. SWOT analysis is the process of examining the project from the perspective of each characteristic. For example, a technology project may identify SWOT as:
• Strengths The technology to be installed in the project has been installed by other large companies in our industry.
• Weaknesses We have never installed this technology before.
• Opportunities The new technology will allow us to reduce our cycle time for time-to-market on new products. Opportunities are things, conditions, or events that allow an organization to differentiate itself from competitors and improve its standing in the marketplace.
• Threats The time to complete the training and simulation may overlap with product updates, new versions, and external changes to our technology portfolio.
![]() EXAM COACH You can use SWOT as you prepare to pass your PMI exam. Look at your scores for the end-of-chapter exams. Which chapters are you strong or weak in? Which chapters are threatening your exam? And which exam objectives can you ace on the actual test? Continue to work smart— your goal is to pass the exam.
EXAM COACH You can use SWOT as you prepare to pass your PMI exam. Look at your scores for the end-of-chapter exams. Which chapters are you strong or weak in? Which chapters are threatening your exam? And which exam objectives can you ace on the actual test? Continue to work smart— your goal is to pass the exam.
Using Checklists
Checklists are a quick approach to risk identification. The lowest of the risk breakdown structures (RBS) might serve as a checklist, for example. More likely, similar projects that have been completed in the past have risk registers that the current risk identification process can benefit from. While checklists can be created quickly and easily, it’s impossible to build an exhaustive risk checklist.
 EXAM TIP The danger in using or relying on risk identification checklists is that the risk identification participants don’t consider risks that aren’t on the checklists. Even for projects that have been completed over and over, based on the nature of the work, the project team must actively seek to identify risks that are outside of the organizational process assets checklists.
Examining the Assumptions
All projects have assumptions. Assumption analysis is the process of examining the assumptions to see what risks may stem from false assumptions. Examining assumptions is about gauging the validity of the assumptions. For example, consider a project to install a new piece of software on every computer within an organization. The project team has made the assumption that all of the computers within the organization meet the minimum requirements to install the software. If this assumption were wrong, cost increases and schedule delays would occur.
Examining the assumptions also requires a review of assumptions across the whole project for consistency. For example, consider a project with an assumption that a senior employee will be needed throughout the entire project work; the cost estimate, however, has been billed at the rate of a junior employee.
Utilizing Diagramming Techniques
Several diagramming techniques can be utilized by the project team to identify risks:
• Ishikawa These cause-and-effect diagrams are also called fishbone diagrams, as seen in Figure 11-3. They are great for analyzing the root causes of risk factors within the project. The goal is to identify and treat the root of the problem, not the symptom.

• Flowchart System or process flowcharts show the relationships between components and how the overall process works. These are useful for identifying risks between system components.
• Influence An influence diagram charts out a decision problem. It identifies all of the elements, variables, decisions, and objectives, and also how each factor may influence another.
Creating a Risk Register
The only output of risk identification is the project’s risk register. The risk register is a component of the project management plan that contains all of the information related to the risk management activities. It’s updated as risk management activities are conducted to reflect the status, progress, and nature of the project risks. The risk register includes the following:
• Risks Of course, the most obvious output of risk identification is the risk that has been successfully identified. Recall that a risk is an uncertain event or condition that could potentially have a positive or negative effect on project success.
• Potential responses The initial risk identification process may yield solutions and responses to identified risks. This is fine, as long as the responses are documented here. Along with the risk responses, the identification of risk triggers may also occur. Triggers are warning signs or symptoms that a risk has occurred or is about to occur. For example, should a vendor fail to complete her portion of the project as scheduled, the project completion may be delayed.
• The root causes of risk Risk identification can identify why risk conditions exist. Project managers can also use if-then statements based on the cause of the risk event to predict the effect of the risk event.
• Updated risk categories Risk identification may prompt the project team to identify new categories of risks. These new categories should be documented in the risk register, and if a risk breakdown structure (RBS) is utilized, it will need to be updated as well.
Using Qualitative Risk Analysis
The first, and somewhat shallow, risk analysis is qualitative analysis. Qualitative risk analysis “qualifies” the risks that have been identified in the project. Specifically, qualitative risk analysis examines and prioritizes the risks based on their probability of occurring and the impact on the project if the risks do occur. Qualitative risk analysis is a broad approach to ranking risks by priority, which then guides the risk reaction process. The end result of qualitative risk analysis (once risks have been identified and prioritized) can either lead to more in-depth quantitative risk analysis or move directly into risk response planning.
The status of the project will also affect the process of qualitative risk analysis. Early in the project, there may be several risks that have not yet surfaced. Later in the project, new risks may become evident and need to pass through qualitative analysis. The status of the project is linked to the available time needed to analyze and study the risks. There may be more time early in the project, while a looming deadline near the project’s end may create a sense of urgency to find a solution for the newly identified risks.
EXAM TIP When you think of “qualitative,” think of qualifying. You are qualifying, or justifying, the seriousness of the risk for further analysis. Some Certified Associate in Project Management (CAPM) and Project Management Professional (PMP) candidates like to remember that qualitative is a list. The “L” in qualitative and list ties the two together.
Preparing for Qualitative Analysis
As with most of the project planning processes, the project management team is included in the rapid analysis of the project risks. There are five inputs to qualitative analysis:
• Risk management plan The risk management plan is the key input to qualitative risk analysis. The plan will dictate the process, the methodologies to be used, and the scoring model for identified risks. In addition to the risk management plan, the identified risks from the risk register will obviously be needed to perform an analysis. These are the risks that will be scored and ranked based on their probability and impact.
• Project scope baseline Consider an organization that does the same type of projects over and over, such as installing networks or constructing bridges. These repetitive projects have known risks and known risk responses. An organization that is attempting project work that it has never done before has more unknowns, which can represent risks in a project. The project scope baseline can help identify a project’s uniqueness. The project scope statement’s assumptions and constraints can also be examined for risks.
• Risk register This project-centric database of identified risks and their status is referenced to qualify risks.
• Enterprise environmental factors Risk databases, industry studies, internal risk management policies, and program governance can all be considered as part of the risk analysis.
• Organizational process assets Past projects and lessons learned—the organization’s historical information—are ideal resources for the qualitative risk analysis process. No need to reinvent the wheel.
EXAM TIP You’ll always update the risk register when any new information about a risk is discovered.
Completing Qualitative Analysis
During the risk identification process, all possible risks are identified. Of course, not all risks are worth responding to, while others demand attention. Qualitative analysis is a subjective approach to organizing and prioritizing risks. Through a methodical and logical approach, the identified risks are rated according to probability and potential impact.
The outcome of the ranking determines four things:
• It identifies the risks that require additional analysis through quantitative risk analysis.
• It identifies the risks that may proceed directly to risk response planning.
• It identifies risks that are not critical, project-stopping risks, but that still must be documented.
• It prioritizes risks.
Applying Probability and Impact
The project risks are rated according to their probability and impact. Risk probability is the likelihood that a risk event may happen, while risk impact is the consequence that the result of the event will have on the project objectives. Two approaches exist to ranking risks:
• Cardinal scales identify the probability and impact on a numerical value, from .01 (very low) to 1.0 (certain).
• Ordinal scales identify and rank the risks from very high to very unlikely.
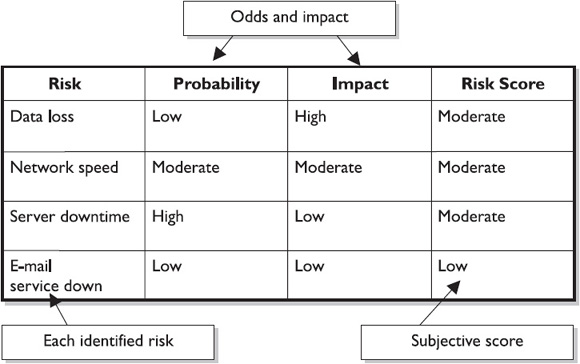
Creating a Probability-Impact Matrix
Each identified risk is fed into a probability-impact matrix, as seen in Figure 11-4. The matrix maps out the risk, its probability, and its possible impact. The risks with higher probability and impact are a more serious threat to the project objectives than risks with lower impact and consequences. The risks that are threats to the project require quantitative analysis to determine the root causes, the methods to control the risks, and effective risk management. We’ll discuss quantitative risk management later in this chapter.
The project is best served when the probability scale and the impact scale are predefined prior to qualitative analysis. For example, the probability scale rates the likelihood of an individual risk happening and can be on a linear scale (.1, .3, .5, .7, .9), or on an ordinal scale. The scale, however, should be defined and agreed upon in the risk management plan. The impact scale, which measures the severity of the risk on the project’s objectives, can also be ordinal or cardinal.
By identifying and assigning the scales to use prior to the process of qualitative analysis, all risks can be ranked by the system, including future identified risks. A shift in risk-rating methodologies midproject can cause disagreements with regard to how the project risks should be handled.
A probability-impact matrix multiplies the value for the risk probability by the risk impact, giving a total risk score, as seen in Figure 11-5. The risk’s scores can be cardinal, and then preset values can qualify the risk for a risk response. For example, an identified risk in a project is the possibility that the vendor may be late in delivering the hardware. The probability is rated at .9, but the impact of the risk on the project is rated at .1. The risk score is calculated by multiplying the probability times the impact—in this case, resulting in a score of .09.

The scores within the probability-impact matrix can be referenced against the performing organization’s policies for risk reaction. Based on the risk score, the performing organization can place the risk in differing categories to guide risk reaction. There are three common categories, based on an RAG (Red, Amber, Green) rating risk score:
• Red condition High risk. These risk scores are high in impact and probability.
• Amber condition (also called yellow condition) These risks are somewhat high in impact and probability.
• Green condition Risks with a green label are generally fairly low in impact, probability, or both.
Relying on Data Precision
Here’s the truth about qualitative risk analysis: It’s easy, fast, cheap, and not very reliable. One of the toughest parts of qualitative risk analysis is the biased, subjective nature of the process. A project manager and the project team must question the reliability and reality of the data that leads to the ranking of the risks. For example, Susan may have great confidence in herself when it comes to working with new, unproven technologies. Based on this opinion, she determines the probability of the work to be a very low score. However, because she has no experience with the technology due to its newness, the probability of the risk of failure is actually very high. The biased opinion that Susan can complete the work with zero defects and problems is slightly skewed because she has never worked with the technology before. Obviously, a low-ranked score on a risk that should be ranked high can have detrimental effects on the project’s success.
Data precision ranking takes into consideration the biased nature of the ranking, the accuracy of the data submitted, and the reliability of the nature submitted to examine the risk scores. Data precision ranking is concerned with the following:
• The level of understanding of the project risk
• The available data and information about the identified risk
• The quality of the data and information about the identified risk
• The reliability of the data about the identified risk
Assessing the Risk Score
Once the qualitative risk assessment has been completed, you can step back, heave a sigh of relief, and then acknowledge that this process will need to be repeated throughout the project as new risks come into play. Risk assessment is an ongoing, iterative process that lasts throughout the project. Want some more sad news? The risk ratings in the qualitative risk matrix can change based on conditions in the project or as more information about the risks becomes available.
One nice thing about the qualitative risk analysis process is the ability to categorize risks. Remember the RBS? The qualitative risk analysis process may give you an opportunity to create new risk categories that you’ve identified or to reorganize the RBS. The goal of updating the RBS is to group risks by common categories to create better risk responses later on in the risk management processes.
Finally, assessing the risk score gives the project manager an opportunity to address near-term risks. Imminent risks are usually considered of higher urgency than future risks. Consider the risk ranking, the time needed for the risk response, and the conditions that indicate the risk is coming to fruition.
Updating the Risk Register
At the beginning of the qualitative risk analysis process, the risk register was fairly simple. The list of identified risks, some potential responses, and supporting detail for the risks are all that you’d likely find in that database. Now that more information has become available, the project manager and the project team can update the risk register accordingly.
As qualitative risk analysis happens throughout the project, new risks will be identified. The project manager should route the risks through the qualitative risk analysis process. The end results of qualitative risk analysis are all updated in the risk register:
• Overall risk ranking of the project This allows the project manager, management, customers, and other interested stakeholders to comprehend the risk, the nature of the risks, and the condition between the risk score and the likelihood of success for a project. The risk score can be compared with other projects to determine project selection, the placement of talent in a project, prioritization, the creation of a benefit/cost ratio, or even the cancellation of a project because it is deemed too risky.
• Risk categories Within the risk register, categories of risks should be created. The idea is that not only will related risks be lumped together, but also there may be some trend identification and root cause analysis of identified risks. As risks are categorized, it should be easier to create risk responses as well.
• Near-term risks Qualitative analysis should also help the project team identify which risks require immediate or near-term risk responses. However, risks that are likely to happen later in the project can be acknowledged, allowing imminent risks to be managed first.
• Risks requiring additional analysis The risks categorized as high will likely need additional analysis, such as quantitative analysis. Some risks may demand immediate risk management based on the nature of the risks and the status of the project.
• Low-priority risk watch list Let’s face it: Not all risks need additional analysis. However, these low-priority risks should be identified and assigned to a watch list for periodic monitoring.
• Trends in qualitative analysis As the project progresses and risk analysis is repeated, trends in the ranking and analysis of the risks may become apparent. These trends can allow the project manager and other risk experts to respond to the root cause and predicted trends to either eliminate or respond to the risks within the project.
Preparing for Quantitative Risk Analysis
Quantitative risk analysis attempts to numerically assess the probability and impact of the identified risks. It also creates an overall risk score for the project. This method is more in-depth than qualitative risk analysis and relies on several different tools to accomplish its goal.
Qualitative risk analysis typically precedes quantitative risk analysis. I like to say that qualitative analysis qualifies risks, while quantitative analysis quantifies risks. All or a portion of the identified risks in qualitative risk analysis can be examined in the quantitative analysis. The performing organization may have policies on the risk scores in qualitative analysis that require the risks to advance to the quantitative analysis. The availability of time and budget may also be a factor in determining which risks should pass through quantitative analysis. Quantitative analysis is a more time-consuming process, and is, therefore, also more expensive. The goals of quantitative risk analysis are to:
• Quantify the cost and impact of the risk exposure
• Ascertain the likelihood of reaching project success
• Ascertain the likelihood of reaching a particular project objective
• Determine the risk exposure for the project
• Determine the likely amount of the contingency reserve needed for the project
• Determine the risks with the largest impact on the project
• Determine realistic time, cost, and scope targets
Interviewing Stakeholders and Experts
Interviews with stakeholders and subject matter experts can be one of the first tools to quantify the identified risks. These interviews can focus on worst-case, best-case, and most-likely scenarios if the goal of the quantitative analysis is to create a triangular distribution. Most quantitative analysis, however, uses continuous probability distributions. Figure 11-6 shows five sample distributions: normal, lognormal, beta, triangular, and uniform.

Continuous probability distribution examines the probability of all possibilities within a given range. For each variable, the probability of a risk event and the corresponding consequence of the event may vary. In other words, dependent on whether the risk event occurs and how it happens, a reaction to the event may also occur. The distribution of the probabilities and impact includes:
• Normal
• Lognormal
• Beta
• Triangular
• Uniform
EXAM TIP It’s doubtful you’ll be tested on these risk distributions for the exam. The PMBOK mentions them only briefly, so you just need to be topically aware of them. Don’t invest hours memorizing the subject.
Applying Sensitivity Analysis
Sensitivity analysis examines each risk to determine which one has the largest impact on the project’s success. All other risks in the project are set at a baseline value and then compared against all of the other risks individually. The individual risk is then examined to see how it may affect the success of the project. The goal of sensitivity analysis is to determine which individual risks have the greatest impact on the project’s success and then to escalate the risk management processes based on these risk events.
The tornado diagram is best used when completing sensitivity analysis. The tornado diagram maps out all the variables in a situation from largest to smallest impact on the project or situation. If you’ve ever seen a tornado, you know it’s really big on top and small at the bottom—that’s what the tornado diagram looks like, too. The closer the bar is to the top of the diagram, the more impact it has on the situation, project, or investment. The closer the bar is to the bottom of the chart, the less impact it has on the situation. Tornado diagrams are also sometimes called tornado plots or tornado charts.
Finding the Expected Monetary Value
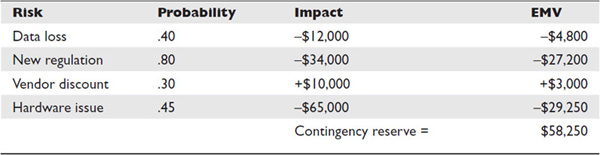
The expected monetary value (EMV) of a project or event is based on the probability of outcomes that are uncertain. For example, one risk may cost the project an additional $10,000 if it occurs, but there’s only a 20 percent chance of the event occurring. In its simplest form, the expected monetary value of this individual risk impact is, thus, $2,000. Project managers can also find the expected monetary value of a decision by creating a decision tree.
Table 11-1 is an example of a simple risk matrix that determines the expected monetary value for some sample risks. Note that the sum of the EMV reveals what the contingency reserve for these risks should be.
Using a Decision Tree
A decision tree is a method used to determine which of two or more decisions is the best one. For example, it can be used to determine buy-versus-build scenarios, lease-or-purchase equations, or whether to use in-house resources rather than outsourcing project work. The decision tree model examines the cost and benefits of each decision’s outcome and weighs the probability of success for each of the decisions.
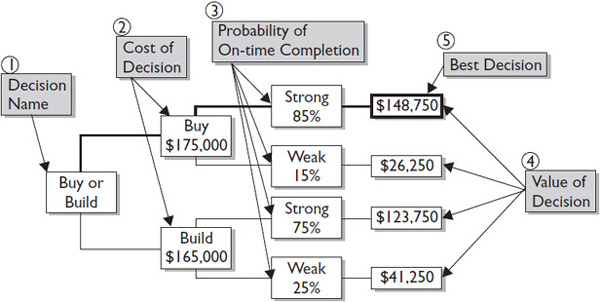
The purpose of the decision tree is to make a decision, calculate the value of that decision, or determine which decision costs the least. Follow Figure 11-7 through the various steps of the decision tree process.
Completing a Decision Tree
As the project manager of the new GFB Project, you have to decide whether to create a new web application in-house or send the project out to a developer. The developer you would use (if you were to outsource the work) quotes the project cost at $175,000. Based on previous work with this company, you are 85 percent certain they will finish the work on time.
Your in-house development team quotes the cost of the work as $165,000. Again, based on previous experience with your in-house developers, you feel 75 percent certain they can complete the work on time. Now let’s apply what we know to a decision tree:
• Buy or Build is simply the decision name.
• The cost of the decision if you “buy” the work outside of your company is $175,000. If you build the software in-house, the cost is $165,000.
• Based on your probability of completion by a given date, you apply the 85 percent certainty to the “strong” finish for the Buy branch of the tree. Because you’re 85 percent certain, you’re also 15 percent uncertain; this value is assigned to the “weak” value on the Buy branch. You complete the same process for the Build branch of the tree.
• The value of the decision is the percentage of strong and weak applied to each branch of the tree.
• The best decision is based solely on the largest value of all possible decisions.
Using a Project Simulation
Project simulations allow the project team to play “what-if” games without affecting any areas of production. The Monte Carlo analysis (sometimes called the Monte Carlo technique) is the most common simulation. This technique got its name from Monte Carlo, Monaco (world-renowned for its slot machines, roulette wheels, and other games of pure chance). The Monte Carlo technique, typically completed using a computer software program, completely simulates a project by using values for all possible variables to predict the most likely model.
Examining the Results of Quantitative Risk Analysis
Quantitative risk analysis is completed throughout the project as risks are identified and passed through qualitative analysis, as project conditions change, or on a preset schedule. The end result of quantitative risk analysis should be reflected in the risk register and includes the following:
• Probabilistic analysis The risks within the project allow the project manager or other experts to predict the likelihood of project success. The project may be altered by the response to certain risks. This response can increase cost and push back the project completion date.
• Probability of costs and schedule objectives Based on the identified risks, their impact, and the probability of occurrence, forecasts for the project schedule and the project costs are created. The more negative the risks that occur within a project, the greater the chance of delays and increased costs.
• A prioritized list of risks This list of quantified risks demonstrates those with the highest potential for endangering project success. This list includes the risks that have the greatest opportunity to affect the project. Each risk is identified with its probability and impact.
• Trends As the project moves toward completion, quantitative risk analysis may be repeated over and over. In each round of analysis, trends in the identified risks may become visible. These trends can help the project team eliminate the root cause of the risks, reduce their probability, or control their impact.
Updating the Risk Register
You guessed it. After completing a round of quantitative risk analysis, the risk register needs to be updated to reflect all the new information the project manager has learned about the project and its risks. Here’s what gets updated in the risk register:
• Probability of the project succeeding
• Probability of achieving the project’s cost and time objectives
• Prioritized list of quantified risks
• Trends the project management team has discovered
The risk register and the risk information will be updated throughout the project. This is a PMI-ism—the risk register is part of the project management plan and has to be updated throughout the project.
Planning for Risk Responses
Risk response planning is all about options and actions. It focuses on how to decrease the possibility of risks adversely affecting the project’s objectives and also on how to increase the likelihood of positive risks that can aid the project. Risk response planning assigns responsibilities to people and groups close to the risk event. Risks will increase or decrease based on the effectiveness of risk response planning.
The responses to identified risks must be in balance with the risks themselves. The cost and time invested in a risk must be met with the gains from reducing the risk’s impact and probability. In other words, a million-dollar solution for a hundred-dollar problem is unacceptable. The individuals who are assigned to the risk must have the authority to react to the project risk as planned. In most cases, several risk responses may be viable for the risk—the best choice for the identified risk must be documented, agreed upon, and then followed through should the risk come to fruition.
Preparing for Risk Responses
To successfully prepare for risk response, the project manager, project team, and appropriate stakeholders rely on several inputs—many of which stem from qualitative and quantitative risk analyses. The risk management plan is needed during the risk response planning, but the risk register is also needed to provide the following:
• A list of prioritized risks
• A risk ranking
• A prioritized list of quantified risks
• A probabilistic analysis of the project
• The probability of the project meeting the cost and schedule goals
• The list of potential responses decided upon when risks were first identified
• Any risk owners who have been identified
• A list of risks with common causal factors
• Trends from qualitative and quantitative analyses
Creating Risk Responses
The project team can employ several tools and techniques to respond to risks. Each risk should be evaluated to determine which category of risk response is most appropriate. When a category has been selected, the response must then be developed, refined, documented, and readied for use if needed. In addition, secondary responses may be selected for each risk. The purpose of risk response planning is to bring the overall risk of the project down to an acceptable level. In addition, risk response planning must address any risks that have unacceptably high scores.
Avoiding Negative Risks
Avoidance is simply avoiding the risk. This can be accomplished in many different ways and generally happens early in the project, when any change will result in fewer consequences than later in the project plan. Examples of avoidance include the following:
• Changing the project plan to eliminate the risk
• Clarifying project requirements to avoid discrepancies
• Reducing the project scope to avoid the risk
• Using a proven methodology rather than a new approach
EXAM TIP One avoidance risk strategy is to shut down the entire project to avoid the risk entirely.
Transferring Negative Risks
Transference is the process of transferring the risk (and the ownership of the risk) to a third party. The risk doesn’t disappear—it just becomes someone else’s problem. Transference of a risk usually costs a premium for the third party to own and manage. Common examples of risk transference include:
• Insurance
• Performance bonds
• Warranties
• Guarantees
• Fixed-priced contracts
Mitigating Negative Risks
Mitigating risks is an effort to reduce the probability and/or impact of an identified risk in the project. Mitigation is done based on the logic before the risk happens. The cost and time to reduce or eliminate the risks is more cost-effective than repairing the damage caused by the risk. The risk event may still happen, but hopefully the cost and impact of the risk will both be very low.
Mitigation plans can be created so that they are implemented should an identified risk cross a given threshold. For example, a manufacturing project may have a mitigation plan to reduce the number of units created per hour should the equipment’s temperature cross a given threshold. The reduction is the number of units per hour that it may cost the project in time. In addition, the cost of extra labor to run the equipment longer because the machine is now operating at a slower pace may be attributed to the project. However, should the equipment fail, the project would have to replace the equipment and be delayed for weeks while awaiting repairs.
Examples of mitigation include:
• Adding activities to the project to reduce the risk probability or impact
• Simplifying the processes within the project
• Completing more tests on the project work before implementation
• Developing prototypes, simulations, and limited releases
Managing the Positive Risk and Opportunities
While most risks have a negative connotation, not all risks are bad. There are instances when a risk may create an opportunity that can help the project, other projects, or the organization as a whole. The type of risk and the organization’s willingness to accept the risks will dictate the appropriate response.
Exploiting Positive Risks or Opportunities
When an organization would like to take advantage of a positive risk that will likely happen, it can exploit the risk. Positive risk exploitation can be realized by adding resources to finish faster than was originally planned, increasing quality to recognize sales and customer satisfaction, utilizing a better way of completing the project work, or any other method that creates the positive outcomes of the identified risk.
Sharing Positive Risks
The idea of sharing a positive risk really means sharing a mutually beneficial opportunity between two organizations or projects, or creating a risk-sharing partnership. When a project team can share the positive risk, ownership of the risk is given to the organization that can best capture its benefits.
Enhancing Positive Risks
This risk response seeks to modify the size of the identified opportunity. The goal is to strengthen the cause of the opportunity to ensure that the risk event does happen. Enhancing a project risk looks for solutions, triggers, or other drivers to ensure that the risk does come to fruition so that the rewards of the risk can be realized by the performing organization.
Accepting the Risks
Risk acceptance is the process of simply accepting the risks because no other action is feasible, or because the risks are deemed to be of small probability, impact, or both, and a formal response is not warranted. Passive acceptance requires no action; the project team deals with the risks as they happen. Active acceptance entails developing a contingency plan should the risk occur. Acceptance may be used for both positive and negative risks.
A contingency plan is a predefined set of actions the project team will take should certain events occur. Events that trigger the contingency plan should be tracked. A fallback plan is a reaction to a risk that has occurred when the primary response proves to be inadequate.
Updating the Risk Register
Are you noticing a theme here? Every time new information about the project’s risks is learned, the risk register has to be updated. Since I’m dealing with risk responses in this section, the updates to the risk register are:
• Identified risks and how each one can threaten the project
• Risk owners and their responsibilities for the risk events
• Risk response strategies and the responses to risk events
• Symptoms and warning signs of risk
• Budget and schedule impact of the risk response activities
• Contingency reserves for time and costs
• Contingency plans and triggers to implement the plan
• Fallback plans
• Residual risks (risks that are expected to remain after a risk response)
• Secondary risks (new risks created as a result of a risk response)
Creating Contracts for Risk Response
When multiple entities are involved in a project, contractual agreements may be necessary to identify the responsible parties for identified risks. The contract may be needed for insurance purposes, customer acceptance, or the acknowledgment of responsibilities between the entities completing the project. Transference is an example of contractual agreements for the responsibility of risks within a project.
Justifying Risk Reduction
To reduce risk, additional time or monies are typically needed. The process and logic behind the strategies to reduce the risk should be evaluated to determine if the solution is worth the trade-offs. For example, a risk may be eliminated by adding $7,500 to a project’s budget. However, the likelihood of the risk occurring is relatively low. Should the risk happen, it would cost, at a minimum, $8,000 to correct, and the project would be delayed by at least two weeks.
The cost of preventing the risk versus the cost of responding to it must be weighed and justified. If the project manager gambles that the risk won’t happen and doesn’t spend the $7,500 cost for the risk response, and the project moves forward as planned without the risk happening, it has theoretically saved $15,500 because the risk did not happen and the response to the risk did not need to happen.
However, if the risk does happen without the $7,500 preventive risk response, the project will lose at least $8,000 and be delayed at least two weeks. The cost inherent in the project delay may be more expensive than the solution to the risk. The judgment of solving the risk to reduce the likelihood of delaying the project may be wiser than ignoring the risk.
Updating the Project Plan
The risk reactions, contingency plans, and fallback plans should all be documented and incorporated into the project plan—for example, updating the schedule, budget, and WBS to accommodate additional time, money, and activities for risk responses. The responses to the risks may change the original implementation of the project and should be updated to reflect the project plan and intent of the project team, management, and other stakeholders. A failure to update the project plan and the risk register may cause risk reactions to be missed—and skew performance measurements.
There’s a chance you’ll also need to update the scope, cost, and schedule baselines to reflect the changes to these components of the project. For example, you may edit the project scope as part of risk response. This change in the project scope may in fact affect the costs and schedule of the project so you’d need to reflect these baselines, too. This is a great example of the integrated nature of project management. Any decision you make here in risk management, in particular risk responses, can affect the entire project and will cause a need to update the project management plan accordingly.
You’ll also need to update the assumption log if you’ve identified risks that change the project assumptions. It’s also possible that during the management of the risk, you had to generate new assumptions about how the project would behave if you were to enact certain risk responses. The technical documentation that supports the project management plan may also need to be updated if you’ve added risk responses that affect the project deliverables.
Monitoring and Controlling Project Risks
Risks must be actively monitored, and new risks must be responded to as they are discovered. Risk monitoring and control is the process of monitoring identified risks for signs that they may be occurring, controlling identified risks with the agreed-upon responses, and looking for new risks that may creep into the project. Risk monitoring and control also is concerned with the documentation of the success or failure of risk response plans and keeping records of metrics that signal risks are occurring or disappearing from the project.
Risk monitoring and control is an active process that requires participation from the project manager, the project team, key stakeholders, and, in particular, risk owners within the project. As the project progresses, risk conditions may change and require new responses, additional planning, or the implementation of a contingency plan.
There are several goals to risk monitoring and control:
• Confirm that risk responses are implemented as planned
• Determine if risk responses are effective or if new responses are needed
• Determine the validity of the project assumptions
• Determine if risk exposure has changed, evolved, or declined due to trends in the project progression
• Monitor risk triggers
• Confirm that policies and procedures happen as planned
• Monitor the project for new risks
Preparing for Risk Monitoring and Control
A project manager’s work is never done—at least, not until the project is closed. Risk monitoring and controlling is an active process. There are several inputs the project team and the project manager must rely on to effectively monitor and control risks:
• The project management plan Specifically, it’s the risk management plan that you’re after. This plan defines the organization’s approach to risk management. It is not the strategy for specific risks within a project, but the overall strategy for risk analysis and planning.
• The risk register The risk register is the central repository for all project risk information. It includes the identified risks, the potential responses, the root causes of risks, and any identified categories of risk.
• Work performance information The results of project work can inform the project manager and the project team of new and impending risks. In addition, project team members may create reports to monitor or document risks. These reports are known as issue logs, action items, jeopardy warnings, and escalation notices.
• Work performance data The project performance focuses on the balance of the project schedule, costs, and deliverables that have been created. Should any of these factors suffer, new risks are likely to enter the project.
Monitoring and Controlling Risks
Risk monitoring and control happens throughout the project. These are not solitary activities that are completed once and never revisited. The project manager and the project team must actively monitor risks, respond with the agreed-upon actions, and scan the horizon for risks that have not been addressed. Risk monitoring and control is a recurring activity that requires input from all project participants.
Project risk should be on the agenda at every project team meeting. The periodic risk review is a regularly scheduled discussion throughout the project to ascertain the level of foreseeable risks, the success of risk responses in the project to date, and a review of pending risks. Based on circumstances within the project, risk rankings and prioritization may fluctuate. Changes to the project scope, team, or conditions may require qualitative and quantitative analyses.
Completing Risk Response Audits
You don’t just assume your risk responses work—you have to test them. A risk response audit examines the planned risk responses, how well the planned actions work, and the effectiveness of the risk owners in implementing the risk responses. The audits happen throughout the project to measure the effectiveness of mitigating, transferring, and avoiding risks. The risk response audit should measure the effectiveness of the decision and its impact on time and cost. Of course, you’ll update the risk register once the audit has been completed.
Analyzing Project Variances
A variance is the difference between what was planned and what was experienced. No one likes to hear that variances are in the project, but ignoring variances can only lead to more risks, more troubles, and more headaches. Cost variances can eat into the project budget, which in turn creates new risks, such as running out of cash, having to choose a lower grade of materials, or even removing deliverables from the scope. Cost variances can also force the project manager to have to ask for more funds, which is not a pleasant experience.
Schedule variances are just as deadly. Delays in the project work, vendor deliveries, and time estimates that were too optimistic can eat into the management reserve and consume the project’s float. These risks can create new risks. Consider the risks inherent to the schedule variance responses:
• Crashing the project
• Fast-tracking the project
• Overworking the project team
• Rushing the project work
• Rushing through quality control and quality audits to regain time
Remember earned value analysis? Earned value analysis measures project performance. When project performance is waning, the project is likely missing targeted costs and schedule goals. The results of earned value analysis can signal that risks are happening within the project or that new risks may be developing.
For example, a schedule performance index (SPI) of .93 means the project is off schedule by 7 percent. A risk based on this value could mean that the project team is having difficulty completing the project work as planned. Additional work will continue to be late, the project will finish late, and quality may suffer as the team attempts to rush to complete assigned tasks.
Measuring Technical Performance
Throughout the project, the project team’s technical competence with the technology being used in the project should increase. The level of technical achievement should be in proportion to the expected level of technical performance within the project. If the project team is not performing at a level of expected technical expertise, the project may suffer additional risks due to the discrepancy. Technical performance can be measured by the successful completion of activities throughout the project or project phases.
Monitoring Contingency Reserve
As risk events happen, you’ll need to keep an eye on the risk reserves and how this budget for risk events is being depleted. Let’s say you have a risk reserve of $250,000 based on your quantitative analysis. When a risk begins, you’ll use some of the reserve to offset the impact of the event or to pay for the risk response. The cost of the actual risk event is subtracted from the $250,000—let’s pretend in this instance it’s $90,000. Now the reserve only has $160,000 to cover the remaining risk events in the project. To monitor the contingency reserve, you’ll need to see what events are still left in the project, what their probability and impact are, and compare the remaining risk exposure to what’s left in the reserve.
Examining the Results of Risk Monitoring and Control
Risk monitoring and control helps the project become more successful. Risk monitoring and control measures the planned responses to risks and creates reactions to unplanned risks. The outputs of risk monitoring and control also aim to help the project reach its objectives. Consider these outputs:
• Risk register updates As the project moves along and the project manager and the project team complete the risk assessments, audits, and risk reviews, they’ll need to record their findings in the risk register. This update may include the reevaluation of the risk’s impact, probability, and expected monetary value. For those risks that have passed in the project, the risk register should record what actually happened with the risk event and its impact on the project.
• Change requests Your favorite, I’m sure. As workarounds and contingency plans are used, they require changes to the project plan. Changes that occur as a result of the risks are completed through integrated change control. The changes are documented, approved, and incorporated into the project plan.
• Recommended corrective actions As risks come to fruition, corrective actions are needed to bypass them. The two types of corrective action are work-arounds and contingency plans. Corrective actions are actions taken to bring the project back into compliance with the project plan.
• Recommended preventive actions Preventive actions are steps taken to bring the project back into alignment with the project management plan.
• Risk response plan updates As risks occur, the responses to them should be documented and updated in the risk response plan. Should risk rankings change during the project, the change in ranking, the logic behind the change, and the results of the risk rank change should be documented in the risk response plan. For the risks that do not occur, the risks should be documented and considered closed in the risk response plan.
• Organizational process asset updates The risks from the current project can help other project managers in the future. Therefore, the project manager must work to ensure that the current risks, their anticipated impact, and their actual impact are recorded. The current risk probability and impact matrix, for example, can become a risk template for other projects in the future. This is true for just about any risk document—from the risk register to the risk breakdown structure, lessons learned, and checklists.
• Project management plan updates Some change requests and risk responses may require updates to the project management plan.
Chapter Summary
All projects have some level of risks—just how much the project stakeholders are willing to accept varies by project and organization. The quantification of the stakeholders’ tolerance for risk is called the utility function: the higher the project’s importance, the lower the utility function. Low-priority projects are generally more likely to accept risks than those projects that have a big impact on your organization. Some organizations may define their utility function as a risk-reward ratio, where a project with a large amount of risk must equate to a large amount of reward for doing the project.
Recall that at the launch of the risk planning process, there’s the creation of the risk management plan. This plan addresses how the project’s risk management approach will be directed. This plan is not specific to the risks within the project, but creates the boundaries, expectations, and general rules for the risk management process. Once this plan is in place and everyone is in agreement to abide by it, the project-specific risk management activities can commence.
The first stop is all about risk identification. This isn’t a private meeting—the project team, project manager, project sponsor, vendors, stakeholders, end users, and even customers can participate if it’s necessary. Any project-relevant risks are documented. It’s good to have a variety of participants, as their point of view can help identify risks that may have been overlooked otherwise.
As risks are identified, the project manager can use the Delphi Technique to build a consensus on which risks have the highest impact on the project. This anonymous approach allows participants to speak freely about the risks, unhindered by the opinions of other stakeholders. The comments on the identified risks are distributed to all of the participants, allowing participants to comment, concur, or dismiss opinions on the identified risks. Through rounds of discussion, a consensus on the risks is reached.
Quick, subjective, qualitative risk analysis almost always happens before quantitative analysis. Qualitative analysis qualifies the risk for more analysis or identifies the risk as a low-level risk event and adds it to the low-level risk watch list. More serious risk events and the prioritized risk events of qualitative analysis go onto quantitative analysis. Quantitative analysis provides an in-depth look at the risk events and aims to quantify the risks.
Specifically, the risk exposure for the project is tied to a dollar amount. The risk exposure is offset by a contingency reserve. Should risk events happen, monies from the contingency reserve are used to counteract the risk events. Ongoing monitoring and controlling of the risk events and their impact is essential to effective risk management.
Involved with all of these processes is the risk register. It’s the project’s journal and database of risks, their status, their impact, and any supporting detail about the risk events. As more information is gathered about the risks, the project management team updates the risk register. As the project moves past risk events, their status and outcomes are updated in the risk register. The risk register is part of the project management plan and becomes, once the project closes, part of organizational process assets for future projects.
Key Terms
Acceptance A risk response appropriate for both positive and negative risks, but often used for smaller risks within a project.
Avoidance A risk response to avoid the risk.
Brainstorming The most common approach to risk identification; usually completed by a project team with subject matter experts to identify the risks within the project.
Business risks These risks may have negative or positive outcomes. Examples include using a less experienced worker to complete a task, allowing phases or activities to overlap, or forgoing the expense of formal training for on-the-job education.
Cardinal scales A ranking approach to identify the probability and impact by using a numerical value, from .01 (very low) to 1.0 (certain).
Checklists A quick and cost-effective risk identification approach.
Data precision The consideration of the risk ranking scores that takes into account any bias, the accuracy of the data submitted, and the reliability of the nature of the data submitted.
Decision tree A method to determine which of two or more decisions is the best one. The model examines the costs and benefits of each decision’s outcome and weighs the probability of success for each of the decisions.
Delphi Technique An anonymous method of querying experts about foreseeable risks within a project, phase, or component of a project. The results of the survey are analyzed by a third party, organized, and then circulated to the experts. There can be several rounds of anonymous discussion with the Delphi Technique, without fear of backlash or offending other participants in the process. The goal is to gain consensus on project risks within the project.
Enhancing A risk response that attempts to enhance the conditions to ensure that a positive risk event will likely happen.
Expected monetary value (EMV) The monetary value of a risk exposure based on the risk’s probability and impact in the risk matrix. This approach is typically used in quantitative risk analysis because it quantifies the risk exposure.
Exploit A risk response that takes advantage of the positive risks within a project.
External risks These risks are outside of the project, but directly affect it—for example, legal issues, labor issues, a shift in project priorities, or weather. “Force majeure” risks call for disaster recovery rather than project management. These are risks caused by earthquakes, tornadoes, floods, civil unrest, and other disasters.
Flowcharts System or process flowcharts show the relationship between components and how the overall process works. These are useful for identifying risks between system components.
Influence diagrams An influence diagram charts out a decision problem. It identifies all of the elements, variables, decisions, and objectives and also how each factor may influence another.
Ishikawa diagrams These cause-and-effect diagrams are also called fishbone diagrams and are used to find the root cause of factors that are causing risks within the project.
Low-priority risk watch list Low-priority risks are identified and assigned to a watch list for periodic monitoring.
Mitigation A risk response effort to reduce the probability and/or impact of an identified risk in the project.
Monte Carlo technique A simulation technique that got its name from the casinos of Monte Carlo, Monaco. The simulation is completed using a computer software program that can simulate a project, using values for all possible variables, to predict the most likely model.
Ordinal scales A ranking approach that identifies and ranks the risks from very high to very unlikely or to some other value.
Organizational risks The performing organization can contribute to the project’s risks through unreasonable cost, time, and scope expectations; poor project prioritization; inadequate funding or the disruption of funding; and competition with other projects for internal resources.
Probability and impact matrix A matrix that ranks the probability of a risk event occurring and its impact on the project if the event does happen; used in qualitative and quantitative risk analyses.
Project management risks These risks deal with faults in the management of the project: the unsuccessful allocation of time, resources, and scheduling; unacceptable work results; and poor project management.
Pure risks These risks have only a negative outcome. Examples include loss of life or limb, fire, theft, natural disasters, and the like.
Qualitative risk analysis This approach “qualifies” the risks that have been identified in the project. Specifically, qualitative risk analysis examines and prioritizes risks based on their probability of occurring and their impact on the project should they occur.
Quantitative risk analysis This approach attempts to numerically assess the probability and impact of the identified risks. It also creates an overall risk score for the project. This method is more in-depth than qualitative risk analysis and relies on several different tools to accomplish its goal.
RAG rating An ordinal scale that uses red, amber, and green (RAG) to capture the probability, impact, and risk score.
Residual risks Risks that are expected to remain after a risk response.
Risk A project risk is an uncertain event or condition that can have a positive or negative impact on the project.
Risk identification The systematic process of combing through the project, the project plan, the work breakdown structure, and all supporting documentation to identify as many risks that may affect the project as possible.
Risk management plan A project management subsidiary plan that defines how risks will be identified, analyzed, responded to, and monitored within the project. The plan also defines the iterative risk management process that the project is expected to adhere to.
Risk management planning The agreed-upon approach to the management of the project risk processes.
Risk owners The individuals or entities that are responsible for monitoring and responding to an identified risk within the project.
Risk register The risk register is a project plan component that contains all of the information related to the risk management activities. It’s updated as risk management activities are conducted to reflect the status, progress, and nature of the project risks.
Risk response audit An audit to test the validity of the established risk responses.
Risk responsibilities The level of ownership an individual or entity has over a project risk.
Risk score The calculated score based on each risk’s probability and impact. The approach can be used in both qualitative and quantitative risk analysis.
Root cause identification Root cause identification aims to find out why a risk event may be occurring, the causal factors for the risk events, and then, eventually, how the events can be mitigated or eliminated.
Secondary risks New risks that are created as a result of a risk response.
Sensitivity analysis A quantitative risk analysis tool that examines each risk to determine which one has the largest impact on the project’s success.
Sharing A risk response that shares the advantages of a positive risk within a project.
SWOT analysis SWOT analysis is the process of examining the project from the perspective of each characteristic: strengths, weaknesses, opportunities, and threats.
Technical, quality, or performance risks Technical risks are associated with new, unproven, or complex technologies being used on the project. Changes to the technology during the project implementation can also be a risk. Quality risks are the levels set for expectations of impractical quality and performance.
Transference A risk response that transfers the ownership of the risk to another party. Insurance, licensed contractors, or other project teams are good examples of transference. A fee and contractual relationships are typically involved with the transference of a risk.
Questions
1. Mary and Thomas are project managers for their organization and they’re discussing risk management and risk responses. Thomas insists that an organization should never accept a project risk and Mary says that sometimes it’s okay. They’ve called on you, a project management expert, to help with this decision. When is it appropriate to accept a project risk?
A. It is never appropriate to accept a project risk.
B. All risks must be mitigated or transferred.
C. It is appropriate to accept a risk if the project team has never completed this type of project work before.
D. It is appropriate if the risk is in balance with the reward.
2. Frances is the project manager of the LKJ Project. Which of the following techniques will she use to create the risk management plan?
A. Risk tolerance
B. Status meetings
C. Planning meetings
D. Variance meetings
3. You are the project manager of the GHK Project. You and the manufacturer have agreed to substitute the type of plastic used in the product to a slightly thicker grade should there be more than 7 percent error in production. The thicker plastic will cost more and require the production to slow down, but the errors should diminish. This is an example of which of the following?
A. Threshold
B. Tracking
C. Budgeting
D. JIT manufacturing
4. You are a project manager consultant for the Allen T1 Company and you’re helping them create a risk management plan for their project management office. You’re explaining the concept of risk tolerance and how it affects the risk management policies. An organization’s risk tolerance is also known as what?
A. The utility function
B. Herzberg’s Theory of Motivation
C. Risk acceptance
D. The risk-reward ratio
5. The customers of the project have requested additions to the project scope. The project manager notifies you that additional risk planning will need to be added to the project schedule. Why?
A. The risk planning should always be the same amount of time as the activities required by the scope change.
B. Risk planning should always occur whenever the scope is adjusted.
C. Risk planning should only occur at the project manager’s discretion.
D. The project manager is incorrect. Risk planning does not need to happen at every change in the project.
6. Jason is the project manager for his organization and he’s working with his project team to identify and analyze project risks. Jason begins to create a risk register as part of this process, but his team doesn’t understand what a risk register is or its purpose. Which one of the following best describes the risk register?
A. It documents all of the outcomes of the other risk management processes.
B. It’s a document that contains the initial risk identification entries.
C. It’s a system that tracks all negative risks within a project.
D. It’s part of the project’s project management information system (PMIS) for integrated change control.
7. You are a project management consultant for the Steinberg Organization and you’re helping them categorize risks they may encounter in their projects. For starters, you identify some basic risk categories but your client wants to see some examples of these categories. You tell them, for example, that _______________________ include(s) fire, theft, or injury, and offer(s) no chance for gain.
A. Business risks
B. Pure risks
C. Risk acceptance
D. Life risks
8. Complete this sentence: A project risk is a(n) ______________________ occurrence that can affect the project for good or bad.
A. Known
B. Potential
C. Uncertain
D. Known unknown
9. Bradley is the project manager for his organization and he’s working with his project team to identify risks. Some of the project team members are confused as to when risk identification should happen in the project. When should risk identification happen?
A. As early as possible in the initiation process
B. As early as possible in the planning process
C. Throughout the product management life cycle
D. Throughout the project life cycle
10. You are the project manager of the KLJH Project. This project will last two years and has 30 stakeholders. How often should risk identification take place?
A. Once at the beginning of the project
B. Throughout the execution processes
C. Throughout the project
D. Once per project phase
11. Ruth is a project management expert and consultant for businesses creating project management offices. Ruth’s current client wants help to better identify risks. Which one of the following is an acceptable tool for risk identification?
A. Decision tree analysis
B. Decomposition of the project scope
C. The Delphi Technique
D. Pareto charting
12. You are the project manager for a project that will create a new and improved web site for your company. Currently, your company has over 8 million users around the globe. You would like to poll experts within your organization with a simple, anonymous form asking about any foreseeable risks in the design, structure, and intent of the web site. With the collected information, subsequent anonymous polls are submitted to the group of experts. This is an example of _________________________________.
A. Risk identification
B. A trigger
C. An anonymous trigger
D. The Delphi Technique
13. Alice is a project manager for her organization and she’s working with the project team to identify project risks and rank them by impact and probability. Which risk analysis technique provides the project manager with a risk ranking?
A. Quantifiable
B. Qualitative
C. The utility function
D. SWOT analysis
14. A table of risks, their probability, impact, and a number representing the overall risk score is called a ____________________________.
B. Probability-impact matrix
C. Quantitative matrix
D. Qualitative matrix
15. You are presented with the following table:

What is the EMV for Risk Event 3?
A. $135
B. –$300
C. $45
D. –$135
16. You are presented with the following table:
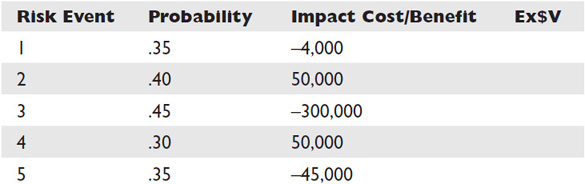
Based on the preceding numbers, what is the amount needed for the contingency fund?
A. Unknown with this information
B. 249,000
C. 117,150
D. 15,750
17. The water sanitation project manager has determined that the risks associated with handling certain chemicals are too high. He has decided to allow someone else to complete this portion of the project, and so has outsourced the handling and installation of the chemicals and filter equipment to an experienced contractor. This is an example of which of the following?
A. Avoidance
C. Mitigation
D. Transference
18. A project manager and the project team are actively monitoring the pressure gauge on a piece of equipment. Sarah, the engineer, recommends a series of steps to be implemented should the pressure rise above 80 percent. The 80 percent mark represents what?
A. An upper control limit
B. The threshold
C. Mitigation
D. A work-around
19. You are presented with the following table:
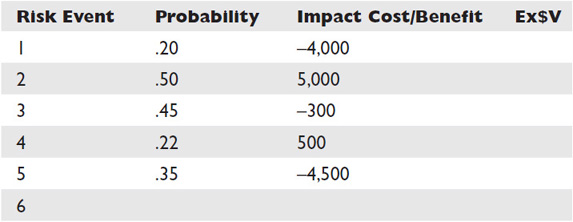
What would Risk Event 6 be, based on the following information: Marty is 60 percent certain that he can get the facility needed for $45,000, which is $7,000 less than what was planned for.
A. .60, 45,000, 27,000
B. .60, 52,000, 31,200
C. .60, 7,000, 4,200
D. .60, –7,000, –4,200
20. You are the project manager for your organization and you’re working with the project team to identify the project risks, rank the risks on probability and impact, and then create a risk contingency reserve. As part of these processes, you want to explore multiple scenarios of risk events in the project so you’re utilizing different tools to analyze the project risks. Based on this information, which of the following can determine multiple scenarios, given various risks and the probability of their impact?
A. A decision tree
B. The Monte Carlo technique
C. A Pareto chart
D. A Gantt chart
Questions and Answers
1. Mary and Thomas are project managers for their organization and they’re discussing risk management and risk responses. Thomas insists that an organization should never accept a project risk and Mary says that sometimes it’s okay. They’ve called on you, a project management expert, to help with this decision. When is it appropriate to accept a project risk?
A. It is never appropriate to accept a project risk.
B. All risks must be mitigated or transferred.
C. It is appropriate to accept a risk if the project team has never completed this type of project work before.
D. It is appropriate if the risk is in balance with the reward.
2. Frances is the project manager of the LKJ Project. Which of the following techniques will she use to create the risk management plan?
A. Risk tolerance
B. Status meetings
C. Planning meetings
D. Variance meetings
3. You are the project manager of the GHK Project. You and the manufacturer have agreed to substitute the type of plastic used in the product to a slightly thicker grade should there be more than 7 percent error in production. The thicker plastic will cost more and require the production to slow down, but the errors should diminish. This is an example of which of the following?
A. Threshold
B. Tracking
C. Budgeting
D. JIT manufacturing
4. You are a project manager consultant for the Allen T1 Company and you’re helping them create a risk management plan for their project management office. You’re explaining the concept of risk tolerance and how it affects the risk management policies. An organization’s risk tolerance is also known as what?
A. The utility function
B. Herzberg’s theory of motivation
C. Risk acceptance
D. The risk-reward ratio
5. The customers of the project have requested additions to the project scope. The project manager notifies you that additional risk planning will need to be added to the project schedule. Why?
A. The risk planning should always be the same amount of time as the activities required by the scope change.
B. Risk planning should always occur whenever the scope is adjusted.
C. Risk planning should only occur at the project manager’s discretion.
D. The project manager is incorrect. Risk planning does not need to happen at every change in the project.
6. Jason is the project manager for his organization and he’s working with his project team to identify and analyze project risks. Jason begins to create a risk register as part of this process, but his team doesn’t understand what a risk register is or its purpose. Which one of the following best describes the risk register?
A. It documents all of the outcomes of the other risk management processes.
B. It’s a document that contains the initial risk identification entries.
C. It’s a system that tracks all negative risks within a project.
D. It’s part of the project’s project management information system (PMIS) for integrated change control.
7. You are a project management consultant for the Steinberg Organization and you’re helping them categorize risks they may encounter in their projects. For starters, you identify some basic risk categories but your client wants to see some examples of these categories. You tell them, for example, that _______________________ include(s) fire, theft, or injury, and offer(s) no chance for gain.
A. Business risks
B. Pure risks
C. Risk acceptance
D. Life risks
8. Complete this sentence: A project risk is a(n) ______________________ occurrence that can affect the project for good or bad.
A. Known
B. Potential
C. Uncertain
D. Known unknown
9. Bradley is the project manager for his organization and he’s working with his project team to identify risks. Some of the project team members are confused as to when risk identification should happen in the project. When should risk identification happen?
A. As early as possible in the initiation process
B. As early as possible in the planning process
C. Throughout the product management life cycle
D. Throughout the project life cycle
10. You are the project manager of the KLJH Project. This project will last two years and has 30 stakeholders. How often should risk identification take place?
A. Once at the beginning of the project
B. Throughout the execution processes
C. Throughout the project
D. Once per project phase
11. Ruth is a project management expert and consultant for businesses creating project management offices. Ruth’s current client wants help to better identify risks. Which one of the following is an acceptable tool for risk identification?
A. Decision tree analysis
B. Decomposition of the project scope
C. The Delphi Technique
D. Pareto charting
12. You are the project manager for a project that will create a new and improved web site for your company. Currently, your company has over 8 million users around the globe. You would like to poll experts within your organization with a simple, anonymous form asking about any foreseeable risks in the design, structure, and intent of the web site. With the collected information, subsequent anonymous polls are submitted to the group of experts. This is an example of _________________________________.
A. Risk identification
B. A trigger
C. An anonymous trigger
D. The Delphi Technique
13. Alice is a project manager for her organization and she’s working with the project team to identify project risks and rank them by impact and probability. Which risk analysis technique provides the project manager with a risk ranking?
A. Quantifiable
B. Qualitative
C. The utility function
D. SWOT analysis
14. A table of risks, their probability, impact, and a number representing the overall risk score is called a ____________________________.
A. Risk table
B. Probability-impact matrix
C. Quantitative matrix
D. Qualitative matrix
15. You are presented with the following table:

What is the EMV for Risk Event 3?
A. $135
B. –$300
C. $45
D. –$135
16. You are presented with the following table:
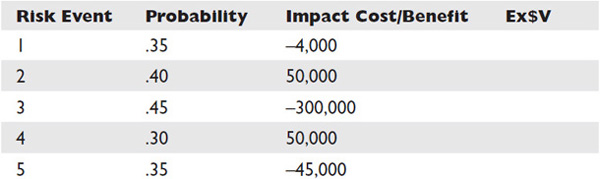
Based on the preceding numbers, what is the amount needed for the contingency fund?
A. Unknown with this information
B. 249,000
C. 117,150
D. 15,750

17. The water sanitation project manager has determined that the risks associated with handling certain chemicals are too high. He has decided to allow someone else to complete this portion of the project, and so has outsourced the handling and installation of the chemicals and filter equipment to an experienced contractor. This is an example of which of the following?
A. Avoidance
B. Acceptance
C. Mitigation
D. Transference
18. A project manager and the project team are actively monitoring the pressure gauge on a piece of equipment. Sarah, the engineer, recommends a series of steps to be implemented should the pressure rise above 80 percent. The 80 percent mark represents what?
A. An upper control limit
B. The threshold
C. Mitigation
D. A work-around
19. You are presented with the following table:

What would Risk Event 6 be, based on the following information: Marty is 60 percent certain that he can get the facility needed for $45,000, which is $7,000 less than what was planned for.
A. .60, 45,000, 27,000
B. .60, 52,000, 31,200
C. .60, 7,000, 4,200
D. .60, –7,000, –4,200
20. You are the project manager for your organization and you’re working with the project team to identify the project risks, rank the risks on probability and impact, and then create a risk contingency reserve. As part of these processes you want to explore multiple scenarios of risk events in the project so you’re utilizing different tools to analyze the project risk. Based on this information, which of the following can determine multiple scenarios, given various risks and the probability of their impact?
A. A decision tree
B. The Monte Carlo technique
C. A Pareto chart
D. A Gantt chart