This chapter shows you how to use one of Tk’s most complex widgets, the canvas widget. The canvas is a general purpose widget you can use to display drawing primitives, such as arcs, lines, polygons, and other shapes; images in a variety of formats; text; and even other embedded widgets. The objects in a canvas widget can, like the text in a text box, have tags, and you can assign tagged objects their own event bindings and display attributes. With some work on your part, you can even animate the objects in a canvas. Animation and embedded widgets exceed the scope of this book, but I will show you how to use many of the canvas widget’s other features in this chapter. First, however, you get to solve a puzzle.
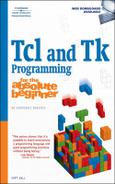
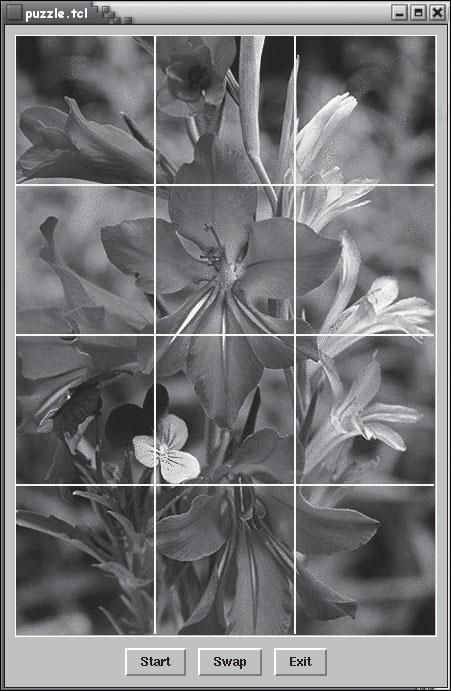
This chapter’s program, Got the Picture, challenges you to solve a puzzle (see puzzle.tcl in this chapter’s code directory). It starts with an image of a Byzantine gladiolus. When you click the Start button, the picture is divided into 12 rectangular tiles and mixed up on the game board. Your task is to rearrange the pieces and reconstruct the original picture. To do so, select two pieces to swap their position on the board and then click the Swap button. Figures 15.1–15.4 show the game at various stages.


As the name itself suggests, the canvas widget creates a blank area on which you draw or paint to your heart’s programmatic content (a blank canvas, get it?). As I remarked in the introduction, the canvas widget is one of the most complex widgets in the Tk toolkit, if not the most complex. The downside of this complexity is that you have a lot to learn. The upside is that the canvas widget is immensely capable, and there is little you can’t do with it. I’ll start with a pro forma listing of the attributes and operations that are unique to the canvas widget or whose usage in the context of the canvas widget differs from what you have encountered before. Table 15.1 lists the attributes, and Table 15.2 lists the operations.
Table 15.1. Attributes for the canvas Widget
Attribute | Description |
|---|---|
| Specifies a floating point value that controls how close to an object the mouse cursor must be before it is “close enough” to be considered inside the item (defaults to 1.0). |
| If true (the default), the canvas’ view is restricted to the region defined by |
| Specifies the |
| Specifies a list of coordinates of a rectangular region (left, top, right, and bottom, in that order), considered the viewable area of a |
| Specifies the canvas widget’s default state, which must be one of |
| Specifies the |
| Specifies the command sent to a |
| Specifies the increment (in screen units) in which the view moves when the view is scrolled horizontally. |
| Specifies the command sent to a |
| Specifies the increment (in screen units) in which the view moves when the view is scrolled vertically. |
Table 15.2. Operations for the canvas Widget
Operation |
|---|
$c addtag tag search ?arg ...? $c canvasx screenx ?spacing? $c canvasy screeny ?spacing? $c coords id ?x y? $c create type x y ?...? $c dchars id first ?last? $c delete ?id ...? $c dtag id ?tag? $c find cmd ?...? $c gettags id $c icursor id index $c index id index $c insert id before str $c move id xAmt yAmt $c postscript ?...? $c scale id xStart yStart xScale yScale $c select option ?id arg? $c type id $c xview arg ?...? $c view arg ?...? |
A dry, soulless recitation of the canvas widget’s attributes and operations won’t get you anywhere near a state of productivity with it. To get started, you’ll need to know the canvas widget’s coordinate system.
Before I proceed, let me define a convention for referring to points that I’ll use throughout the rest of this chapter. Points on canvas widgets are uniquely identified by Cartesian coordinates in the form (x,y), where x refers to a point’s X coordinate and y refers to its Y coordinate. To refer to a pair of X and Y coordinates, I’ll use the notation (x,y). So, for example, (0,0) describes the point whose X and Y coordinates are both 0; (640,480) refers to a point whose X coordinate is 640 and whose Y coordinate is 480.
With that bit of housekeeping out of way, the canvas widget is laid out in a coordinate system whose origin is the upper left-hand corner of the screen. That corner has the X and Y coordinates (0,0). X, the horizontal position, increases as you move to the right across the canvas, and Y increases as you move down the widget. The width of the canvas is set by the like named -width attribute. The height, similarly, is determined by the -height attribute. Figure 15.5 illustrates the point, so to speak.
As you can see in Figure 15.5, the upper right-hand corner has the coordinates (x,0), the lower left-hand corner has the coordinates (0,y), and the lower right-hand corner has the coordinates (x,y).
Be default, widgets are dimensioned in pixels. You can change the units by appending one of the following letters to use the corresponding unit:
c–Centimeters
i–Inches
m–Millimeters
p–Points
A “point” in this context refers to traditional printer’s points, which are ![]() ”. The examples I use in this chapter will be defined in terms of pixels.
”. The examples I use in this chapter will be defined in terms of pixels.
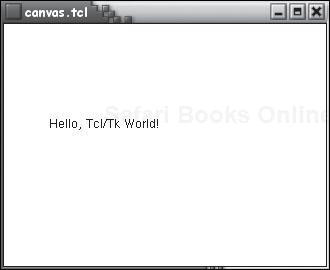
The following script shows a simple canvas widget with some embedded text.
set c [canvas .c -width 320 -height 240 -bg white -relief sunken]
$c create text 100 100 -text "Hello, Tcl/Tk World!"
grid $c
The first command creates a canvas widget that is 320 pixels wide and 240 pixels tall with a white background. The entire widget has a sunken relief. The second command draws the text Hello, Tcl/Tk World! on the canvas at the coordinates (100,100). Figure 15.6 shows the resulting figure.
The canvas widget has a number of built-in drawing primitives that you can use to compose more sophisticated content. Drawing primitives describe the basic drawing operations that the widget supports. Tk’s documentation refers to drawing primitives as canvas objects, so that’s the terminology I’ll use. The list of supported canvas objects includes the following, arranged in alphabetical order:
arc. –Arcs, or curved line segments
bitmaps. –Bitmaps, or two-color graphic images
image. –Images, either bitmaps or one of several full-color graphic formats
line. –Straight lines
oval. –Ovals, or any closed, circular shape
polygon. –Polygons, made up of a number of connected line segments
rectangle. –Rectangles, or any close, rectilinear shape
window. –Embedded windows, or other widgets embedded in a
canvaswidget
The following sections discuss drawing each of these objects, with the exception of the window object. I omit discussion of window objects because I consider embedded windows to be an advanced topic that you probably won’t need until you progress further in your Tk scripting.
Each class of canvas objects has a number of attributes that you can use to define its behavior and appearance. Not surprisingly, some object attributes are unique to the object in question; other attributes are common to all canvas objects. To avoid considerable tedium and repetition, Table 15.3 lists these common or shared attributes.
Table 15.3. Shared Canvas Object Attributes
Description | |
|---|---|
| Defines the dash pattern of a line or outline enclosing an object in its |
| Defines an object’s fill color in its |
| Defines an object’s outline color in its |
| Defines the stipple pattern used to draw the outline of an object in its |
| Defines the stipple pattern used to fill an object in its |
| Defines the width of the outline drawn around an object’s region in its |
| Defines the dash pattern of a line or outline of an object in its |
| Defines the offset into an object where the dashes appear; used with |
| Defines the dash pattern of a line or outline of an object in its |
| Defines the fill color of an object in its |
| Defines the color of the outline when an outlined object is in its |
| Defines the stipple pattern used to draw the outline of an object in its |
| Defines the stipple pattern used to fill an object in its |
| Defines the width of the outline drawn around an object’s region in its |
| Defines the fill color of an object in its |
| Defines the offset of stipples in either |
| Defines the color of the outline when an outlined object is in its |
| Defines the stipple pattern used to draw the outline of an object in its |
| Defines an object’s state (one of |
| Defines the stipple pattern used to fill an object in its |
| Defines a list of one or more tags to apply to an object. |
| Defines the width of the outline drawn around an object’s region in its |
The dash-related attributes bear on the canvas widget’s (relatively new) ability to draw lines and outlines using dashed lines. Each dash-related attribute accepts a single argument, pattern, which defines the appearance of the dashed line. To demonstrate my earlier comment about the canvas widget’s complexity, the pattern argument can take one of two forms: a list of integers whose values define the length of the line segments used to draw the dashed line, or a string that defines the proportions of the line segments used to draw the dashed line.
An arc is a section of an oval defined by two angles: a start and an extent.
Use the following command to create arc objects:
$c create arc coords ?attr ...?
$c refers to the canvas widget on which the arc object is being drawn. The coords argument defines opposite corners of a rectangular region that would serve as the bounding box of an oval. Instead of an oval, though, an arc object consists of a curved line segment along an oval. The line segment begins at the angle specified by the -start attribute and extends through the angle specified by the -extent attribute. The attr argument specifies the attributes, if any, to apply to the resulting object. The return value of the create arc command is an identifier or handle that can be used in calls to the itemcget and itemconfigure commands and other commands that require an item identifier that refers to a canvas object.
The arc object supports the object-specific attributes listed in Table 15.4.
Table 15.4. Arc Object Attributes
Attribute | Description |
|---|---|
| Specifies the length in |
| Specifies the beginning of the arc’s angular range in degrees. |
| Specifies the arc style, which must be one of |
An arc is drawn in the counter-clockwise direction from -start through -extent, starting at the 3 o’clock position. The -extent attribute defines the length of the arc, not its endpoint. Thus, if -start is 30 and -extent is 60, you wind up with a 90-degree arc. The degrees argument can be specified with negative values. If the -extent attribute is greater than 360 or less than -360, then the value applied will be degrees modulo 360.
The following script, arc.tcl in this chapter’s code directory, illustrates each of the possible arc styles:
set c [canvas .c -width 300 -height 300 -bg "white"]

$c create oval 10 10 290 290 -fill "#dddddd" -outline "#dddddd"

$c create arc 10 10 290 290 -start 90 -extent 60 -style arc
    -outline "red" -activeoutline "dark red" -activewidth 5

$c create arc 10 10 290 290 -start 0 -extent 45 -style pieslice
    -fill "light blue" -outline "light blue"
    -activeoutline "dark blue" -activewidth 5

$c create arc 10 10 290 290 -start 180 -extent 90 -style chord
    -fill "yellow" -outline "yellow"
    -activeoutline "orange" -activewidth 5

grid $c
The canvas object is 300×300 pixels square with a white background. I created four canvas objects to place on the canvas: an oval and three arcs. Its purpose in this program is to show that the three arc objects are part of the same oval. I filled each arc with a different color so that you can tell them apart and recognize the difference between each of the three arc styles.
The first arc is 60 degrees long, starting from the 90-degree point on the circle and extending 60 degrees (-start 90 -extent 60). It is drawn in the (somewhat confusingly named) arc style, so it lacks an area to fill. The default color (shown when the object is in its normal state) is red (-outline red). Moving the mouse cursor over it changes its state to active, so the -activeoutline color (dark red) and the -activewidth (5 pixels) cause it to stand out.
The second arc is only 30 degrees long. Drawn in the pieslice style, it has a -fill color of sky blue. The -activeoutline and -activewidth attributes are dark blue and 5, respectively. Again, the purpose of using these attributes is to make the object stand out when the cursor hovers over it and to illustrate the behavior of the object in its active state. Notice also that the pieslice style creates an area defined by the arc itself plus two line segments between the center of the oval and the ends of the arc.
The third arc uses the chord style. Its notable feature is that the chord’s area is defined by a linear line segment between the arc’s endpoints, which are at 180 degrees and 270 degrees. Figure 15.7 shows arc.tcl’s window in a normal state, that is, with none of the embedded objects activated. Figure 15.8 shows the third arc, the yellow chord, activated.


The canvas widget’s bitmap object enables you to position and display bitmaps in the canvas. However, these bitmaps are not the colored bitmaps you are accustomed to using as icons, clip art, and the like. Rather, they are a much simpler graphic. In the context of Tk, a bitmap, more properly referred to as a bitmap image, refers to an image whose pixels can display one of two colors or be transparent. Speaking strictly technically, a bitmap image consists of a foreground color, a background color, a source bitmap, and a mask bitmap. The source and mask bitmaps are a rectangular grid of zeros and ones, and both grids are the same size. In the source bitmap, pixel values of 1 map to a foreground color and pixel values of 0 map to a background color. The mask bitmap controls which portions of the source bitmap you actually see. In the mask bitmap, a value of 0 hides (masks) the corresponding pixel in the source bitmap, causing nothing to be displayed. A value of 1 allows the corresponding pixel from the source bitmap to be displayed.
This background information might be more than you wanted to know about old-fashioned bitmaps, but it is necessary to understanding why bitmap objects behave the way they do. Use the following command to create bitmap objects:
$c create bitmap x y ?attr ...?
$c refers to the canvas widget on which the bitmap object is being drawn. The x and y arguments define a point around which the bitmap will be drawn. By default, the bitmap is centered on that point, but you can use the -anchor attribute to modify where the bitmap will be positioned relative to the specified coordinates. The attr argument specifies the attributes, if any, you want applied to the bitmap object. The bitmap object supports the object-specific attributes listed in Table 15.5.
Table 15.5. Bitmap Object Attributes
Attribute | Description |
|---|---|
| Specifies the color of the bitmap’s 0-valued pixels in its |
| Specifies the bitmap to display in its active state. |
| Specifies the color to use for the bitmap’s 1-valued pixels in active, defaulting to black. |
| Positions the bitmap relative its positioning point, defaulting to |
| Specifies the color of the bitmap’s 0-valued pixels in its |
| Specifies the bitmap to display in its normal state. |
| Specifies the color of the bitmap’s 0-valued pixels in its disabled state. If omitted or if |
| Specifies the bitmap to display in its disabled state. |
| Specifies the color to use for the bitmap’s 1-valued pixels in its disabled state, defaulting to black. |
| Specifies the color to use for the bitmap’s 1-valued pixels in its normal state, defaulting to black. |
Tk’s bitmaps are primitive in comparison to other image formats and, insofar as Tk supports more modern image formats, I’m going to skip further discussion of the canvas widget’s bitmap object and direct you instead to the more capable and visually appealing image object discussed next. However, the script bitmap.tcl in this chapter’s code directory illustrates how to use the bitmap object.
The image object is Tk’s general purpose object for non-bitmap images. Before you use an image object on a canvas widget, you must first create the image using the image create command. Before diving into the specifics of the canvas widget’s image object, I need to take a detour through the image command because you need to know how Tk deals with images that aren’t bitmaps.
The image command is used to create and manipulate images. It can create the two-color bitmaps described earlier and non-bitmap images. By non-bitmap images, I mean image types other than the simple, two-color graphic objects I’ve already described.
Note: Why Two Commands for Working with Bitmaps?
The Tk core has two commands for dealing with the bitmap format due to historical reasons. The original command was bitmap. When Tk was first created, the bitmap command was added specifically to give developers native commands for working with X bitmaps, the simple two-color bitmap format you’ve already seen. As display technology evolved, Tk lagged behind. Eventually, support for full-color images was added via the image command. However, to preserve backward compatibility with older Tk code, support for the two-color bitmap format was included in the image command, and the original bitmap command was preserved. Tk continues to schlep around the old bitmap support, but most people will want to use the image command because it supports a wider variety of images.
Table 15.6 summarizes the image command’s operations.
Table 15.6. Operations for the image Command
Operation | Description |
|---|---|
| Creates an image of the specified |
|
|
| Deletes the |
| Returns the height in pixels of the |
| Returns a Boolean true if the |
| Returns a list of all currently defined |
| Returns the type of the |
| Returns a list of all the possible image types. |
| Returns the width in pixels of the |
The Tk core only supports two values for the type argument, bitmap (the two-color format described previously), and photo which, despite its name, supports several full-color image formats (PPM, PGM, and GIF), image dithering, and gamma correction. Support for many other image formats, such as JPEG, TIFF, and PNG, is available through Tk extensions. To keep things simple, I’ll use the photo image type and the GIF format.
The following script creates an image, populates it with a picture of a dahlia from my garden, and displays some information about the image (see image.tcl in this chapter’s code directory):
set img [image create photo]
$img read dahlia.gif

set f [frame .f -bg "white"]
set top [label $f.top -image $img -bg "white"]
set nfo [label $f.nfo -bg "white"]

lappend data
    "Handle: $img
"
    "Height: [image height $img]
"
    "Width : [image width $img]
"

    "In use: [image inuse $img]
"
    "Type  : [image type $img]"
foreach datum $data {
       append t $datum
}
$nfo configure -text $t -justify left

grid $f -sticky nsew
grid $top -sticky nsew
grid $nfo -sticky w
For the purposes of the present discussion, the first two lines of code are the most important because they show how to create an image and how to populate it with image data:
set img [image create photo]
$img read dahlia.gif
The first line creates an image of type photo, storing the returned identifier in the variable $img. Notice that I did not assign an identifier to the created image using the -name attribute. As a result, the image command synthesizes a name by appending an integer to the text image. As you can see in Figure 15.9, the identifier is image1. The second line populates the image by reading the contents of the file dahlia.gif ($img read dahlia.gif).

To display the image, I use a label widget ($top) and set its -image attribute to $img. I used the second label, $nfo, to display some of the information about the image. Figure 15.9 shows the resulting window.
To create and populate the image in a single command, I could have written set img [image create photo -file dahlia.gif]. The attribute -file dahlia.gif tells the image create command to read the data for the image from the file dahlia.gif.
The previous section just slapped an image onto a label widget for demonstration purposes. In this section, I’m going to describe how to take an image created with image create and paint it on a canvas. Use the following command to create image objects:
$c create image x y ?attr ...?
$c refers to the canvas widget on which the image object is being drawn. The x and y arguments define a point around which the image object will be drawn. By default, the image is centered on that point, but you can use the -anchor attribute to modify where the bitmap will be positioned relative to the specified coordinates. The attr arguments, if any, list the object attributes you want to apply to the resulting image object. Of the common options listed in Table 15.7, the image object supports only the -state and -tags attributes, but it also supports the object-specific attributes listed in Table 15.7.
Table 15.7. Image Object Attributes
Attribute | Description |
|---|---|
| Specifies the image to display in the object’s active state, where |
| Positions the bitmap relative to its positioning point, defaulting to |
| Specifies the image to display in the object’s disabled, where |
| Specifies the image to display in the object’s |
The following script, c_image.tcl in this chapter’s code directory, demonstrates how to use the image object:
set img [image create photo dahlia -file "dahlia.gif"]

set w [image width $img]
set h [image height $img]
set x [expr $w / 2]
set y [expr $h / 2]

set c [canvas .c -background "white" -height $h -width $w]
$c create image $x $y -image $img

grid $c -sticky nsew
The first command uses the image command discussed in the previous section to create an image. Unlike the earlier example, I use the -file attribute to specify the contents of the image object and also define the identifier I want assigned to the resulting image. The next two commands get the width and height of the image, storing them in the variables $w and $h, respectively. I’ll use these values to dimension the canvas widget when I define it. I also will use the width and height values to calculate the center of the image, storing these values in the variable $x and $y, respectively. I use the values to specify the anchor point of the image object when I create it.
Next, I define the canvas widget, using the width and height values just described (set c [canvas .c -background "white" -height $h -width $w]). Similarly, the following command, $c create image $x $y -image $img, creates the image object to draw on the canvas widget. Unlike the bitmap example you saw earlier, I used an image identifier rather than a filename to create the image. Both methods are acceptable; the reason I used the identifier rather than a filename is to demonstrate the proper syntax.
Figure 15.10 shows c_image.tcl’s window.

The line object is used to draw both straight and curved lines. In the simplest case, a straight line, you specify a starting and ending point. To draw curved lines, you can use either a series of joined line segments, or you can draw a spline and instruct the canvas to smooth the spline. In addition, you (or your users) can draw lines using the mouse. The example script you’ll see shortly uses the mouse to draw the lines. Other features of the canvas widget’s line object include varying the width of the line itself, the ability to place arrows at one or both ends of a line segment, and being able to specify the appearance of the points (vertexes) at which two lines meet.
Use the following command to create line objects:
$c create line coords ?attr ...?
$c refers to the canvas widget on which the line object is being drawn. The coords variable is a list of two or more pairs of (x,y) coordinates defining points along the line at which line segments are joined. The attr arguments specify the attributes you want to apply to a line segment.
The line object supports the object-specific attributes listed in Table 15.8.
Table 15.8. Line Object Attributes
Attribute | Description |
|---|---|
| Specifies if and how many arrowheads to draw at the ends of the line; where must be one of none, |
| Specifies the arrowhead shape where ( |
| Specifies how to draw line caps, where style is one of |
| Specifies how to draw line joints, where |
| Specifies if the line should be smoothed; used with |
| Specifies the number of line segments used to smooth a curve; used with |
If you specify the -arrow attribute, you can use the -arrowshape {N L W} attribute to specify a three-element list that defines the arrow’s characteristics. The list elements define the lengths of arrow components, as described on the next page:
N–The first list element defines length of the neck, of the arrow, which is the part of the arrowhead that touches the line.
L–The second list element defines overall length of the arrow from its base or neck to its tip.
W–The third list element defines the distance from the outside edge of the line to each of the trailing points.
Figure 15.11 shows the parts of an arrow.
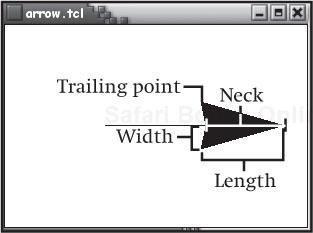
Tk attempts to use an internally defined heuristic to set the arrowhead size if you omit -arrowshape. In particular, if you request arrows but don’t specify -arrowshape, the neck of the arrow will be eight pixels long, the length of the arrow will be ten pixels long, and the width of the arrow will be three pixels. Thus, the equivalent -arrowshape attribute would be -arrowshape {8 10 3}.
If you want to experiment with the -arrowshape attribute, you can use the script arrow.tcl in this chapter’s code directory. It’s the script I used to create Figure 15.11.
The following script, arrows.tcl in this chapter’s code directory, shows you how to use the -arrow and -arrowshape attributes:
set c [canvas .c -width 300 -height 300 -bg "white"]

set l1 [$c create line 60 10 60 290 -arrow none]
set l2 [$c create line 120 10 120 290 -arrow first -arrowshape {8 10 3}]
set l3 [$c create line 180 10 180 290 -arrow last -arrowshape {16 20 6}]
set l4 [$c create line 240 10 240 290 -arrow both -arrowshape {40 45 13}]

grid $c -sticky nsew
After creating a canvas, I create four line objects named l1 through l4. Each line is perfectly vertical because the endpoints of each line have the same X coordinate. Similarly, they are all the same length, 280 pixels, because they share common starting and ending Y coordinates (10 and 290, respectively). The only difference between them is the shape and location of the arrows: l1 has no arrows; l2 has an arrow at its first endpoint, which is the point (120,10); l3 has an arrow at its last (or second) endpoint, which is the point (280,290); l4 has somewhat oversized arrows at both ends of the line.
Each arrowhead is bigger than the one on the line preceding it. As I mentioned earlier, the default shape corresponds to the attribute -arrowshape {8 10 3}, so I could have written the command for creating the line l2 as set l2 [$c create line 120 10 120 290 -arrow first].
Figure 15.12 shows what the lines and arrows in arrows.tcl look like.

Table 15.8 shows that the -smooth attribute accepts a Boolean argument. If you specify - smooth false (or -smooth 0), the line will not be smoothed; -smooth true or -smooth 1 causes the line to be smoothed using a Bezier curve.
Note: A Slight Oversimplification
Only Bezier curve smoothing is supported in the Tk core, so the -smooth attribute behaves as I described: Setting it to true results in a line that has been smoothed using a Bezier curve. However, Tk supports loading smoothing algorithms from external libraries at runtime. If this is done (a topic that is well beyond this book’s scope), then the argument to -smooth can also be the name of a smoothing algorithm to apply.
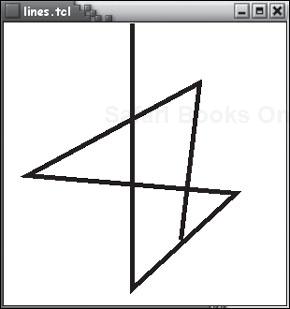
The next script, lines.tcl, creates a series of line segments and joins them using the -joinstyle attribute:
proc RandomInt {min max} {
    return [expr int($min + (rand() * ($max - $min + 1)))]
}

proc MakePoint {} {
    set x [RandomInt 0 300]
    set y [RandomInt 0 300]
    return [list $x $y]
}

for {set i 0} {$i < 6} {incr i} {
    lappend coords [MakePoint]
}
set c [canvas .c -width 300 -height 300 -bg "white"]
$c create line [join $coords] -width 5 -joinstyle round
grid $c -sticky nsew
The RandomInt procedure should be familiar to you by this point, so I’m going to skip yet another description of it. The MakePoint procedure calls RandomInt twice to create a pair of coordinates that define a single point on the canvas, returning that point as a two-element list. The for loop calls MakePoint six times to create a list of coordinates that I pass to the create line command (after exiting the for loop). The resulting “line” is actually five line segments joined, in this case, using -joinstyle round. This style of line joints, shown in Figure 15.13, gives the joints between each line segment a rounded or smooth look. Figure 15.14 uses beveled joints, which look rougher and in most cases appear to be squared off rather than forming a cleanly drawn joint. Figure 15.15 uses the default join type, -joinstyle miter, which creates sharp, fitted joints that look as if they were created by a miter saw (hence the name).


How do you draw a curve? Draw a segmented line, as shown in the previous example, and then apply smoothing. Specify -smooth true if you want to create lines that are smoothed instead of having pronounced angles at each joint between line segments. Increasing the number of points on the curve results in a smoother curve. To do so, specify -splinesteps num, which causes each curve to be approximated using num line segments. The next script illustrates using the -smooth and -splinesteps attributes:
proc RandomInt {min max} {
    return [expr int($min + (rand() * ($max - $min + 1)))]
}

proc MakePoint {} {
    set x [RandomInt 0 639]
    set y [RandomInt 0 479]
    return [list $x $y]
}

proc Smooth {c line num} {
    if {$num == 0} {
        $c itemconfigure $line -smooth false
    } else {
        $c itemconfigure $line -smooth true -splinesteps $num
    }
}

for {set i 0} {$i < 20} {incr i} {
    lappend coords [MakePoint]
}

set c [canvas .c -width 640 -height 480 -bg "white"]
set f [frame .f -width 640 -bg "white"]
set ln [$c create line [join $coords] -width 3]

set b0 [button $f.b0 -width 10 -text "0 Splines"
    -command "Smooth $c $ln 0"]
set b2 [button $f.b2 -width 10 -text "2 Splines"
    -command "Smooth $c $ln 2"]
set b3 [button $f.b3 -width 10 -text "3 Splines"
    -command "Smooth $c $ln 3"]
set b10 [button $f.b10 -width 10 -text "10 Splines"
    -command "Smooth $c $ln 10"]
set b50 [button $f.b50 -width 10 -text "50 Splines"
    -command "Smooth $c $ln 50"]
set b100 [button $f.b100 -width 10 -text "100 Splines"
    -command "Smooth $c $ln 100"]

grid $c -sticky nsew -columnspan 4
grid $f -sticky nsew -columnspan 4
grid $b2 $b3 $b10 $b50 $b100 -pady 10 -padx 10
When you initially start this script, you will see a randomly generated collection of joined line segments. There are five buttons at the bottom of the window that apply smoothing to the generated line, using two, three, ten, 50, and 100 splines. A sixth button removes all smoothing, reverting the line to its original, unsmoothed state.
The RandomInt and MakePoint procedures are the same as they were in the previous section. The Smooth procedure smoothes the line displayed in the window. It accepts three arguments: the canvas widget and line object ($c and $line, respectively) on which to operate, and an integer value, $num, that specifies how many splines to use for smoothing the line. If $num is 0, I disable smoothing completely by setting $line’s -smooth attribute to false. This causes the line to revert to its original, unsmoothed configuration. Otherwise, I set -smooth true and pass $num to the -splinesteps attribute.
As in lines.tcl earlier, I use a for loop to generate a number of X and Y coordinate values to use when creating the line. In this script, I wanted a complex line, so I generated 20 points. Next, I define a canvas widget, a frame widget to contain the smoothing buttons, and the line itself, passing the $coords list I populated in the for loop. After I create the six buttons to invoke the Smooth procedure, I display the widgets using the grid and the script is ready to go.
Figures 15.16–15.21 show each smoothing option applied to the same figure.

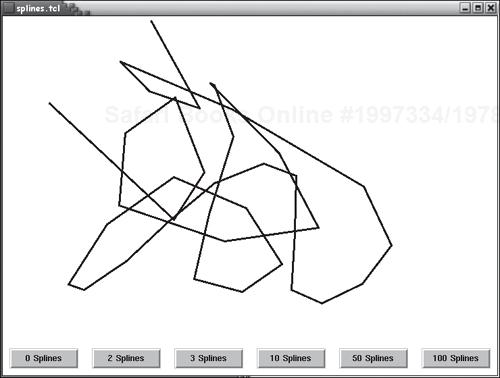

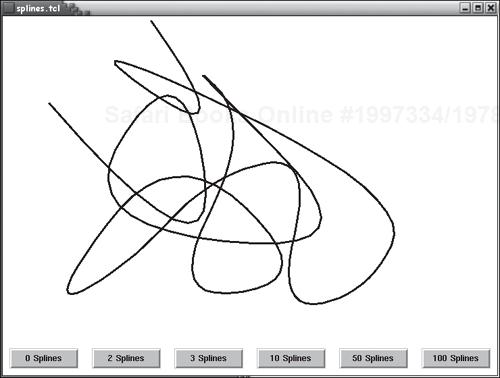


As you can see from these six figures, the sweet spot for smoothing a line, or at least the line in this program, is somewhere between three and ten points.
The oval canvas object is defined just like the arc object, by specifying two sets of coordinates that create a bounding box. If the bounding box is square, the resulting oval will be circular; otherwise, you wind up with a non-circular ovoid shape.
Use the following command to create oval objects:
$c create oval coords ?attr ...?
$c refers to the canvas widget on which the oval object is being drawn. The coords arguments consist of two (x,y) coordinates that define the oval’s bounding box. As usual, attr specifies any attributes you want applied to the object. Note that if coords defines a square bounding box, the resulting oval will be circular.
The oval object lacks object-specific attributes, but does support the common object attributes listed in Table 15.3 earlier in the chapter. Most of the time, you will want to set either the color of the oval’s interior, its outline, or both. The following script, oval.tcl in this chapter’s code directory, illustrates several ovals:
set c [canvas .c -width 240 -height 100 -bg "white"]

$c create oval 10 10 90 90 -width 5 -fill "sky blue" -outline "dark blue"
$c create oval 110 10 140 90 -width 5 -fill "chartreuse" -outline "dark green"
$c create oval 150 30 230 70 -width 5 -fill "yellow" -outline "orange"

grid $c -sticky nsew
This is a pretty simple script, drawing three ovals. The first is a sky blue circle with a dark blue outline. The second is a vertically elongated chartreuse oval with a dark outline. The third is a horizontally stretched oval with a yellow background and an orange foreground. Figure 15.22 shows the resulting window.

The canvas widget’s polygon object is just what the name implies, a polygon made up of an arbitrary number of line segments. Like the line object, the resulting shape can be smoothed. Use the following command to create polygon objects:
$c create polygon coords ?attr ...?
$c refers to the canvas widget on which the polygon object is being drawn. The coords argument is a list of at least three (x,y) coordinates that define line segments, joined at their endpoints to form the vertexes of the closed shape. Also like the line object, you can specify a particular join style for the vertexes, and, if you want a curved polygon rather than a linear one, you can use the -smooth and -splinesteps attributes to apply a smoothing algorithm. In addition to the common canvas object attributes listed in Table 15.3, the polygon object supports the object-specific attributes shown in Table 15.9.
Table 15.9. Polygon Object Attributes
Attribute | Description |
|---|---|
| Specifies how to draw line joints, where |
| Specifies the algorithm used to smooth the line; used with |
| Specifies the number of line segments used to smooth a curve; used with |
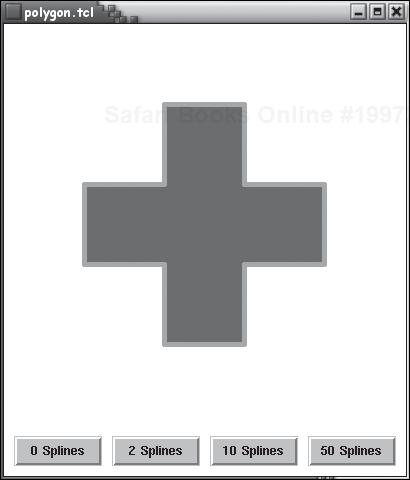
The following script, polygon.tcl in this chapter’s code directory, shows you how to program the polygon object:
proc Smooth {c line num} {
    if {$num == 0} {
        $c itemconfigure $line -smooth false
    } else {
        $c itemconfigure $line -smooth true -splinesteps $num
    }
}

set c [canvas .c -width 400 -height 400 -bg "white"]
set f [frame .f -width 400 -bg "white"]

set x 80
set y 80
set coords {160 80 240 80 240 160 320 160 320 240 240 240
    240 320 160 320 160 240 80 240 80 160 160 160}
set poly [$c create polygon $coords -width 5
    -fill "blue violet" -outline violet]

set b0 [button $f.b0 -width 8 -text "0 Splines"
    -command "Smooth $c $poly 0"]
set b2 [button $f.b2 -width 8 -text "2 Splines"
    -command "Smooth $c $poly 2"]
set b10 [button $f.b10 -width 8 -text "10 Splines"
    -command "Smooth $c $poly 10"]
set b50 [button $f.b50 -width 8 -text "50 Splines"
    -command "Smooth $c $poly 50"]

grid $c -sticky nsew -columnspan 4
grid $f -sticky nsew -columnspan 4
grid $b0 $b2 $b10 $b50 -pady 10 -padx 5
This script is very similar to the splines.tcl script presented earlier in the chapter. The most significant difference is that instead of generating the points randomly, I specify them manually:
set coords {160 80 240 80 240 160 320 160 320 240 240 240
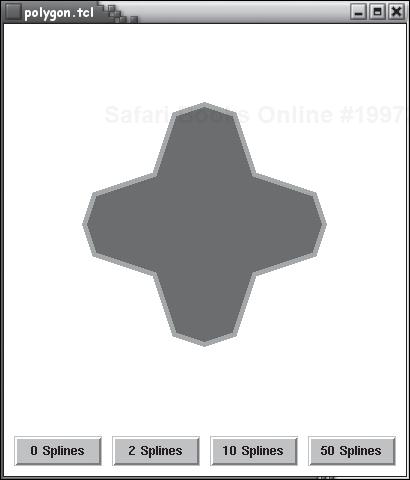
240 320 160 320 160 240 80 240 80 160 160 160}Starting from the upper left-hand corner of the polygon I want to draw (see Figure 15.23), I define each vertex in order, moving clockwise around the figure until I get to the last point. Defining them in order ensures that the line segments are connected properly. The smoothing buttons include a different mix of smoothing options, but, other than the different canvas object and the smaller set of smoothing buttons, not much is new here. Figures 15.23–15.26 show the original polygon and the results after applying 2, 10, and 50 splines for smoothing.


The canvas widget’s text object displays a string of characters, arranged in one or more lines, on the canvas. Like the other canvas objects you have seen in this chapter, the text object supports a variety of formatting operations. In addition, unlike the other canvas objects, the text object also allows you to use text insertion and manipulation commands such as insert, index, select, icursor, and so forth.
To create a text object, use the following command:
$c create text x y ?attr ...?
$c refers to the canvas widget on which the text object is being drawn. The arguments x and y define an anchor point on which the text is centered (using the -anchor attribute described in Table 15.10). As usual, you can specify one or more attributes to further define the text object being created. The text object supports the object-specific attributes listed in Table 15.10.
Table 15.10. Text Object Attributes
Attribute | Description |
|---|---|
| Positions the bitmap relative to its positioning point, defaulting to |
| Specifies the font to use for the text item; defaults to a system-dependent font. |
| Specifies text justification, which must be one of |
| Specifies the text to display. |
| Specifies the maximum line length; defaults to zero. |
The anchor point defines a point on the canvas relative to which the text object is positioned. The default setting is -attribute center, meaning that the text object will be centered on the anchor point. Other values include any one of the compass points n, ne, e, se, s, sw, w, and nw (for north, northeast, east, southeast, south, southwest, west, and northwest, respectively).
The font used the platform-specific font. If you want to specify a particular font, use the -font name attribute, where name is a valid font name for the host platform. The -justify option specifies how to justify the text and is meaningful only if the text spans multiple lines.
The -text string attribute defines the initial text contents of the text object. Newline characters embedded in string create line breaks in the text. At runtime, of course, you can modify the contents of the text object using the insert and delete commands.
To define the width of the text, use the -width attribute (no surprise there). If -width is zero (the default setting), text is broken into lines at newline characters. Otherwise, the text will be broken at length. In this case, lines that exceed length are broken immediately before the space character closest to length.
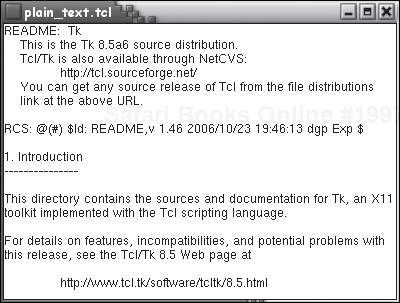
The following script, plain_text.tcl, shows a simple example of the canvas widget’s text object:
proc ReadFile {f} {
    set fileId [open $f r]
    set s [read $fileId]
    close $fileId
    return $s
}

set c [canvas .c -bg "white"]
set t [$c create text 0 0 -anchor nw]
$c insert $t end [ReadFile "README"]

grid $c -sticky nsew
grid rowconfigure . 0 -weight 1
grid columnconfigure . 0 -weight 1
You’ve seen almost all of this code before. The only new elements are the two lines that create and populate the text widget:
set t [$c create text 0 0 -anchor nw]
$c insert $t end [ReadFile "README"]
The first line creates a text object, $t, with an anchor point of (0,0) and anchor position of nw. The result is a text object nailed to the upper left-hand corner of the canvas. The second line invokes the ReadFile procedure on the now-familiar README file and inserts the returned string at the “end” of the text object. Insofar as the text object is initially empty, the “end” is also the beginning or top. To display the window, I pin the canvas widget to all four sides of its parent window (grid $c -sticky nsew) and then use the rowconfigure and columnconfigure commands to set the -weight attribute to 1. The rationale is to allow the canvas widget (and its contents) to resize as the parent window resizes. Figure 15.27 shows the resulting window.
In my opinion, puzzle.tcl is the most complicated script I’ve presented in this book. It uses language features discussed throughout the book. Obviously, I needed to use the canvas widget and other GUI elements such as buttons, frames, and images. It also contains a number of procedures, simple mathematics, list manipulation, looping, conditionals, and event bindings. In short, puzzle.tcl is a complete Tcl and Tk program.
#!/usr/bin/wish
# puzzle.tcl
# Create a puzzle out of an image

# Block 1
# Initialize the game board
proc InitGame {c img} {
    # Disable the Start button
    uplevel {$f.bstart configure -state disabled}
    # Create puzzle pieces
    set tiles [SplitImage $c $img]
    # Mix up the puzzle pieces
    JumbleImage $c $img $tiles
}

# Block 2
# Draw a 3x4 grid on the image
proc DrawGrid {c img} {
    set incrx 140
    set incry 150
    # Draw horiz lines
    for {set y 0} {$y < 600} {incr y $incry} {
$c create line 0 $y 419 $y -width 2 -fill yellow
    }
    # Draw vert lines
    for {set x 0} {$x < 420} {incr x $incrx} {
        $c create line $x 0 $x 599 -width 2 -fill yellow
    }
}

# Block 3
# Split the image into 12 tiles
proc SplitImage {c img} {
    # Create 12 tiles
    for {set i 0} {$i < 12} {incr i} {
        lappend tiles [image create photo t$i]
    }

    # Populate the tiles
    set sx 0
    set sy 0
    set ex 140
    set ey 150
    set incrx 140
    set incry 150
    for {set t 1} {$t <= 12} {incr t} {
        [lindex $tiles [expr $t - 1]] copy $img -from $sx $sy $ex $ey
        if {$t % 3 != 0} {
            set sx $ex
            set ex [expr $sx + $incrx]
        } else {
            set sx 0
            set ex $incrx
            set sy $ey
            set ey [expr $sy + $incry]
        }
    }
    return $tiles
}

# Block 4
# Generate a list of random numbers between 0 and 11
proc Randomize {} {
    set nums [list]
    while {[llength $nums] < 12} {
        set n [expr int((rand() * 12))]
        if {[lsearch -integer $nums $n] == -1} {
            lappend nums $n
        }
    }
    return $nums
}

# Block 5
# Redraw the image in its "puzzle" form
proc JumbleImage {c img parts} {
    # Clear the board
    $img blank

    # Draw the jumbled image
    set sx 0
    set sy 0
    set ex 140
    set ey 150
    set incrx 140
    set incry 150
    set nums [Randomize]
    for {set t 1} {$t <= 12} {incr t} {
        set i [lindex $nums [expr $t - 1]]
        set tile [lindex $parts $i]
        $img copy $tile -to $sx $sy $ex $ey
        if {$t % 3 != 0} {
            set sx $ex
            set ex [expr $sx + $incrx]
        } else {
            set sx 0
            set ex $incrx
            set sy $ey
            set ey [expr $sy + $incry]
        }
    }
    # Pass the (x,y) coordinates under the cursor to SelectTile
    bind $c <Button-1> [list SelectTile %x %y]
}

# Block 6
# When a tile is selected, add it to the list of selected tiles
proc SelectTile {x y} {
    global selected

    # Map a the (x,y) coordinates to a tile
    if {$x >= 0 && $x < 140 && $y >= 0 && $y < 150} {
        lappend selected 0 0 140 150
    }
    if { $x >= 140 && $x < 280 && $y >= 0 && $y < 150} {
        lappend selected 140 0 280 150
    }
    if {$x >= 280 && $x < 420 && $y >= 0 && $y < 150} {
        lappend selected 280 0 420 150
    }
    if {$x >= 0 && $x < 140 && $y >= 150 && $y < 300} {
        lappend selected 0 150 140 300
    }
    if {$x >= 140 && $x < 280 && $y >= 150 && $y < 300} {
        lappend selected 140 150 280 300
    }
    if {$x >= 280 && $x < 420 && $y >= 150 && $y < 300} {
        lappend selected 280 150 420 300
    }
    if {$x >= 0 && $x < 140 && $y >= 300 && $y < 450} {
        lappend selected 0 300 140 450
    }
    if {$x >= 140 && $x < 280 && $y >= 300 && $y < 450} {
        lappend selected 140 300 280 450
    }
    if {$x >= 280 && $x < 420 && $y >= 300 && $y < 450} {
        lappend selected 280 300 420 450
    }
    if {$x >= 0 && $x < 140 && $y >= 450 && $y < 600} {
        lappend selected 0 450 140 600
    }
    if {$x >= 140 && $x < 280 && $y >= 450 && $y < 600} {
        lappend selected 140 450 280 600
    }
    if {$x >= 280 && $x < 420 && $y >= 450 && $y < 600} {
        lappend selected 280 450 420 600
    }
}

# Swap the tiles
proc SwapTiles {c img} {
    global selected

    image create photo src
    image create photo temp
    set x1 [lindex $selected 0]
    set y1 [lindex $selected 1]
    set x2 [lindex $selected 2]
    set y2 [lindex $selected 3]
    set x3 [lindex $selected 4]
    set y3 [lindex $selected 5]
    set x4 [lindex $selected 6]
    set y4 [lindex $selected 7]

    # Get the image from the first tile
    src copy $img -from $x1 $y1 $x2 $y2

    # Get the image from the second tile
    temp copy $img -from $x3 $y3 $x4 $y4

    # Put the first image in the second one's grid
    $img copy src -to $x3 $y3 $x4 $y4

    # Put the second image in the first one's grid
    $img copy temp -to $x1 $y1 $x2 $y2

    # Clear the list variable
    unset selected
}

# Block 7
# Layout the UI
# Create the image
set img [image create photo -file "gladiola.gif"]
set w [image width $img]
set h [image height $img]

# Canvas to display the puzzle
set c [canvas .c -width $w -height $h]

# Image object to contain the puzzle
set puzzle [$c create image 0 0 -image $img -anchor nw]
DrawGrid $c $img

# Buttons to control the game
set f [frame .fbuttons -width $w -height 100]
set bStart [button $f.bstart -text "Start"
    -command [list InitGame $c $img]]
set selected {}
set bSwap [button $f.bswap -text "Swap" -command [list SwapTiles $c $img]]
set bExit [button $f.bexit -text "Exit" -command exit]

# Display the widgets
grid $c -sticky nsew -pady {10 0} -padx 10
grid $f -sticky nsew
grid $bStart $bSwap $bExit -pady 10 -padx 5The InitGame procedure in Block 1 is invoked when the player clicks the Start button. It initializes the game board after it has been created. InitGame takes two arguments: the canvas widget on which to draw ($c) and the image object to use. I disable the Start button to prevent accidentally redrawing the board in mid-game. Next, I call the SplitImage procedure, using the $c and $img arguments passed in to InitGame. This procedure splits the displayed image into 12 equally-sized tiles that serve as the puzzle pieces. Next, I call the JumbleImage procedure to clear the starting board and redraw the image in its mixed up form. The DrawGrid block 2 procedure just draws a series of yellow horizontal and vertical lines on the canvas. I do this mostly as a visual aid to the player.
Block 3 defines the SplitImage procedure, which takes the same canvas and image arguments described earlier. First, I create 12 empty image items and append them to the list variable $tiles. Next, I iterate over the image, moving from the upper left-hand corner to the lower right-hand corner. In each iteration of the for loop, I copy a 140-pixel by 150-pixel region of the “parent” or main image into one of the tiles. The variable declarations and the if-else statement exist for what I refer to as bookkeeping purposes. They help me keep track of the part of the image that I need to copy. After creating the tiles, I return the completed list to the calling procedure.
The Randomize procedure (Block 4) is a helper function. Its purpose is to generate a randomly ordered list of numbers between 0 and 11, inclusive. I use this random ordering to redraw the image in its puzzle, or mixed up form.
In Block 5, I define the JumbleImage procedure. In addition to the standard canvas and image arguments ($c and $img, respectively), JumbleImage accepts a third argument, parts, which is the list of tiles created by the SplitImage procedure I defined earlier. JumbleImage uses the same bookkeeping logic as SplitImage to maintain the X- and Y-coordinate values. There are some key differences, though. The code in question is reproduced below:
set nums [Randomize]
for {set t 1} {$t <= 12} {incr t} {
    set i [lindex $nums [expr $t - 1]]
    set tile [lindex $parts $i]
    $img copy $tile -to $sx $sy $ex $ey
First, I call Randomize to generate a randomly ordered list of numbers between zero and 11, inclusive. After I initialize the for loop, I extract one of the random numbers from the list. Then I use the number to index into the list of tiles and retrieve the corresponding image from the $tiles array. Then I copy that image to the specified region of the canvas object. In this way, I rearrange the picture to create the puzzle the player has to solve. Finally, I bind a single click of mouse button 1 (the left mouse button) to the procedure SelectTile, passing the object ID of the tile that was clicked.
The two procedures in Block 6 handle the mouse event and arrange for the selected images to be swapped. SelectTile takes the name of a tile as its sole argument and appends that name, which is actually the tile’s object ID, and appends it to the global list variable $selected. The SwapTiles procedure, in turn, swaps the images displayed in the two tiles.
The balance of the code (Block 7) defines and displays the game board. I create the source image (rather, the source image object) first and then use its width and height to define the canvas widget’s width and height. Next, I anchor the canvas widget to the parent window’s upper left-hand corner and then call DrawGrid to superimpose the grid lines over the image.
I use a frame widget as a container for the various button widgets that control the game. The Start button invokes the InitGame procedure described earlier. Similarly, I wire the SwapTiles procedure to the Swap button. No application is complete without an Exit button, either, so I provide that as a convenience for the player. Finally, I display the widgets, and the game is ready to play.
Here are some exercises you can try to practice what you learned in this chapter:
15.1 Modify the binding for mouse button 1 to give the player visual feedback that the selected tile is, in fact, selected.
15.2 Modify the code in Block 6 to prevent the user from selecting more than two tiles.