

Troubleshooting
In this chapter, we discuss the methods that are used to troubleshoot IBM FileNet P8 Content Manager issues. P8 Content Manager implementations range from small departmental systems running one application using one or two servers to large enterprise systems running many applications on many servers.
We discuss the following topics:
•Troubleshooting installation or upgrade
•Troubleshooting during application development
•Troubleshooting production issues
12.1 A typical P8 Content Manager system
Before we focus on problem isolation, let us review what a typical P8 Content Manager system consists of and how it works. Figure 12-1 shows a basic P8 Content Manager system.

Figure 12-1 Pictorial view of a basic P8 Content Manager system
The basic P8 Content Manager system uses the following components:
•Client web browser or a desktop, thick client
•Front-end Java Platform, Enterprise Edition (Java EE) application server
Hosts the front-end application, such as IBM Content Navigator, FileNet Workplace XT, or a custom application.
•Middle-tier Java EE application server
Hosts the Content Platform Engine instances.
•Lightweight Directory Access Protocol (LDAP) directory service for security
•Storage system for document content
•Database for storing metadata and content
In the basic P8 Content Manager environment, the user points their browser or desktop to the chosen front-end application running on a Java EE application server:
1. The user receives a logon window and enters their user ID and password.
2. The credentials are validated against the directory server.
3. The Content Platform Engine caches user and group membership information.
4. The chosen front-end GUI then displays the appropriate artifacts to the user.
At this point, the user can view, change, or create new content. The benefit of this architecture is that as your user base or transaction activity grows, you can quickly and easily increase the resources allocated to the environment. You can scale vertically by adding more CPU and memory to your existing servers, or horizontally by adding more servers. This approach allows your P8 Content Manager system to grow to support hundreds of applications with thousands of concurrent users working on an enormous amount of content. The N-Tier Java EE architecture (server/client) enables P8 Content Manager to scale from small systems to large enterprise systems with minimal effort.
You can simplify the logon sequence by looking at it from a client/server perspective. The components used are essentially several client and several server components working together:
•The user’s web browser is a client to the chosen front-end GUI.
•The chosen front-end GUI is a client to both the LDAP and Content Platform Engine.
•The Content Platform Engine is a client to the database and file storage areas.
•The Java EE application server is the server on which the chosen GUI application and Content Platform Engine run.
This perspective might be oversimplified, but as you approach a problem, think about it in client/server terms. Finding the failing client/server section enables you to quickly rule out what is working and focus on the component that is not working.
In this chapter, we look at common problems and different types of troubleshooting by breaking them down into a client/server approach.
12.2 Different types of troubleshooting
During the implementation and administration of a P8 Content Manager solution, situations arise that require troubleshooting. We list the main categories of troubleshooting:
•Troubleshooting installation and upgrade issues
Initial, basic problems that occur during the installation or upgrade of a P8 Content Manager system.
•Troubleshooting during application development or with how the code interacts with the P8 Content Manager configuration
Problems with the functionality of custom code.
•Troubleshooting performance issues
Response times are less than desired, or the system does not scale for the expected user and workload.
Problems that occur in the production environment and must be investigated and resolved with minimal impact to the clients.
12.3 Creating customized best practice guides
When discussing techniques and tools for troubleshooting and problem determination, typically most of the discussion is about what to do after a problem has been discovered. Ideally, however, the prudent system administrator or troubleshooter starts thinking about the job long before a problem occurs. Prepare the environment so that troubleshooting can be performed more quickly and effectively if and when problems occur.
One of the first and most important steps in being prepared to troubleshoot issues is to create a customized best practice guide that defines conventions for your environments. The guide preserves thoughts, knowledge, ideas, and information in one place. Start creating the guide during implementation, and continue to update it throughout the lifecycle of the environment. Capture information that you think you will never forget. Despite your best intentions, you will forget all the nuances around why a decision was made, or you might change roles and need to share your knowledge with new staff members.
Being consistent within an environment and across different environments reduces issues and makes troubleshooting easier.
We summarize many of the recommendations to cover in the customized best practice guides. But the list is neither definitive nor absolute. Each customer and every solution have their own special requirements. Use the list to get started and then continue to expand what you capture based on the specifics of your environment.
At a minimum, cover the following points in your best practice guide:
•A system architecture diagram for each environment, which is updated regularly. The diagram shows the physical layout and identifies what software is installed on each component.
•List software packages in use and the release level, including the patch level of each package, including any test fixes. The information covers items, such as the operating system, database, application server, Content Platform Engine, and IBM Content Navigator.
•Any dependencies in the environment, for example:
– Startup and shutdown of the components.
– Third-party applications that rely on P8 Content Manager or vice versa.
– Data dependencies between the systems. This area is especially important if there are batch processes running for importing or exporting data. If a system stops during batch processing, you want to minimize any data loss.
•Guidelines for the following tasks:
– Application development, including conventions, logging, multithreading, and designing for growth (for example, how to use multiple object stores, design for farming requirements, and if needed, design considerations for high availability)
– Software installation, for example, user accounts, installation paths, fix packs
– Application server configuration, including details about parameters that are using non-default values, or additional Java virtual machine (JVM) parameters
– Database creation and configuration, including permissions, naming conventions, and the use of indexes
– LDAP user and group naming convention creation
– Monitoring configuration, for example, adding counters for use with IBM System Dashboard for Enterprise Content Management or IBM ECM System Monitor
•Content Platform Engine configuration:
– Names of the databases used for the global configuration database (GCD) and object stores
– LDAP server search filters
– Accounts used for GCD and object store administration
– Object store naming conventions for document classes, property templates and folder structures, storage policy conventions, and security requirements
– Workflow system information, including security requirements, user queues, exposed fields, and the location of workflow definitions
•Housekeeping tasks:
– Cleanup of log files: When backups need to occur, where old files are kept, and naming conventions
– Database maintenance jobs, such as performance analysis, implementation of new indexes, and table space maintenance
•Regularly scheduled maintenance so that the environment remains current:
– Plan for the installation of fix packs both for P8 Content Manager components and third-party software
– Plan for upgrading to newer software releases
– Plan for upgrading to new infrastructure levels, such as new operating systems, application servers, and database server software
– Plan for upgrading to new hardware
•Log of problems and resolutions: Document issues that occurred and how they were resolved
•Add customized worksheets that can be used as reference documents when performing installations and upgrades
A customized best practice guide is a living document and must be updated all the time to track changes in the environment. Do not just write it once and then put it on the shelf. Keep it current, and make your organization aware of it.
A good reference resource is the following IBM developerWorks article that describes actions that you can take with your production environment now for a quicker and more effective way of troubleshooting:
12.4 General troubleshooting
The IBM FileNet P8 Information Center contains the documentation for the P8 product family. It is updated periodically, so always check for new information when you are troubleshooting:
http://pic.dhe.ibm.com/infocenter/p8docs/v5r2m0/topic/com.ibm.ecm.common.ic.doc/troubleshoot_main.htm
|
Recommendations: When an error occurs for the first time, always make it a high priority to analyze the issue, determine the root cause, and take the appropriate mitigating actions. Following this best practice minimizes the likelihood of the problem recurring and additional downtime.
|
Ideally, you will have automated system monitoring in place. Automated monitoring helps you quickly identify major component problems:
•IBM ECM System Monitor (see 10.4.3, “IBM ECM System Monitor” on page 334) allows you to quickly identify a major component failure, possibly before your first user calls. The software includes a knowledge base with potential problem solutions so corrective action can occur quickly.
•Dashboard (see “Dashboard” on page 328) can also help identify problem areas. You must manually check logs and functionality, because the Dashboard is meant primarily as a tool for gathering performance data.
|
Note: There is a dedicated dashboard provided for IBM Content Collector for Email.
|
•Third-party standard monitoring products, such as IBM Tivoli, HP OpenView, and Microsoft System Center Operations Manager (SCOM). These products support monitoring items, such as CPU, memory, network, and storage usage.
Automated monitoring tools can greatly reduce troubleshooting time, because they alert you to major component failures and problems, such as a disk or file system that is full.
Verify that each component is working as expected, as well as any infrastructure components, such as the database, application server, LDAP server, and network components.
Applications and tools that ship with P8 Content Manager, such as IBM Administration Console for Content Platform Engine (ACCE), IBM FileNet Enterprise Manager, IBM Content Navigator, and FileNet Workplace XT, are also helpful for problem determination. They can be used to perform similar actions, such as adding folders, creating documents, and viewing content. If none of the applications can perform a certain function, the problem you are trying to troubleshoot is likely caused by an infrastructure component, such as the network, or the Content Platform Engine server. However, if these applications function correctly but a custom application does not, the likely culprit is the custom application.
If an issue arises just after a component in the environment is updated, start the troubleshooting by ensuring all the component software levels are compatible with P8 Content Manager and with each other.
For P8 Content Manager compatibility requirements, see the following documents:
•Hardware and software requirements for the P8 suite of products:
•FileNet P8 Fix Pack Compatibility Matrices:
•MustGather: Read first for the Content Platform Engine:
The “MustGather” documents the information that the IBM Support team needs to start troubleshooting issues. Use this information as a starting point for your own troubleshooting efforts. If your individual troubleshooting efforts are unsuccessful, attach the information identified in the “MustGather” documents to the problem management record (PMR) or trouble ticket.
12.5 Troubleshooting the installation or upgrade
When implementing a new P8 Content Manager system, a need to troubleshoot issues can arise, for example:
•Underlying components might be configured in an unexpected fashion
•Network connectivity
•Lack of permissions to required resources
•Unexpected interaction with third-party applications or tools, for example, load balancers
Often, the issues arise because the guidance provided in the following documentation was not followed or validated prior to starting the installation:
•Planning sections of the P8 Information Center
•Third-party software-level requirements documented in the P8 Hardware and Software Requirements guide
•Information in the readme files or release notes
Avoiding common issues
To avoid the most common issues, perform the following tasks:
•Check the prerequisites of each software package and ensure that these requirements are met.
•Read the release notes of each software package carefully and ensure that you follow the notes.
•Check that the appropriate fix packs are installed in your environment.
•Install each software component one after the other in the following order and validate that each component is working as expected before moving on to the next component:
– Ports
Verify that the ports needed by the P8 Content Manager components are open (firewall) and not in use by other applications. A list of the required ports is available at this website:
– Directory service
Typically, this directory service is the Corporate directory service, but you must ensure that the directory service is configured in a way that is compatible with the P8 Content Manager environment. Ensure that you have identified the users and groups to use during the installation process, as well as the user and group search filters that identify the users who can access the P8 Content Manager system.
For more information about directory service requirements, see the following link:
– Operating system
Refer to the P8 Hardware and Software guide to determine the supported operating systems and operating system prerequisites.
– Database
Although new database servers can be installed specifically for use with the P8 Content Manager software, you can also use existing database servers if they meet the documented prerequisites. In addition, you need to create the databases and tablespaces required by the P8 components that will be installed. Some components, such as the Content Platform Engine, have a minimum requirement of one database for the GCD and one for an object store and a workflow system. However, components might require more databases depending on your specific use cases.
– Application server
Assuming an application server meets the documented prerequisite requirements and has adequate capacity, the P8 Content Manager components can be deployed to existing application servers. When deciding to use existing application servers or to install new application servers, consider the expected load on the system and the ability to accommodate more load than initially expected.
– Content Platform Engine
– FileNet Workplace XT
Required for managing workflow systems.
– IBM Content Navigator
•Check each of the following components to ensure that they are functioning correctly:
– Network components:
• Switches and load balancers are configured and working as expected.
• The appropriate ports are open. For the ports used by P8 components, see the following link:
– Operating system:
• No error messages in the system logs after booting the system.
• Network performance between components meets expectations.
• Domain name server (DNS) lookup and reverse lookup between the servers works.
|
Recommendations: Avoid using IP addresses as references to P8 components. Instead, use DNS server names whenever possible to make it easier to replace or add servers to the environment.
|
– Database:
• No error messages when starting the database server or any of the databases.
• No error messages logged by any databases.
• Databases can be accessed via telnet on the Java database. Connectivity (JDBC) port from other servers
– Directory service:
• Directory service starts without an issue.
This is only a concern if you are not using the Corporate directory service.
• No error messages logged by the directory service during any login attempts.
• Directory server can be reached by telnet or by using an LDAP client on the defined port.
For information about the ports used for directory service operations, see the following link:
– Application server:
• Application server starts without an issue, and no errors are reported by the application server software.
• Application server administrative login works.
•Check integration between software components:
– Content Platform Engine:
• The installation and configuration steps completed successfully.
• Ear or war startup is successful.
• No errors are reported in the application server logs or the Content Platform Engine installation log.
• Ping pages are reachable: Content Platform Engine System Health page (see Figure 12-2), Content Platform Engine Ping Page (see Figure 12-3), and workflow system-related Ping Page (see Figure 12-4).
– Access the IBM Administration Console for Content Platform Engine (ACCE) and check the connections:
• LDAP connection to the directory server
Configuration was done by the Configuration Manager during the Content Platform Engine configuration. If the application server was already configured for LDAP because of other hosted applications, ensure that the settings required by all applications are compatible.
• All JDBC connections (both XA and non-XA) can connect to the expected databases.
Configuration was done by Configuration Manager during the Content Platform Engine configuration. This test ensures that the network routing is working correctly between the application server and any database server.
– Perform a quick check to validate the proper functionality of Content Platform Engine
Use ACCE to create an object store, add a folder, and then add a document.
– FileNet Workplace XT and IBM Content Navigator:
• Deployment was successful and no errors were reported.
• Ear or war startup is successful.
• No errors are reported in the application server logs, the FileNet Workplace XT installation log, or the IBM Content Navigator installation log.
• Login page displays.
• Login is successful.
• Manual configuration steps, such as defining security for accessing the FileNet Workplace XT administration tools, setting the site preferences, and check whether initiating the Process Configuration Console for initializing regions is successful.
• Navigate to the folder and document that were created by using ACCE and open the document.
• Add additional documents and then check that they can be opened by using ACCE.
If you follow this best practice and issues occur, start Root Cause Analysis (RCA) immediately. The localization of the root cause is much easier by using this incremental approach as opposed to installing a whole system and verifying the system afterward.
For additional installation and upgrade troubleshooting information, see this website:
Quick checks via server ping and health pages
Use the server ping and health pages to verify whether the Content Platform Engine, object stores, and workflow systems are online. The pages indicate whether a server is online and provide details about the software versions that are installed. IBM Support asks for this information if you open a problem management record (PMR).
To check whether the Content Platform Engine server is running, use its ping page by pointing your browser to this URL:
http://<Content Platform Engine server>:<port>/FileNet/Engine
This URL is an example:
http://hqdemo1:9080/FileNet/Engine
Your browser opens a window similar to Figure 12-2.
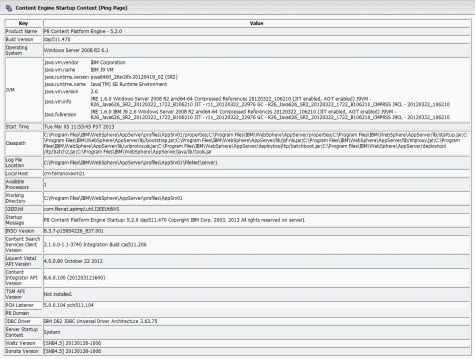
Figure 12-2 Content Platform Engine ping page
After you confirm that the Content Platform Engine is running, use the Content Platform Engine System Health page to check the content-related items in the environment:
http://<Content Platform Engine server>:<port>/P8CE/Health
This URL is an example:
http://hqdemo1:9080/P8CE/Health
If your Content Platform Engine is running, you see a window similar to Figure 12-3.
Figure 12-3 Content Platform Engine System Health page
To check on the workflow system-related components, use the following ping page:
http://<Content Platform Engine server>:<port>/peengine/IOR/ping
This URL is an example:
http://hqdemo1:9080/peengine/IOR/ping
The window is similar to Figure 12-4.
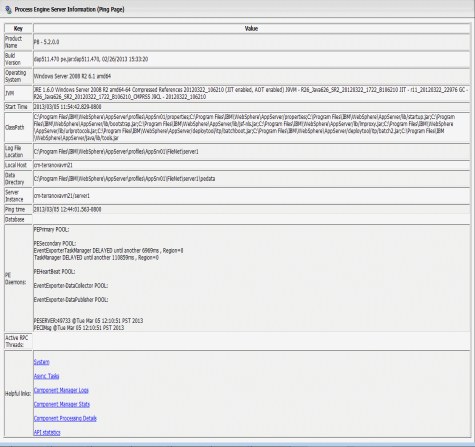
Figure 12-4 Workflow system-related ping page
|
Note: For farmed environments, verify both ways:
•Verify the Content Platform Engine access through the load balancer:
http://ce_load_balancer:<port>/FileNet/Engine
The ce_load_balancer is the name of the load balancer, and port is the port used to access Content Platform Engine on the load balancer.
•Verify the Content Platform Engine access directly to each farmed Content Platform Engine instance, because the ping pages as well as the health page only display the status of the accessed instance and not the whole farm.
|
12.6 Troubleshooting during application development
Application development always needs a form of troubleshooting because of errors in the developed solution or a misuse of the P8 Content Manager APIs. The best practice is to define a developer style guide. This style guide covers the following topics:
•Which logging framework to use.
•How to configure the logs and traces.
•The log format.
•Identifying the details and information to log, which log file to use, and what gets logged at the informational, debug, and error levels.
•It also identifies bad practices, such as logging passwords or embedding passwords in the code.
With your custom application log or trace file, you have a starting point for troubleshooting. Also, look at any errors in the Content Platform Engine server logs. Make a note of the timestamps associated with the errors. If the error alone is not sufficient for solving the issue, the time stamp of the error message can also help you look for additional information in system and database logs. For this reason, all servers and, if possible, the clients, need to be time synchronized. Use a central Network Time Protocol (NTP) server and Coordinated Universal Time (UTC) for the server components for the time synchronization. Content Platform Engine indicates the time zone that is used in the p8_server_error.log. See Example 12-1.
Example 12-1 Time zone
P8 Content Platform Engine Version: 5.2.0 Build: dap511.470 on rbacalzopc2
All times are local; the time zone is Pacific Standard Time(UTC -08:00)
VirtualServer: rbacalzopc2Node01 ServerInstance: server1
Date (UTC -08:00) Thread Sub Category Sev Message
On the client side, the local time zone is used.
If custom client applications are accessing Content Platform Engine, the session ID of the client needs to also be written into the log and trace files. This information helps to connect the client and server log information, as well as make it easier to follow the application logic.
Additional information about exception and logging concepts is available at these websites:
•http://pic.dhe.ibm.com/infocenter/p8docs/v5r2m0/topic/com.ibm.p8.ce.dev.ce.doc/logging_concepts.htm
12.7 Troubleshooting functional issues
The P8 Content Manager provides logging capabilities for issue tracking, error tracking, and troubleshooting, as well as for auditing and process tracking. Third-party software typically also provides logging capabilities. Next, we describe who, how, and why these logs are essential for troubleshooting functional issues.
|
Recommendations: When enabling trace logging for troubleshooting, only enable the subsystems that are necessary to diagnose the issue. Unconditionally enabling all levels of all subsystems negative affects the performance and might rapidly fill up the file system.
|
12.7.1 Review the logs
During troubleshooting, check the relevant log files for errors with an unknown source.
The best way to troubleshoot an issue is to start at the bottom of the Content Platform Engine log files to look for error messages. Because there might be more than one type of error or multiple occurrences of the same message, keep working up through the file until you find the first error. If you find any error messages, review the information provided in the P8 Information Center under Troubleshooting and support → IBM FileNet P8 messages.
|
Tip: Use your favorite Internet search engine to look for additional information about any errors.
|
If an object Globally Unique Identifier (GUID) is provided in the error message, use ACCE or FileNet Enterprise Manager to determine which object is referenced by the GUID because this often provides additional clues about the problem.
If the information provided in the Content Platform Engine logs is not enough to identify and resolve the issue, the information points you to the next logical step in your troubleshooting efforts. Look at these files next:
•Other application logs
•Application server logs
•Database logs
•Operating system logs
Application logs
Java applications do not log error messages; they log exceptions. Java messages and exceptions are written to message log files. P8 Content Manager has two major engine components: IBM Content Navigator or FileNet Workplace XT as the front end, and the Content Platform Engine as the back end. Content Platform Engine writes four message logs:
•p8_server_error.log
•p8_server_trace.log
•pesvr_system.log
•pesvr_trace.log
For IBM WebSphere, by default, the files are in this directory:
AppServerprofilesdefaultFileNet<serverInstanceName>
For BEA WebLogic, the default location is this directory:
eauser_projectsdomainsmydomainFileNet<serverInstanceName>
If the information in the logs does not provide enough information, it might be appropriate to enable trace logging for the relevant components of the Content Platform Engine.
Application server logs
Check the standard Java EE application server message logs for new, unknown error entries. The Java EE application server message logs for IBM WebSphere or Oracle WebLogic are in the following default directories:
•For IBM WebSphere, the SystemErr.log and SystemOut.log files are in this directory:
AppServerprofilesdefaultlogs<serverInstanceName>
•For Oracle WebLogic, the myserver.log file is in this directory:
eauser_projectsdomainsmydomain<myserver>
where <myserver> is the web server name
If there are errors that seem related to the functional issues you are debugging, resolve the issues, recycle the environment, clear the logs, and then retest the P8 Content Manager application to see whether the problem is resolved.
Storage device logs
Network-attached storage (NAS) and storage area network (SAN) devices used for file and fixed storage staging areas typically have their own management consoles from which you can view system logs. Likewise, all the fixed content devices supported by Content Platform Engine have their own administration tools that can be used to diagnose the device and view system logs. Look for any warnings or errors on the storage device log, such as “out of space”, “maximum objects exceeded”, or “too many sessions”, that might correlate to the error received in the Content Platform Engine logs.
If there are errors that seem related to the functional issues you are debugging, resolve the issues, recycle the environment, clear the logs, and then retest the P8 Content Manager application to see whether the problem is resolved.
Database logs
If an object store cannot be accessed, response time is slow, or there are poorly performing queries, the next step is to ensure that the database is running as expected. Work with the database administrator to ensure that the databases are running as expected. Common issues that can occur include space allocation issues for the temp, database, and log files, poor query plans resulting in slow searches, and an insufficient number of available database sessions. Also, check for permission errors and that all the database prerequisites documented in the planning and prepare section of the P8 Information Center were implemented correctly:
Performance-related issues can often be mitigated by reorganizing tables and reclaiming free space, adding indexes, or reworking searches so that they use indexes that exist.
System logs
Check the relevant system logs. If you find errors, ensure that the errors relate to the problem you are investigating. For example, there might be errors that relate to outdated virus files or an improperly configured mail server that are not related to the issue you are trying to debug.
If there are errors that seem related to the functional issues you are debugging, resolve the issues and then retest the P8 Content Manager application to see whether the problem is resolved.
Enable Trace Logging
To enable trace logging in Content Platform Engine, access the ACCE to check “Enable trace logging” on the Trace Subsystem tab. Then, select and configure the relevant subsystems.
When the trace control configuration is inherited from another object, the Trace Flags list box is disabled.
Table 12-1 lists all the subsystems, and the associated abbreviation that appears in the trace log file along with a short description of what is traced.
Table 12-1 List of traceable subsystems
|
Property
|
Abbreviation
|
Logs information relative to this area
|
|
API
|
API
|
Content Java API operations.
Logging is supported only for the Content Java API, not the Content .NET API.
|
|
Asynchronous Processing
|
ASYN
|
The processing portion of an asynchronous event, including document classification and security propagation.
|
|
Audit Disposition
|
AUDT
|
Requests to audit information in the object store.
|
|
CBR
|
CBR
|
Content-based retrieval (CBR), including indexing, searching, and so on.
|
|
CFS Daemon
|
CFSD
|
Content Federation Services (CFS) for Image Services import agent.
|
|
CFS Import Agent
|
CFSI
|
Content Federation Services for IBM Content Integrator import agent.
|
|
Code Module
|
CMOD
|
Code module functionality. Code modules are a special subclass of document class that contains one or more Java components.
|
|
Content Cache
|
CCHE
|
Content caching operations that cache document content in the file system on the local server.
|
|
Content Storage
|
CSTG
|
Content storage operations.
|
|
Database
|
DB
|
Database operations. This option can generate a large amount of information, so only have it enabled when specifically reproducing a database-related issue.
|
|
EJB
|
EJB
|
The Enterprise JavaBeans (EJB) transport layer, which is the component architecture for the development and deployment of object-oriented, distributed, enterprise-level applications.
|
|
Engine
|
ENG
|
The Content Platform Engine server core.
|
|
Error
|
ERR
|
Error handling operations.
|
|
Events
|
EVNT
|
General event processing.
|
|
Fixed Content Provider
|
FCPV
|
Any fixed content providers.
|
|
GCD
|
GCD
|
The global configuration database (GCD) and its operations.
|
|
Handler
|
HDLR
|
Custom server handler code.
|
|
Metadata
|
MCHE
|
Metadata cache operations.
|
|
Publish
|
PUBL
|
Publishing operations.
|
|
Replication Subsystem
|
REPL
|
Replication subsystem operations.
|
|
Search
|
SRCH
|
Search and query operations.
|
|
Security
|
SEC
|
The client and server components used to authenticate (layered over the authentication provider) and authorize user access to Content Platform Engine objects.
|
|
SSI
|
SSI
|
Integration with the Single-document Storage Interface (SSI), which is an interface between the Content Platform Engine and FileNet Image Services.
|
|
Sweep
|
SWP
|
Sweep operations.
|
|
Thumbnail Generation
|
THMG
|
Thumbnail generation operations.
|
|
WSI
|
WSI
|
The Web Services Interface (WSI) transport layer to Content Platform Engine.
|
The following trace levels can be set for each subsystem:
•SUMMARY
Enables minimal high level logging by providing summary information for all operations. This setting does not significantly affect system performance.
•MODERATE
Enables more detailed high level logging than the SUMMARY option for all operations (includes all SUMMARY level information). This setting has some impact on system performance.
•DETAIL
Enables the most detailed logging by providing detailed information for all operations and is primarily used to aid in debugging issues (includes all SUMMARY and MODERATE level information). This setting significantly affects system performance.
•TIMER
Provides the duration (in milliseconds) that Content Platform Engine requires to complete an operation, such as uploading a file. This setting does not significantly affect system performance.
Depending on the issue reported by the clients, select which subsystems to trace and an appropriate trace level. There is no need to restart the system to start or stop gathering trace logs.
|
Recommendations: Disable the trace logging as soon as possible, because it can fill up the file system rapidly because of the amount of generated data.
|
12.7.2 Review additional sources for information about issues
If reviewing the logs does not lead you to a problem resolution, perform the following actions:
•Look at the portlets “Featured troubleshooting links”, “Flashes and alerts”, and “Problem resolutions” on the IBM Support home page:
•Check the public P8 forums on the Internet.
•Use your favorite search engine to look for your issue and a possible solution.
•Post a question on IBM developerWorks:
12.8 Troubleshooting production issues
When discussing production issues and how to troubleshoot them, remember that this environment is the production environment and users are affected by all changes. As long as the production system is running and only some users are affected by an issue, keep calm.
|
Recommendations: Restarting the servers and applications that are having an issue might get the system back to “normal” operating conditions but usually also camouflages the root cause of the issue. And in a worst case scenario, losing information about the root cause of the problem can worsen the overall situation.
Finding an appropriate balance between error analysis and limiting downtime or slow response times is critical, so perform these steps:
1. Read (and store) log files and error messages.
2. Consider your options before reacting.
3. Execute your remedial steps.
4. Document your activities for future reference.
|
Try to reproduce the issue and behavior of the production system in a test environment1. Then, analyze and try to fix the problem. If you are unable to fix the problem on your own, contact the IBM Support team and ask for help. When you receive a fix (software or a configuration change), install the fix into an integration or test environment. Perform some general regression tests in addition to validating that the main issue is fixed before moving the fix into the production environment. Depending on the severity of the issue, you might also choose to move the fix into all your other environments before moving it into production, in much the same way as you handle a new application or an enhancement to an existing application.
Follow these steps before you put the change into the production environment:
1. Back up any log files.
2. Clear the log files so any new errors are easy to detect.
3. Enhance the log and trace level in the production environment.
Be conservative when changing logging levels in production because more detailed logging causes an increase in the system load and therefore a decrease in performance.
4. Note all original and changed values in an administration log file for the production environment.
This makes it easier both to revert the system back to its initial state and to update other environments to match the new state of the production environment.
5. Validate that the fix is working as expected.
6. Reduce the level of logging back to normal levels using the reference information generated in step 4.
12.9 Troubleshooting performance issues
Performance problems in P8 Content Manager can come from a wide range of causes. Some issues can be eliminated by performing load and stress tests before rolling out new applications, new software releases, and incremental updates to production. Other issues can occur intermittently and might be caused by unusual situations, such as network bandwidth issues or transferring large files.
During system load and performance testing, it is likely that the required throughput will not be achieved without removing one or more bottlenecks. Performance issues can also occur after applications go live during normal, production operations of a P8 Content Manager solution. The following examples show when issues might occur:
•New software releases are deployed into production and some function response times increase, and the existing load and performance tests do not cover these particular functions.
•The user load increases to the point where the current system configuration can no longer perform as required.
•The data load increases to the point where the current system configuration can no longer perform as required.
•Security patches applied to the operating system have a negative impact on system performance.
•New users and groups are created in the directory server, or a change is made in the directory server configuration in such a way that the change negatively affects P8 Content Manager performance.
•Storage device configuration changes or hardware and software failures occur with the storage device.
Troubleshooting performance issues can cross organizational boundaries and require the cooperation of database administrators, directory server administrators, application server administrators, IT staff, application developers, and the P8 Content Manager administrator.
12.9.1 Performance tuning guide
A first entry point for tuning the system for optimal performance is the performance tuning information provided in the P8 Information Center:
The web page provides several links to topics with detailed information for tuning:
•Operating systems
•Databases
•Application servers
•Directory servers
•Content Platform Engine
•FileNet Workplace XT and IBM Content Navigator
The performance tuning topics in the FileNet P8 information center do not include suggested parameter settings, because the correct values are dependent on your environment and application.
12.9.2 Gathering performance data
The measurement of key performance indicator (KPI) values and KPIs of the system during load and stress tests and during normal working hours is important. This data generates the boundary and baseline performance information. The gathered information is used to define monitoring software thresholds and for discovering and troubleshooting performance issues. KPIs reflect how fast the system reacts during a defined workload and the high watermarks that cause the system response times to increase dramatically.
Running load and stress tests requires significant work. In addition to setting up an environment that mimics production, you need to perform these tasks:
•Populate the environment with data that is representative of production data in terms of type and volume of data.
•Define and build tests that mimic realistic production workloads.
The tests need to mimic both the type of work clients will perform, the number of clients that will use the system at any one time, and the length of time clients will access the system. The term “client” includes users who access the system manually as well as any batch processes.
•Have a way to refresh the environment so that you can rerun tests to validate that changes affect system performance in a positive manner.
|
Recommendations: Automate as much of the system setup, performance testing, and data gathering as possible.
|
The following tools can help you collect and analyze performance data:
•IBM System Dashboard for ECM
The Dashboard collects the following information from the P8 Content Manager environment:
– Environmental information
– Central processing unit counters
– Disk counters
– Network inbound/outbound counters
– User counters and response times of operations
•IBM Thread and Monitor Dump Analyzer for Java
JVM thread dumps can be used to analyze the detailed behavior of the application server and the hosted JVMs. The tool is available at this website:
http://www.ibm.com/developerworks/mydeveloperworks/groups/service/html/communityview?communityUuid=2245aa39-fa5c-4475-b891-14c205f7333c
This tool identifies the following information:
– Hangs
– Deadlocks
– Resource contention
– Bottlenecks in Java threads
•Windows Reliability and Performance Monitor
The Windows Reliability and Performance Monitor is a Microsoft tool. This tool provides a quick overview of the processes that use a large amount of CPU, memory, disk, and network resources.
If you need a longer history of how processes and applications consume server resources, use the Microsoft Data Collector Sets. Start by using the preset templates, then modify the templates as needed and save them as your own templates and presets.
More details are provided by Microsoft Technet:
•Nmon
This free tool provides a huge amount of information all on one window. Even though IBM does not support the tool and you must use it at your own risk, it provides a wealth of performance statistics. The tool is available at this website:
The nmon tool is designed for AIX and Linux performance specialists to use for monitoring and analyzing the following performance data:
– CPU utilization
– Memory use
– Kernel statistics and run queue information
– Disk I/O rates, transfers, and read/write ratios
– Free space on file systems
– Disk adapters
– Network I/O rates, transfers, and read/write ratios
– Paging space and paging rates
– CPU and AIX specification
– Top processors
– IBM HTTP web cache
– User-defined disk groups
– Machine details and resources
– Asynchronous I/O (AIX only)
– Workload Manager (WLM) (AIX only)
– IBM TotalStorage Enterprise Storage Server® (ESS) disks (AIX only)
– Network File System (NFS)
– Dynamic logical partition (LPAR) (DLPAR) changes (only IBM pSeries® p5 and IBM OpenPower® for either AIX or Linux)
12.9.3 Slow logon
A typical performance issue from all web-based applications is the client user complaining about how long it takes to log on (slow logon). The steps for resolving this type of issue vary depending on whether the issue is on a new or recently upgraded installation, or whether it is occurring on a system that has been running for a while without issues.
|
Note: After starting or restarting the application server or redeploying the Content Platform Engine ear or war file, the first logon will take longer than subsequent logons because the cache has to be refreshed. You can minimize this behavior:
•Use the precompile options of the application server, although this will increase the time it takes to restart the application server.
•Use a script whenever the application server is restarted to walk through all commonly used application functions. The script must be run on all application server nodes.
|
Issue following installation or upgrade
For a new installation or a recently upgraded installation, check the following configurations:
•The LDAP configuration of the application server:
– Connection timeout setting for LDAP queries.
– Size of the LDAP connection pool is sufficient.
•The LDAP configuration in ACCE:
– Validate which directory services are configured.
– Check whether the DNS entry is resolved to a single, dedicated server or is an alias to a number of directory servers.
Ideally, the Content Platform Engine will always access the directory server that is closest physically to the Content Platform Engine server. The greater the distance between the servers, the slower the logon.
– Size of the Maximum User Token Cache Entries
Ensure that the size is adequate compared to the number of active system users, so that if users frequently log in and out, their information remains cached and does not have to be reacquired from the directory server every time.
– Time of User Token Cache Entry TTL
Increasing the value of this parameter can enhance system performance, but the trade-off is LDAP changes take longer to take effect within the P8 Content Manager environment.
•Examine the user, group membership, and organizational unit (OU) configurations in the LDAP server:
– If there are nested group memberships, check the nesting depth.
The more nested groups and the deeper the nesting depth, the longer it takes the Content Platform Engine to identify all the groups to which a user belongs.
– Limit the tree that has to be traversed to find users and groups as much as possible.
•Check the network
– Number of network hops and the latency of the network between the application server and the LDAP server.
Work with the network administrators to implement special routing for LDAP requests.
– Bandwidth between the application server and the LDAP server.
The performance can be improved by introducing quality of service (QoS) for the LDAP requests if the bandwidth is limited.
Production issues
In addition to the basic performance issues during the initial implementation of a solution, there is always the possibility of running into performance issues during production.
Implement regression test cases to validate your application after upgrading to new software levels, fixing an issue, or introducing new features. One of the regression tests needs to be a performance baseline test in which a known user logs on to the system. If your clients are reporting slow logons, one of the first troubleshooting steps is to run this baseline test. The results of the test help identify whether there is an issue common to all users or whether the slow logon affects only a subset of your clients.
If all users are affected, review the common infrastructure elements to determine whether a failure occurred.
If the problem is limited to a subset of users, follow these steps:
•Ask the user if the logon was quicker in the past. If yes, ask when they first noticed the slowdown.
•Examine the user’s group membership to determine whether anything changed recently:
– Does this user belong to significantly more groups than other users?
– If there are nested group memberships, determine the nesting depth.
•Determine which DNS server is processing the user’s authentication request, and whether authenticating via a different server has an impact on the logon.
12.9.4 Slow searches
Content Platform Engine supports customizable searches. Searches can be constructed with various operators and combinations of search conditions, joins, subqueries, and ordering, and can include the paging of results.
Because of this powerful and customizable search capability, and because unnecessary indexes can degrade performance when objects are added or updated, a single set of database indexes to support high performance searches for all application designs does not exist.
Therefore, you must analyze the searches run in your environment in order to create the right and minimal set of database indexes to ensure high performance.
IBM provides a detailed technote to deal with this challenge:
This list summarizes the best practices when you create searches:
•Use a wildcard search only at the end of a string search value and use Starts With for a LIKE query.
•Create Oracle function-based or DB2 generated-column indexes for string comparisons that are not case sensitive.
•Join only one or two tables at a time in a query.
•Avoid unnecessary Order By clauses.
•Use the Intersects operator for multiple List property OR conditions.
•Use continuable searches for queries that are run from a graphical user interface.
Continuable searches reduce the time database locks are held, and allow result sets to be displayed more quickly to clients when compared to non-continuable searches. However, the total time taken for a non-continuable search is shorter than for continuable search.
In a non-continuable search, all rows are returned and the database can hold row locks during the query, which can result in timeouts or database contention.
•Verify that searches are using the expected indexes and are using the best possible query plan.
•Ensure DBAs regularly monitor database statistics and reorganize frequently updated tables.
12.9.5 Storage performance issues
When you run into storage performance issues, use the IBM System Dashboard for Enterprise Content Management to examine the file and fixed storage performance counters. There are many counters related to storage performance, and these counters can indicate a bottleneck reading or writing to a storage device, or a high failure count related to a storage device.
A good place to start is the Content Upload and Content Download server-based counters. If the performance issue cannot be resolved and IBM Support is needed, collect IBM System Dashboard data during the time that the issue is seen. The interval that the counters are collected needs to be in the 10 - 30 second range. Be sure to supply IBM Support with a system monitor archive file (Archive history option), since an archive file can be used to examine all the detailed information collected by the system monitor. In addition to an archive file, supply IBM Support with information about the system architecture. Include detailed information about the storage devices and usage patterns, for example, storage devices shared by applications other than the Content Platform Engine.
12.9.6 Tuning sweep jobs
For the best performance of policy and job sweeps, create a covering index on the base table that is being swept. In addition, analyze the searches and the query plans for the sweep jobs and add indexes as necessary.
Use the sweep preview mode to determine the rate at which the sweep will traverse the objects, without actually performing the sweep actions on the objects. Follow these steps to run a sweep in preview mode:
1. Define the job or the policies exactly as they will be run in production, including the proper classes, subclasses, and filter expressions.
2. Set the Sweep Mode to Preview Counters Only mode.
3. Let the sweep run and use the IBM System Dashboard to monitor the progress.
4. Review the sweep framework summary tracing to see the overall sweep rate after the sweep finishes.
12.10 Opening PMRs
If you are having difficulty correcting a problem yourself, open a Problem Management Record (PMR) with IBM software support. You can open PMRs by calling IBM Support directly or via the IBM software support portal. To open a PMR, you will need your IBM Customer Number (ICN).
12.10.1 The IBM software support portal
The IBM software support portal details all facets of IBM software support. It provides self-help information, as well as instructions for creating PMRs and escalation procedures. You can obtain the specialized IBM software support portal for FileNet at the following link:
http://www.ibm.com/support/entry/portal/Overview/Software/Enterprise_Content_Management/FileNet_Product_Family/FileNet_Content_Manager
12.10.2 Open a PMR by calling IBM
IBM software support has local call-in numbers for most countries. Local numbers are at this website:
http://www.ibm.com/support/entry/portal/Overview/Software/Enterprise_Content_Management/FileNet_Product_Family/FileNet_Content_Manager
Select Support & downloads → Service requests and PMRs and find the link. Then, click Contact support → Directory of worldwide contacts.
Or use this hot link:
In the US, call IBM software support at 1-800-IBM-SERV (1-800-426-7378) and select option 2. Ask the dispatcher to open a PMR on your behalf and to connect you with an IBM Support specialist.
12.10.3 Open a PMR via the web
You can open a PMR via the web through the Electronic Service Request (ESR) tool, which is available at this website:
Follow these steps to open a PMR:
1. Select Support & downloads → Service requests and PMRs → Go to IBM Service Request.
2. Log in with your IBM ID.
3. Select Open a new service request → Enter your keyword(s). For example, enter Content Platform Engine.
4. Select the product that you are using. Enter the relevant data. Select Continue.
Or, use this hot link:
To submit PMRs via the website, your company’s Site Technical Contact must authorize you to submit PMRs electronically to IBM.
|
Important: If your production system is down, call IBM Support directly and open a severity 1 PMR.
|
12.10.4 Necessary items when contacting IBM software support
When calling or submitting a problem to IBM software support, have the following information ready. The more information you can supply, the quicker the IBM Support team can start resolving your issue. Provide the following information:
•Your IBM customer number
•Your company name
•Your contact name:
– Preferred means of contact (voice or email)
– Telephone number where you can be reached
•Machine type and model number:
– Related product and version information
– Related operating system and database information
•Prepare the “MustGather” information manually or by using the IBM Support Assistant (ISA) Workbench.
•Detailed description of the issue.
Being able to articulate the problem and symptoms before contacting software support expedites the problem solving process. It is extremely important that you are as specific as possible in explaining a problem or question to the IBM software specialists. Our IBM Support specialists want to be sure that they provide you with exactly the right solution; therefore, the better they understand your specific problem scenario, the better they are able to resolve it.
Gathering background information
To effectively and efficiently solve a problem, the software specialist needs to have all of the relevant information about the problem. Being able to answer the following questions will help in the efforts to resolve your software problem:
•Has the problem happened before, or is this a new, isolated problem?
•What steps led to the failure?
•Can the problem be re-created? If so, what steps are required?
•Have any changes been made to the system, such as hardware, network, or software updates?
•Are any messages or other diagnostic information produced when the error occurs? Attach the information to the PMR and include a screen capture if appropriate. Identifying the time at which the error occurred is helpful.
It is often helpful to have a printout of the message numbers of any messages received when you call IBM Support.
Define your technical question in specific terms and provide the version and release level of the products in question.
Gather relevant diagnostic information, if possible. It is often necessary that the software support specialists analyze specific diagnostic information, such as storage dumps and traces, in order to resolve your problem. Gathering this information is often the most critical step in resolving your problem.
On more difficult problems, you might also need the following items:
•Application architecture diagram that details how all application components are designed to work
•Network topology diagram, including servers, routers, firewalls, and network load balancers
•If your problem is performance-related, performance archive files
Determining the business impact
You need to assign a severity level to the problem when you report it, so you need to understand the business impact of the problem that you are reporting. A description of the severity levels is in Table 12-2.
Table 12-2 Problem severity descriptions and examples
|
Severity level
|
Further definitions
|
Examples
|
|
Severity 1
|
Critical situation/system down:
Business critical software component is inoperable. As a rule, it applies to the production environment.
|
The P8 Content Manager system is down and affecting all users.
|
|
Severity 2
|
Severe impact:
A software component is severely restricted in its use, causing significant business impact.
|
The P8 Content Manager system cannot be accessed by one department. Other users are able to access the system.
|
|
Severity 3
|
Moderate impact:
A non-critical software component is malfunctioning, causing moderate business impact.
|
A client cannot connect to a server.
|
|
Severity 4
|
Minimal impact:
A non-critical software component is malfunctioning, causing minimal impact, or a non-technical request is being made.
|
Documentation is incorrect.
Additional documentation requested.
|
When speaking with the software support specialist, also mention the following items if they apply to your situation:
•You are under business deadline pressure.
•Your availability, or when you will be able to work with IBM software support.
•You can be reached at more than one phone number.
•You can designate a knowledgeable alternate contact with whom the IBM Support representative can speak.
•You have other open problems (PMRs) with IBM about this service request.
•You are participating in an early adoption program.
•You have researched this situation prior to calling IBM and have detailed information or documentation to provide for the problem.
12.10.5 IBM Support Assistant (ISA) Workbench
The IBM Support Assistant Workbench provides access to several different serviceability tools, which can assist you in many areas of problem diagnosis, such as Java troubleshooting, product configuration analysis, and log analysis. IBM Support Assistant can be customized for over 350 products and over 20 tools.
If you have permission to use this software tool, install and use it for general troubleshooting or for gathering all relevant data for opening a PMR.
IBM Support Assistant Workbench is available at this website:
If the entire tool is too large or you are not allowed to install this type of tool in the production environment, consider using the IBM Support Assistant Lite Data Collector version instead. IBM Support Assistant Lite Data Collector is smaller than the IBM Support Assistant Workbench, because it is a simple utility that collects the specific data that is needed for opening a PMR.
IBM Support Assistant Lite Data Collector is available at this website:
You can also install IBM Support Assistant as a team server that you and your team can access via a browser. An Overview tab provides all the relevant system data. The Symptom tab displays all problems found and ranks them. A Global Knowledge Base Matches tab displays potential solutions for the symptoms identified during the analysis of your case files. In this view, you can quickly identify technical documents, APARs, and fix packs that address the symptoms identified during the automated analysis.
12.10.6 Type of fixes that might be provided
There are three types of fixes that might be provided by the IBM Support Team release:
•Fix pack
•Interim fix
•Test fix
An Authorized Program Analysis Report (APAR) is associated with each fix that is contained in a support package.
An APAR is generated as a result of the following actions:
1. A customer reports an issue via a PMR.
2. The Level 2 (L2) support team investigates the issue and determines that they need additional assistance, and open a Change Request Management (CRM).
3. The Level 3 (L3) support team assists with the investigation of the issue.
If a software fix is required, an APAR is opened so that information about the issue can be available to other customers.
All fixes are made available via IBM Support Fix Central:
Before you install a fix, review the readme file that is provided with the package. Review the appropriate FileNet P8 fix pack compatibility matrices that can be downloaded from this website:
Fix pack
A fix pack provides a roll-up of APAR resolutions that were previously provided as interim fixes, test fixes, or in a previous fix pack, as well as fixes not previously released.
Interim fix
An interim fix provides the resolution to a few APARs, usually one, that are likely to be needed by multiple customers.
Test fix
A test fix provides the resolution to a few APARS, usually one, that are required by a specific customer. Test fixes are password protected.
12.10.7 Rolling up fixes
If you received a test fix or an interim fix from IBM Support, before you install a new fix pack or a later release of a P8 Content Manager component, ensure that the fixes you need are included in the software. The fixes and software releases occur at various times so you cannot assume that your specific issue is resolved in the “newer” software release package.
If you are in any doubt, contact the IBM Support team to ensure that your fixes are included in the software release that you want to install.
12.11 Conclusion
In this chapter, we discussed the basics of troubleshooting P8 Content Manager and associated third-party software.
In the next chapter, we provide an overview of building software solutions that use P8 Content Manager.
1 This action presupposes a similar reference system is available with similar physical and software characteristics as the production environment.
..................Content has been hidden....................
You can't read the all page of ebook, please click here login for view all page.