
with Jai Asundi and Mark Klein
Note: Jai Asundi teaches at the University of Texas, Dallas; Mark Klein is on the technical staff at the Software Engineering Institute.
A billion here, a billion there, pretty soon it adds up to real money.
—U.S. Senator Everett Dirksen (1896–1969)
As we saw in Chapter 11, the Architecture Tradeoff Analysis Method (ATAM) provides software architects a means of evaluating the technical tradeoffs faced while designing or maintaining a software system. In the ATAM, we are primarily investigating how well the architecture—real or proposed—has been designed with respect to the quality attributes that its stakeholders have deemed important. We are also analyzing architectural tradeoffs—the places where a decision might have consequences for several quality attributes simultaneously.
However, the ATAM is missing an important consideration: The biggest tradeoffs in large, complex systems usually have to do with economics. How should an organization invest its resources in a manner that will maximize its gains and minimize its risk? In the past, this question primarily focused on costs, and even then these were primarily the costs of building the system in the first place and not the long-term costs through cycles of maintenance and upgrade. As important, or perhaps more important than costs, are the benefits that an architectural decision may bring to an organization.
Given that the resources for building and maintaining a system are finite, there must be a rational process that helps us choose among architectural options, during both an initial design phase and subsequent upgrade periods. These options will have different costs, will consume differing amounts of resources, will implement different features (each of which brings some benefit to the organization), and will have some inherent risk or uncertainty. To capture these aspects we need economic models of software that take into account costs, benefits, risks, and schedule implications.
To address this need for economic decision making, we have developed a method of economic modeling of software systems, centered on an analysis of their architectures. Called the Cost Benefit Analysis Method (CBAM), it builds on the ATAM to model the costs and the benefits of architectural design decisions and is a means of optimizing such decisions. The CBAM provides an assessment of the technical and economic issues and architectural decisions.
The software architect or decision maker wishes to maximize the difference between the benefit derived from the system and the cost of implementing the design. The CBAM begins where the ATAM concludes and, in fact, depends upon the artifacts that the ATAM produces as output. Figure 12.1 depicts the context for the CBAM.

Because architectural strategies have technical and economic implications, the business goals of a software system should influence the strategies used by software architects or designers. The direct economic implication is the cost of implementing the system. The technical implications are the characteristics of the system—namely, the quality attributes. In turn the quality attributes have economic implications because of the benefits that can be derived.
Recall that when an ATAM has been applied to a software system, we have as a result a set of artifacts documented on completion. They are:
• A description of the business goals that are crucial to the success of the system
• A set of architectural views that document the existing or proposed architecture
• A utility tree that represents a decomposition of the stakeholders' goals for the architecture, starting with high-level statements of quality attributes and ending with specific scenarios
• A set of risks that have been identified
• A set of sensitivity points (architectural decisions that affect some quality attribute measure of concern)
• A set of tradeoff points (architectural decisions that affect more than one quality attribute measure, some positively and some negatively)
The ATAM identifies the set of key architectural decisions relevant to the quality attribute scenarios elicited from the stakeholders. These decisions result in some specific quality attribute responses—namely, particular levels of availability, performance, security, usability, modifiability, and so forth. But each architectural decision also has associated costs. For example, using redundant hardware to achieve a desired level of availability has a cost; checkpointing to a disk file has a different cost. Furthermore, both of these architectural decisions will result in (presumably different) measurable levels of availability that will have some value to the organization developing the system. Perhaps the organization believes that its stakeholders will pay more for a highly available system (a telephone switch or medical monitoring software, for example) or that it will be sued if the system fails (for example, the software that controls anti-lock brakes in an automobile).
The ATAM uncovers the architectural decisions made in the system and links them to business goals and quality attribute response measures. The CBAM builds on this base by eliciting the costs and benefits associated with these decisions. Given this information, the stakeholders can then decide whether to use redundant hardware, checkpointing, or some other tactic to achieve the system's desired availability. Or they can choose to invest their finite resources in some other quality attribute—perhaps believing that higher performance will have a better benefit-to-cost ratio. A system always has a limited budget for creation or upgrade, so every architectural choice is, in some sense, competing with every other one for inclusion.
The CBAM does not make decisions for the stakeholders, just as a financial advisor does not tell you how to invest your money. It simply aids in the elicitation and documentation of the costs, benefits, and uncertainty of a “portfolio” of architectural investments and gives the stakeholders a framework within which they can apply a rational decision-making process that suits their needs and their risk aversion.
To briefly summarize, the idea behind the CBAM is that architectural strategies (a collection of architectural tactics) affect the quality attributes of the system and these in turn provide system stakeholders with some benefit. We refer to this benefit as utility. Each architectural strategy provides a specific level of utility to the stakeholders. Each also has cost and takes time to implement. Given this information, the CBAM can aid the stakeholders in choosing architectural strategies based on their return on investment (ROI)—the ratio of benefit to cost.
We now describe the key ideas that form the basis for the CBAM. The practical realization of these ideas as a series of steps will be described in Section 12.3. Our goal here is to develop the theory underpinning a measure of ROI for various architectural strategies in light of scenarios chosen by the stakeholders.
We begin by considering a collection of scenarios generated either as a portion of an ATAM or especially for the CBAM evaluation. We examine how they differ in the values of their projected responses and then assign utility to those values. The utility is based on the importance of each scenario being considered with respect to its anticipated response value. We next consider the architectural strategies that lead to the various projected responses. Each strategy has a cost, and each impacts multiple quality attributes. That is, an architectural strategy could be implemented to achieve some projected response, but while achieving that response it also affects some other quality attributes. The utility of these “side effects” must be taken into account when considering a strategy's overall utility. It is this overall utility that we combine with the project cost of an architectural strategy to calculate a final ROI measure.
Utility is determined by considering the issues described in the following sections.
The CBAM uses scenarios as a way to concretely express and represent specific quality attributes, just as in the ATAM. Also as in the ATAM, we structure scenarios into three parts: stimulus (an interaction with the system), environment (the system's state at the time), and response (the measurable quality attribute that results). However, there is a difference between the methods: The CBAM actually uses a set of scenarios (generated by varying the values of the responses) rather than individual scenarios as in the ATAM. This leads to the concept of a utility-response curve.
Every stimulus-response value pair in a scenario provides some utility to the stakeholders, and the utility of different possible values for the response can be compared. For example, a very high availability in response to failure might be valued by the stakeholders only slightly more than moderate availability. But low latency might be valued substantially more than moderate latency. We can portray each relationship between a set of utility measures and a corresponding set of response measures as a graph—a utility-response curve. Some examples of utility-response curves are shown in Figure 12.2. In each, points labeled a, b, or c represent different response values. The utility-response curve thus shows utility as a function of the response value.

The utility-response curve depicts how the utility derived from a particular response varies as the response varies. As seen in Figure 12.2, the utility could vary nonlinearly, linearly, or even as a step-function. For example, graph (c) portrays a steep rise in utility over a narrow change in a quality attribute response level, such as the performance example stated above. The availability example might be better characterized by graph (a), where a modest change in the response level results in only a very small change in utility to the user.
Eliciting the utility characteristics from the stakeholders can be a long and tedious process. To make it practical we have chosen to elicit only rough approximations of these curves from the stakeholders, using five values of the quality attribute response for the scenario. We now explain the four of these values that can be derived without consideration of any architectural strategy. The fifth value depends on the architectural strategy used, and we discuss this later.
To build the utility-response curve, we first determine the quality attribute levels for the best-case and worst-case situations. The best-case quality attribute level is that above which the stakeholders foresee no further utility. For example, a system response to the user of 0.1 second is perceived as instantaneous, so improving it further so that it responds in 0.03 second has no utility. Similarly, the worst-case quality attribute level is a minimum threshold above which a system must perform; otherwise it is of no use to the stakeholders. These levels—best-case and worst-case—are assigned utility values of 100 and 0, respectively.
We must then determine the current and desired utility levels for the scenario. The respective utility values (between 0 and 100) for the current and desired cases are elicited from the stakeholders, using the best-case and worst-case values as reference points (e.g., we are currently half as good as we would like to be, but if we reach the desired quality attribute level, we will have 90% of the maximum utility; hence, the current utility level is set to 50 and the desired utility level is set to 90). In this manner the curves are generated for all of the scenarios.
Different scenarios within a given system have different levels of importance to the stakeholders and hence different utilities. To characterize the relative importance of each scenario, a weight is assigned through a two-step voting exercise. In the first step the stakeholders vote on the scenarios to establish an ordering among them. This voting is based on each scenario's “expected” response value. The stakeholders then assign a weight of 1 to the highest-rated scenario and a fractional amount to the other scenarios based on their relative importance.
If, at some future date, additional scenarios need to be added, they can be assigned a weight. The stakeholders, through consensus, can make sure that the scenarios weights accord with their intuition.
It is the job of the architect, or architects, to determine the architectural strategies for moving from the current quality attribute response level to the desired or even best-case level. A portion of the CBAM is devoted to this task. For each strategy, we can derive
• the expected value of the response in each scenario. The utility of the expected value is calculated using interpolation from the four values already elicited from the stakeholders.
• the effect of the architectural strategy on other attributes of interest.
• a cost estimate for implementing the architectural strategy.
Each architectural strategy will impact not only the quality attribute from the scenario being considered currently but will typically also affect other quality attributes (this is why there are architectural tradeoffs!). It is important to determine the utility of these additional side effect attribute responses that arise as a result of applying the architectural strategy. In the worst case, we must create a new version of the scenario for the side effect attribute and determine its utility-response curve. However, in practice, if the quality attribute is important to the stakeholders, then it has occurred in one of the other scenarios and the utility-response curve has already been constructed for that response. In this case, the only thing left to determine is the expected utility associated with that quality attribute for the given architectural strategy. Notice that it is possible that the expected utility for a particular attribute may be negative if the architectural strategy is designed to emphasize an attribute in conflict with the one whose utility we are currently calculating.
Once this additional information has been elicited we can calculate the benefit of applying an architectural strategy by summing its benefits to all relevant quality attributes.
We calculate the overall utility of an architectural strategy across scenarios from the utility-response curves by summing the utility associated with each one (weighted by the importance of the scenario). For each architectural strategy, i, we calculate a benefit, Bi as follows:
where bi,j is the benefit accrued to strategy i due to its effect on scenario j and Wj is the weight of scenario j. Referring to Figure 12.2, each bi,j is calculated as the change in utility brought about by the architectural strategy with respect to this scenario: bi,j = Uexpected – Ucurrent; that is, the utility of the expected value of the architectural strategy minus the utility of the current system relative to this scenario. The effect of multiplying the weight, Wj, is to normalize this utility value by the relative importance of the various scenarios, as already described.
The ROI value for each architectural strategy is the ratio of the total benefit, Bi, to the Cost, Ci, of implementing it. The cost is calculated using a model appropriate for the system and the environment being developed.
Using this ROI score, the architectural strategies can be rank-ordered; this rank ordering can then be used to determine the optimal order for implementation of the various strategies.
Consider curves (a) and (b) in Figure 12.2. Curve (a) “flattens out” as the quality attribute response improves. In this case, it is likely that a point is reached past which ROI decreases as the quality attribute response improves. In other words, spending more money will not yield a significant increase in utility. On the other hand, consider curve (b), for which a small improvement in quality attribute response can yield a very significant increase in utility. There an architectural strategy whose ROI is too low might rank significantly higher with a modest improvement in its quality attribute response.
Turning the foundations for the CBAM into a set of practical steps involves taking the bases we discussed in the previous section and performing them in a fashion that minimizes the work that is needed. Part of being “practical” involves limiting the size of the decision space.
A process flow diagram for the CBAM is given in Figure 12.3. The first four steps are annotated with the relative number of scenarios they consider. That number steadily decreases, ensuring that the method concentrates the stakeholders' time on the scenarios believed to be of the greatest potential in terms of ROI.
• Step 1: Collate scenarios. Collate the scenarios elicited during the ATAM exercise, and give the stakeholders the chance to contribute new ones. Prioritize these scenarios based on satisfying the business goals of the system and choose the top one-third for further study.
• Step 2: Refine scenarios. Refine the scenarios output from step 1, focusing on their stimulus-response measures. Elicit the worst-case, current, desired, and best-case quality attribute response level for each scenario.
• Step 3: Prioritize scenarios. Allocate 100 votes to each stakeholder and have them distribute the votes among the scenarios, where their voting is based on the desired response value for each scenario. Total the votes and choose the top 50% of the scenarios for further analysis. Assign a weight of 1.0 to the highest-rated scenario; assign the other scenarios a weight relative to the highest rated. This becomes the weighting used in the calculation of a strategy's overall benefit. Make a list of the quality attributes that concern the stakeholders.
• Step 4: Assign utility. Determine the utility for each quality attribute response level (worst-case, current, desired, best-case) for the scenarios from step 3.
• Step 5: Develop architectural strategies for scenarios and determine their expected quality attribute response levels. Develop (or capture already developed) architectural strategies that address the chosen scenarios and determine the “expected” quality attribute response levels that will result from them. Given that an architectural strategy may have effects on multiple scenarios, we must perform this calculation for each scenario affected.
• Step 6: Determine the utility of the “expected” quality attribute response levels by interpolation. Using the elicited utility values (that form a utility curve), determine the utility of the expected quality attribute response level for the architectural strategy. Do this for each relevant quality attribute enumerated in step 3.
• Step 7: Calculate the total benefit obtained from an architectural strategy. Subtract the utility value of the “current” level from the expected level and normalize it using the votes elicited in step 3. Sum the benefit due to a particular architectural strategy across all scenarios and across all relevant quality attributes.
• Step 8: Choose architectural strategies based on ROI subject to cost and schedule constraints. Determine the cost and schedule implications of each architectural strategy. Calculate the ROI value for each as a ratio of benefit to cost. Rank-order the architectural strategies according to the ROI value and choose the top ones until the budget or schedule is exhausted.
• Step 9: Confirm results with intuition. For the chosen architectural strategies, consider whether these seem to align with the organization's business goals. If not, consider issues that may have been overlooked while doing this analysis. If there are significant issues, perform another iteration of these steps.

We now apply the CBAM to a real-world system as an example of the method in action.
The Earth Observing System is a constellation of NASA satellites that gathers data for the U.S. Global Change Research Program and other scientific communities worldwide. The Earth Observing System Data Information System (EOSDIS) Core System (ECS) collects data from various satellite downlink stations for further processing. ECS's mission is to process the data into higher-form information and make it available to scientists in searchable form. The goal is to provide both a common way to store (and hence process) data and a public mechanism to introduce new data formats and processing algorithms, thus making the information widely available.
The ECS processes an input stream of hundreds of gigabytes of raw environment-related data per day. The computation of 250 standard “products” results in thousands of gigabytes of information that is archived at eight data centers in the United States. The system has important performance and availability requirements. The long-term nature of the project also makes modifiability important.
The ECS project manager had a limited annual budget to maintain and enhance his current system. From a prior analysis, in this case an ATAM exercise, a large set of desirable changes to the system was elicited from the system stakeholders, resulting in a large set of architectural strategies. The problem was to choose a (much) smaller subset for implementation, as only 10% to 20% of what was being proposed could actually be funded. The manager used the CBAM to make a rational decision based on the economic criterion of return on investment.
In the execution of the CBAM described next, we concentrated on analyzing the Data Access Working Group (DAWG) portion of the ECS.
Scenarios from the ATAM were collated with a set of new scenarios elicited from the assembled ECS stakeholders. Because the stakeholders had been through an ATAM exercise, this step was relatively straightforward.
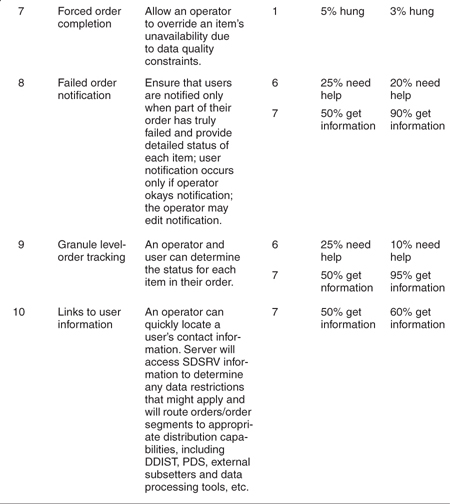
A subset of the raw scenarios put forward by the DAWG team were as shown in Table 12.1. Note that they are not yet well formed and that some of them do not have defined responses. These issues are resolved in step 2, when the number of scenarios is reduced.[1]

The scenarios were refined, paying particular attention to precisely specifying their stimulus-response measures. The worst-case, current-case, desired-case, and the best-case response goals for each scenario were elicited and recorded, as shown in Table 12.2.

In voting on the refined representation of the scenarios, the close-knit team deviated slightly from the method. Rather than vote individually, they chose to discuss each scenario and arrived at a determination of its weight via consensus. The votes allocated to the entire set of scenarios were constrained to 100, as shown in Table 12.3. Although the stakeholders were not required to make the votes multiples of 5, they felt that this was a reasonable resolution and that more precision was neither needed nor justified.

In this step the utility for each scenario was determined by the stakeholders, again by consensus. A utility score of 0 represented no utility; a score of 100 represented the most utility possible. The results of this process are given in Table 12.4.

Based on the requirements implied by the preceding scenarios, a set of 10 architectural strategies was developed by the ECS architects. Recall that an architectural strategy may affect more than one scenario. To account for these complex relationships, the expected quality attribute response level that each strategy is predicted to achieve had to be determined with respect to each relevant scenario.
The set of architectural strategies, along with the determination of the scenarios they address, is shown in Table 12.5. For each architectural strategy/scenario pair, the response levels expected to be achieved with respect to that scenario are shown (along with the current response, for comparison purposes).

Once the expected response level of every architectural strategy has been characterized with respect to a set of scenarios, their utility can be calculated by consulting the utility scores for each scenario's current and desired responses for all of the affected attributes. Using these scores, we may calculate, via interpolation, the utility of the expected quality attribute response levels for the architectural strategy/scenario pair applied to the DAWG of ECS.

The results of this calculation are shown in Table 12.6, for the architectural strategy/scenario pairs presented in Table 12.5.
Based on the information collected, as represented in Table 12.6, the total benefit of each architectural strategy can now be calculated, following the equation on page 313. This equation calculates total benefit as the sum of the benefit that accrues to each scenario, normalized by the scenario's relative weight. The total benefit scores for each architectural strategy are given in Table 12.7.


To complete the analysis, the team estimated cost for each architectural strategy. The estimates were based on experience with the system, and a return on investment for each architectural strategy was calculated. Using the ROI, we were able to rank each strategy. This is shown in Table 12.8. Not surprisingly, the ranks roughly follow the ordering in which the strategies were proposed: strategy 1 has the highest rank; strategy 3 the second highest. Strategy 9 has the lowest rank; strategy 8, the second lowest. This simply validates stakeholders' intuition about which architectural strategies were going to be of the greatest benefit. For the ECS these were the ones proposed first.

The most obvious results of the CBAM are shown in Table 12.8: an ordering of architectural strategies based on their predicted ROI. However, just as for the ATAM method, the benefits of the CBAM extend beyond the qualitative outcomes. There are social and cultural benefits as well.
Just as important as the ranking of architectural strategies in CBAM is the discussion that accompanies the information-collecting and decision-making processes. The CBAM process provides a great deal of structure to what is always largely unstructured discussions, where requirements and architectural strategies are freely mixed and where stimuli and response goals are not clearly articulated. The CBAM process forces the stakeholders to make their scenarios clear in advance, to assign utility levels of specific response goals, and to prioritize these scenarios based on the resulting determination of utility. Finally, this process results in clarification of both scenarios and requirements, which by itself is a significant benefit.
The CBAM is an iterative elicitation process combined with a decision analysis framework. It incorporates scenarios to represent the various quality attributes. The stakeholders explore the decision space by eliciting utility-response curves to understand how the system's utility varies with changing attributes. The consensus basis of the method allows for active discussion and clarification amongst the stakeholders. The traceability of the design decision permits updating and continuous improvement of the design process over time.
Elicitation of information from real-world projects is difficult. As researchers, we are charged with creating methods that are usable by real-world engineers in real projects. These methods need to produce useful results quickly and at a reasonable “price,” in terms of the stakeholders' time. As we have discovered in our experiences with the CBAM, solving a problem in theory and in practice are very different. We have already modified the CBAM considerably as a result of several applications of this method to NASA's ECS.
In spite of the practical difficulties, we believe that the application of economic techniques is inherently better than the ad hoc decision-making approaches that projects (even quite sophisticated ones) employ today. Our experience with the CBAM tells us that giving people the appropriate tools to frame and structure their discussions and decision making is an enormous benefit to the disciplined development of a complex software system.
Early work on the CBAM can be found in [Kazman 01] and [Asundi 01]. Cost modeling is discussed in [Boehm 81] and [Jones 99]. The evaluation of the ECS architecture using the ATAM is described in [Clements 02a].
1. One of the novel aspects of the CBAM is the creation of utility-response curves. Consider the curve styles shown in Figure 12.2. What are the circumstances under which you can imagine each of those curves elicited from the stakeholders? What situations does each of these curves represent?
2. Determination of costs and benefits is fraught with uncertainty. What sources of uncertainty do you typically have to deal with and how would you go about characterizing, measuring, and minimizing them?