STEP 1
DEI Inventory for People—Seek Understanding
If you can't measure it, it will be harder to manage it.
If you don't assess it, it will be more difficult to address it.
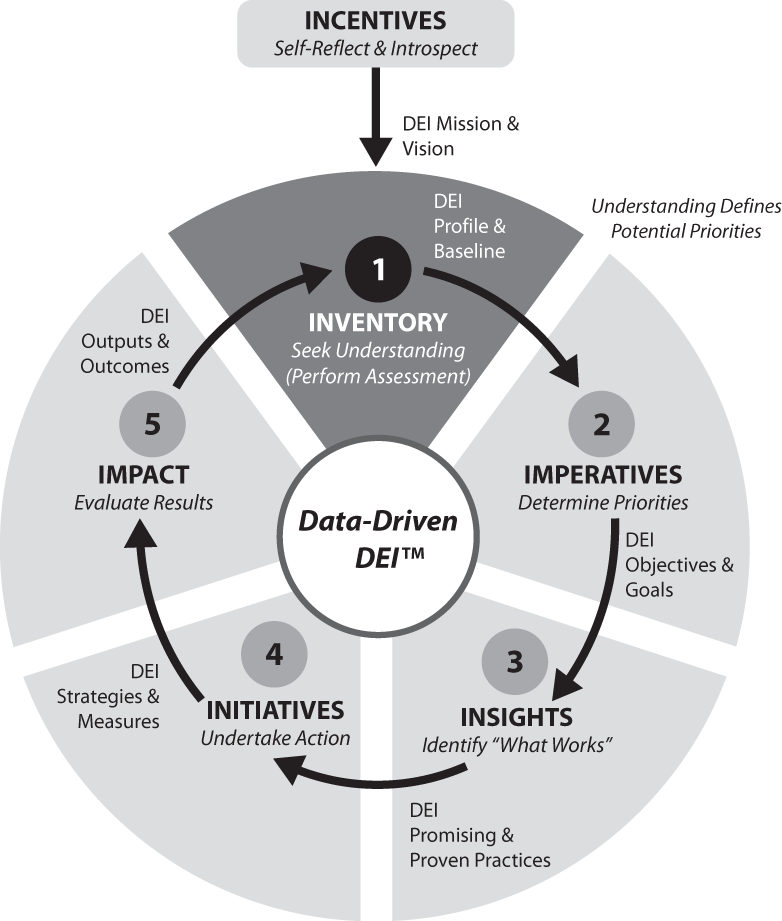
Data‐Driven DEI—Step 1: DEI Inventory for People
A DEI inventory for people—a personal DEI assessment—collects data from you, typically in the form of a questionnaire, survey, or form and, in doing so, delivers two valuable outputs:
- A profile—a report containing data and a descriptive representation of you based on the assessment's area(s) of focus. The profile summarizes insights, findings, and/or recommendations specific to you and your personal DEI journey.
- A baseline—a starting data point and/or reference data point to gauge progress along your personal DEI journey. The baseline provides the means to evaluate your learning, development, and growth.
A personal DEI assessment helps you understand where you are personally and determine where you want to go. Step 1: DEI Inventory is the most important step of the Data‐Driven DEI five‐step cycle because your DEI strategic plan will only be as good as your DEI assessment. As you will see in our final Step 5: DEI Impact, it is often by re‐administering the same personal DEI assessment you identify here in Step 1: DEI Inventory that you evaluate results.
Personal DEI Assessment Framework
This step outlines how you can perform your own personal DEI assessment along the two lines of BCT's Personal DEI Assessment Framework shown in Figure 1.1: preferences and competences. This framework represents a subset of BCT's Comprehensive DEI Assessment Framework: The 4 P's of People, Practices, Policies, and Performance previously shown in Figure 0.5 that is focused on people only. I begin by explaining the difference between preferences and competences as these concepts will undergird everything that is covered in this step and the remainder of this book. After explaining how to assess your preferences and competences, I provide a list of personal DEI assessment tools you can employ and how to select the right one for you based on your personal DEI aims.

FIGURE 1.1 BCT's Personal DEI Assessment Framework
Understanding Preferences and Competences
To perform your own personal DEI assessment, you need to understand preferences and competences and how they differ.
Preferences
Preferences are the things you tend to think, feel, and do. A preference is a particular tendency, trend, inclination, feeling, opinion, or predisposition toward or away from something or someone. The characteristics of a preference are:
- Learned—Your preferences are learned and develop over years through your life's experiences. Through nature (innate and intrinsic factors), and nurture (environmental and extrinsic factors) you begin to make choices. According to Herrmann Global, the company that administers the Herrmann Brain Dominance Instrument® (HBDI®), “Preferences grow during our developmental years and well into our 20s and beyond as we experience continued brain development, learn different subjects in school, develop areas of interest, experience initial work activities and make career choices. Our preferences will ‘settle in’ and remain stable if our life situation and career remains stable … they can change when a significant life change occurs such as a major career shift, family changes or value‐shifting life experiences.”1
- Measurable—Preferences can be measured using an assessment tool or instrument that locates your preferences along a scale or a series of scales that create a map.
- Neutral—There is no good or bad, better or worse, or right or wrong, when it comes to preferences. They are neutral. For example, if you prefer water with lemon, and your friend prefers water without lemon, neither of you is right or wrong, just different. However, a preference is also a bias that can lead to a blind spot. A preference can direct your attention to one area and cause you to completely miss or overlook something in another area. For example, if you prefer logical thinking (i.e., left brain) over creative thinking (i.e., right brain), you may need to take deliberate steps to stretch and exercise creative thinking during a brainstorming session. Otherwise, you may have a blind spot for ideas or opportunities that could be generated. Alternatively, if you prefer abstract thinking (i.e., upper brain) over concrete thinking (i.e., lower brain), you may have to flex into the latter when called upon to develop an execution plan that requires concrete and specific action steps. Otherwise, you may have a blind spot that causes you to produce an incomplete or ineffective execution plan. So, while a preference is neither negative nor positive, it can lead to a negative outcome if it causes you to overlook or miss something important.
As it relates to improving your personal DEI, the objective is therefore not to change preferences, but rather, to shift, stretch, flex, or expand into areas outside of your preferences and mitigate blind spots. Examples of preferences that directly relate to DEI are biases, leadership style, personality, communication style, temperament, cognitive style, cross‐cultural dimensions, conflict style, and cognitive or thinking style, to name a few. A more complete list is provided later in this step in the section “A List of Personal DEI Assessment Tools.”
Competences
A competence is the ability to do something properly and successfully. It is a combination of practical and theoretical knowledge, cognitive skills, and attitudes/attributes (KSAs):
- Knowledge—Knowledge is the things you know. It includes awareness and information including facts, definitions, terminology, procedures, theories, concepts, and models. For example, knowing that a microaffirmation is a small, subtle behavior that sends the message that you value others, and being able to cite examples of common microffirmations, represent knowledge.
- Skills—Skills are the things you can do. Skills are usually learned through the transfer of knowledge. A person acquires the knowledge on how to perform a skill and then begins to physically demonstrate the skill. For example, during a course in microaffirmations you may learn that one of the best ways to affirm others is by responding constructively to different points of view, that is, showing that you understand someone else's perspective, with whom you disagree, before you offer a different point of view. However, if you never put what you have learned into practice it remains something you know (i.e., knowledge) but not something you do (i.e., a skill). Once you regularly and instinctively find yourself affirming others by responding constructively to different points of view, your knowledge has translated into a skill.
- Attitudes/Attributes—Attitudes/attributes are inherent characteristics often expressed through the things you think, do, and feel. A person's attitude or feeling about the skill will determine their motivation for applying that skill and excelling in it. In other words, just because you can do something does not mean you actually do it. If you have a negative attitude/attribute regarding how people should be treated, then even if you possess the skill of affirming others, it is unlikely you will exercise it when dealing with others. By comparison, if you have a positive attitude/attribute regarding how people should be treated, you are far more likely to develop and demonstrate the skill of affirming others when dealing with them.
In combining knowledge, skills, and attitudes/attributes, the characteristics of a competence are C.O.M.P.T.:
- Connected, relatable, and relevant to your personal or professional environment or other life experiences
- Observable and visible to you and others
- Measurable using an assessment tool or instrument that locates you on a developmental continuum
- Performance‐based and demonstrable as evidenced by the proper and successful accomplishment of tasks, assignments, exercises, activities, and the like
- Transferable and can be used in a variety of different contexts
For example, affirming others is connected to your personal and professional environment, easily observed by you and others, measurable using a self‐assessment or third‐party assessment, based on your performance and success in creating environments where others feel affirmed, and can be transferred to a variety of different contexts including parenting children, working with colleagues, coaching athletes, mentoring co‐workers, leading teams, and much more.
You can always acquire more knowledge, develop more skills, and cultivate more positive attitudes/attributes. As it relates to improving your personal DEI, the objective is therefore to improve and increase your competences. Examples of competences that directly relate to DEI are affirming others, allyship, antiracism, cultural competence, conflict resolution, and dialogue, to name a few. A more complete list is provided later in this step in the section “A List of Personal DEI Assessment Tools.”
Preferences vs. Competences
You can have a high preference for something (i.e., you love to cook) but low competence (i.e., your meals are not tasty), and you can have a low preference for something (i.e., you dread reconciling your bank account) but high competence (i.e., you maintain impeccable bank records). A preference for a given activity and the competence required to perform that activity are not the same thing. A good way to distinguish between the two is that your preferences generally reflect your nature, the things you are inclined to do, while your competences reflect your nurture, the things you are able to do. You can develop competence in any area; however, it may require more energy and motivation in an area of low preference.
Conducting a Personal DEI Assessment
A comprehensive approach to personal DEI assessment is to assess both preferences and competences. Per BCT's Personal DEI Assessment Framework shown in Figure 1.1, our approach to personal DEI assessment includes:
- People: Personal Preferences—We assess personal preferences using a range of assessment tools such as the Implicit Association Test (IAT), Herrmann Brain Dominance Instrument® (HBDI®), Intercultural Conflict Style Inventory® (ICS®), and more.
- People: Personal Competences—We assess personal competences including knowledge, skills, and attitudes/attributes (KSAs) using a range of assessment tools such as the Intrinsic Inclusion Inventory™ (I3™), Intercultural Development Inventory® (IDI®), and more.
Understanding your preferences in a particular area raises your awareness and can mitigate your blind spots. Knowing your level of competence alerts you to areas of strength and areas for improvement. Assessing both preferences and competences empowers you to increase your competences in areas of low preference and, in doing so, enhance your ability to shift and expand beyond your preferences when needed. Your preferences should never be used as an excuse for negative behavior, but rather, an explanation of behavior that can translate greater awareness into greater empowerment. For example, if you have a preference for people who are like you and someone brings to your attention that you were unintentionally dismissive of an idea from someone different from you, then that represents an opportunity to learn (and apologize). Said differently, even in situations where you have a positive intent, your preferences can cause you to have a negative impact. You must own your intent and your impact.
In the sections that follow, I walk you through how to assess your personal preferences and your competences.
Assessing Your Preferences
I begin by explaining how to assess your preferences against a preference scale, which measures one‐dimensional preferences, and then I explain how to assess your preferences against a preference map, which measures multidimensional preferences.
Understanding a Preference Scale Figure 1.2 provides a basic example of a one‐dimensional preference scale.
Left preference scale #1 and right preference scale #2 could represent any two opposing preferences, such as water with lemon and water without lemon; introversion vs. extroversion; thinking vs. feeling, logical thinking (i.e., left brain) and creative thinking (i.e., right brain); or abstract thinking (i.e., upper brain) and concrete thinking (i.e., lower brain), and those preferences could be measured anywhere between a “strong preference” for preference scale #1 on the far left and “strong preference” for preference scale #2 on the far right. For example, imagine that this scale measured your preference for water with lemon (preference scale #1) and water without lemon (preference scale #2). If you had a slight preference for water without lemon, the preference scale would appear as shown in Figure 1.3 with your measure of “slight preference” showing on the scale. You can easily imagine that the same preference scale shown in Figure 1.4 could also represent a “slight preference” for introversion over extroversion, or creative thinking over logical thinking, or other preferences pertaining to DEI.

FIGURE 1.2 Basic Example of One‐Dimensional Preference Scale (x‐axis)

FIGURE 1.3 Basic Example of a One‐Dimensional Preference Scale (x‐axis) with a Measure
Along these lines, a one‐dimensional personal DEI assessment will locate you between two different preferences scales such as your preference for Black people compared to white people; your association of men and women with science and the arts; your preference for young people compared to the elderly; or your preference for physically abled people compared to physically disabled people, for example.
As a specific example of a preference scale, I will use unconscious bias and implicit bias and an associated assessment tool, the Implicit Association Test (IAT). These work extremely well for illustrative purposes because, as mentioned earlier, a preference is literally a bias. I begin with a brief primer on unconscious bias, followed by background information and an overview of the IAT as an example of a tool that uses different preference scales to assess your biases.
Example of a Preference: Unconscious Bias Our understanding of unconscious bias has changed radically over time. In the past, we regarded our biases as aberrant, conscious, and intentional. Today, research suggests that human biases are normal, unconscious, and largely unintentional. This science of unconscious bias draws upon multiple disciplines such as biology, neuroscience, and cognitive science (cognitive bias), sociology (social cognitive theory), biology, and psychology (categories and implicit bias). From this growing body of work, here are some basics you should understand about the science of your brain and the science of bias:
- Bias Begins in the Brain—Humans face a problem: Our brains are exposed to more information at any one moment in time than we are capable of processing. Scientists estimate that, at any given moment, our brains are exposed to as many as 11 million pieces of information, but our brains can only functionally deal with about 40 things at a time. Consequently, our brains develop preferences—mental shortcuts about other people or groups—that save time and usually yield reliable results but do not always yield reliable results. Therein lies our biases. Human biases have evolved out of these preferences, shortcuts, and brain processes, whereas 95% of mental processes are unconscious; only 5% are conscious. According to Dr. Sondra Thiederman, “Unconscious Bias is a labor‐saving device. It enables you to form an opinion without having to dig up the facts.”2
- Bias is a Defense Mechanism—The human brain basically contains two different operating systems as shown in Figure 1.4. Daniel Kahneman, a Nobel Prize–winning economist, has described these systems in his book entitled Thinking, Fast and Slow.3 The first of these systems, the “Thinking Fast” system, is located in the amygdala, which is also referred to as the “primitive brain” because it is governed by survival instincts.4 The amygdala is the oldest part of the human brain and controls our “fight or flight” impulses. It receives direct input from all sensory organs, enabling it to respond rapidly to immediate threats in advance of more elaborative cognitive processing. It plays a central role in arousal, attentiveness, and triggering the flight‐or‐fight response, reacting to social threats in the same way it reacts to physical ones. The brain therefore acts as a prediction machine that is wired for threat identification. Unconscious bias, then, is the immediate, reflexive, defensive reaction to people that we regard as being not like us or “other.” Our biases are triggered by the things we can see or hear. Seeing these people or pictures of these people immediately puts our brains on alert for possible danger. Moreover, our biases are most likely to be activated when four key conditions are present: stress, time constraints, multi‐tasking, and the need for closure.
- Bias Can Be “Outsmarted”—The second of these brain systems, the “Thinking Slow” system, is located in the prefrontal cortex, which is also referred to as the “executive brain” because it contains our higher‐order reasoning and logic skills (see Figure 1.4).13 In effect, this system allows us to “outsmart our brains” by taking the time to think about whether the “other” truly represents a threat to us. For example, when we think of people as individuals instead of as members of collective social or cultural groups (“individuation”), our brains can turn off the alarm signal from the amygdala and consciously override our unconscious biases.
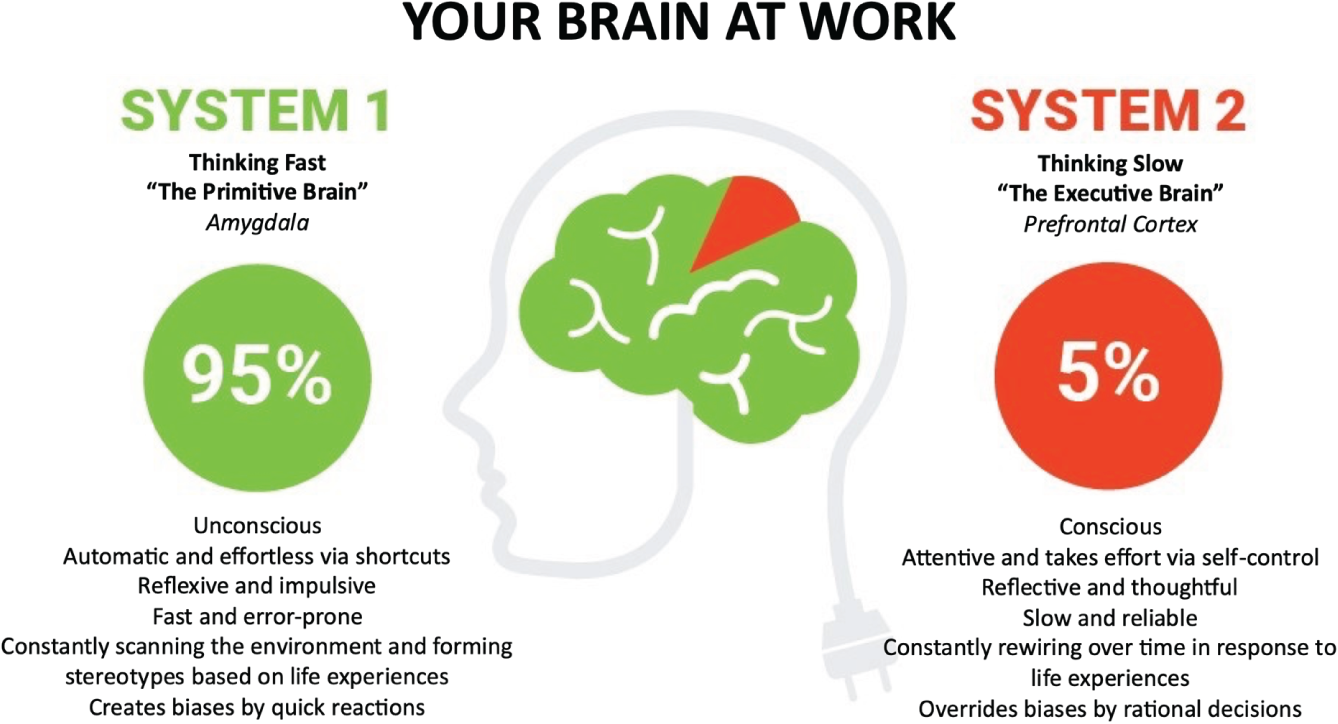
FIGURE 1.4 Neuroscience of the Brain and Bias
Just as our preferences are learned, our biases are learned. You may have a bias or a preference for certain races/ethnicities, genders, ages, religions, nationalities, and so on. Oftentimes our biases reflect our personal identity and the people who surround us. We all have biases. To be biased is to be human. Like all preferences, a bias is neither good nor bad; better nor worse; right nor wrong. And because our biases are learned they can be unlearned. Among the best ways to mitigate bias are to raise your awareness of your biases from the unconscious to the conscious realm, slow down, be objective when making decisions, and, above all, interact with people different than you. Enter the Implicit Association Test (IAT), which measures unconscious and implicit bias.
Example of a Preference Scale: Unconscious Bias and the Implicit Association Test (IAT) According to the Proceedings of the National Academy of Sciences of the United States of America (PNAS), “Harvard University experimental social psychologist Dr. Mahzarin Banaji is on the frontlines of the ‘implicit revolution,’ a paradigm shift in psychology that, since the 1980s, has been reconceiving the relationship between unconscious and conscious mental processes. Banaji and her colleague Dr. Anthony Greenwald [at the University of Washington] applied the concept to social psychology via the intertwined concepts of attitude, belief, and identity.”5 Banaji and Greenwald are co‐authors of the seminal book Blindspot: Hidden Biases of Good People. “In 1995, the duo defined implicit social cognition, introduced the term ‘implicit bias,’ and foreshadowed the Implicit Association Test (IAT) to detect and measure automatic, unintentional biases. The IAT and other methods have enabled Banaji and her colleagues to uncover hidden biases in the form of attitudes and beliefs (stereotypes) of gender, race/ethnicity, age, sexuality, and other common social group identifiers.”
The Implicit Association Test (IAT) “measures attitudes and beliefs that people may be unwilling or unable to report,” according to Project Implicit, a nonprofit organization and international collaborative of researchers who are interested in unconscious bias.6 Project Implicit was founded in 1998 by Drs. Greenwald and Banaji and Dr. Brian Nosek at the University of Virginia. The mission of Project Implicit is to educate the public about bias and to provide a “virtual laboratory” for collecting data on the internet. Project Implicit scientists produce high‐impact research that forms the basis of our scientific knowledge about bias and disparities.7 “The IAT measures the strength of associations between concepts (e.g., black people, gay people) and evaluations (e.g., good, bad) or stereotypes (e.g., athletic, clumsy). The main idea is that making a response is easier when closely related items share the same response key. We would say that one has an implicit preference for straight people relative to gay people if they are faster to complete the task when Straight People + Good / Gay People + Bad are paired together compared to when Gay People + Good / Straight People + Bad are paired together.”
The IAT is available at no cost and can be taken by visiting: implicit.harvard.edu/implicit/takeatest.html. Multiple IATs are available including the following (preference scale in parenthesis as worded by Project Implicit):
- Native American IAT (Native‐White American)
- Gender‐Career IAT (family and females/career and males)
- Weight IAT (fat/thin)
- Sexuality IAT (Gay‐Straight People)
- Weapons IAT (weapons/harmless objects)
- Gender‐Science IAT (liberal arts and females/science and males)
- Race IAT (Black‐White)
- Religion IAT (familiarity with religious terms from various world religions)
- Asian IAT (Asian‐European American)
- Transgender IAT (transgender people/cisgender people)
- Arab‐Muslim IAT (Arab Muslim/Other People)
- Skin‐tone IAT (light skin/dark skin people)
- Disability IAT (physically disabled/physically abled people)
- Presidents IAT (popularity of current U.S. president)
- Age IAT (young/old People)
We use these tests quite extensively in our DEI and unconscious bias training at BCT. I've taken most of them, and they are not for the faint of heart! Be prepared for your results, which may be sobering and surprising.
Figure 1.5 shows an example of the report generated by the Black‐White IAT.
If this were your IAT report, it would suggest that you have a slight automatic preference for white people when compared to Black people. (Note: As you can see from the results of IAT research by Project Implicit summarized in Figure 1.5, 17% of people across all racial/ethnic backgrounds have a slight automatic preference for white people over Black people.) These results would not mean you are a good or a bad person or that you necessarily treat white people better than Black people. The results would mean that you are human—we all have unconscious biases—and, because unconscious bias is a preference, it may be reflected in your behaviors in ways that you are unaware and are unintentional. Therefore, if you were interviewing a Black person for an employment position, it would be important and incumbent upon you to take deliberate steps to mitigate your racial bias to ensure fairness.
The value of a preference scale is that it allows you to see where your preferences lie along the scale and, when combined with research like that from the IAT, how you compare to others. Additionally, preference scales can be combined to create a preference map that provides even deeper insights and understandings.
From Preference Scales to Preference Maps The prior examples have depicted one‐dimensional preference scales along the x‐axis (from left to right). To help explain the difference between a preference scale and a preference map, I will offer some additional examples of one‐dimensional preference scales, only these will be depicted along the y‐axis (from top to bottom).
A second basic example of a one‐dimensional preference scale (along the y‐axis) is shown in Figure 1.6. In identical fashion to the previous example, top preference scale #3 and bottom preference scale #4 could represent any two opposing preferences and those preferences could be measured anywhere between a “strong preference” for preference scale #3 at the top and “strong preference” for preference scale #4 at the bottom. If you had a slight preference for cold water when compared to room temperature water, the preference scale would appear as shown in Figure 1.6 with your measure of “slight preference” showing on the scale. Again, you should be able to easily imagine that the same preference scale shown in Figure 1.6 could also represent a “slight preference” for thinking over feeling, or abstract thinking over concrete thinking, or other preferences pertaining to DEI.

FIGURE 1.5 Example of a One‐Dimensional Preference Scale Using the Implicit Association Test (IAT)

FIGURE 1.6 Basic Example of a One‐Dimensional Preference Scale (y‐axis) and with a Measure
Figure 1.7 shows an example of the report generated by Gender‐Science IAT and depicted along the y‐axis (from top to bottom).
If this were your IAT report, it would suggest that you have a slight automatic preference for associating men with science and women with liberal arts. (Note: As you can see from the results of IAT research by Project Implicit summarized in Figure 1.7, 18% of men and women who have completed the IAT have a slight automatic preference for associating men with science and women with liberal arts.) In other words, if you were interviewing a woman for a scientific employment position, it would be important and incumbent upon you to take deliberate steps to mitigate your gender bias to ensure fairness.
Understanding a Preference Map A preference map is a multidimensional landscape that locates you between several different preference scales. A basic example of a two‐dimensional preference map (a combined x‐axis and y‐axis) is shown in Figure 1.8.
As you can see, Figure 1.8 combines two one‐dimensional preference scales into a two‐dimensional preference map. For example, if preference scale #1 represented a preference for water with lemon and preference scale #2 represented a preference for water without lemon, while preference scale #3 represented a preference for cold water and preference scale #4 represented a preference for room temperature water, then Figure 1.8 would suggest that you have a slight preference for cold water with lemon.

FIGURE 1.7 Example of a One‐Dimensional Preference Scale Using the IAT

FIGURE 1.8 Example of a Two‐Dimensional Preference Map
Example of a Preference Map: Race IAT and Gender‐Science IAT In similar fashion to Figure 1.8, Figure 1.9 combines the previous examples of the one‐dimensional Race IAT and the one‐dimensional Gender‐Science IAT into a two‐dimension Race and Gender‐Science preference map.
If these were your results from the IAT, it would suggest that you have a slight automatic preference for white people and a slight automatic association of men with science. In other words, if you were interviewing a Black woman for a scientific employment position, it would be important and incumbent upon you to take deliberate steps to mitigate both your racial bias and your gender bias to ensure fairness. We will revisit these and other strategies in Step 3: DEI Insights and Step 4: DEI Initiatives. Moreover, jumping slightly ahead to Step 2: DEI Imperatives, which calls for you to develop personal DEI objectives and goals, based on these assessment results your personal DEI objective could be to mitigate your racial and gender biases to ensure fairness, and your personal DEI goal could be to improve your scores on a diverse 360° assessment (explained later in this step) with people of different races and genders in scientific positions.
One of the values of a preference map is that it allows you to easily and visually see interrelationships among your preferences, which mirror the DEI concept of intersectionality—that is, how different aspects of a person combine and create overlapping identities, experiences, privileges, and advantages/disadvantages. Intersectionality reflects the complex nature of our human experience and how people identify. Preference maps reflect the complex nature of our preferences against those identifiers and other salient dimensions of the human experience.
For example, I identify as Black, male, Christian, heterosexual, and able‐bodied, from among other identifiers. To understand my lived experiences is to understand how each of these identifiers has affected my lived experiences. Along the same lines, much as the previous example assessed preferences, or biases, along the lines of race/ethnicity and gender, it also offered a way of providing overlapping and layered insights to preferences, or biases, at the intersection of race/ethnicity and gender. These results can be extraordinarily valuable to understanding yourself and understanding how you may interact with others.

FIGURE 1.9 Example of a Two‐Dimensional Preference Map Using the IAT
The IAT is used to assess people against a one‐dimensional preference scale. I have employed it here to explain one‐dimensional preference scales and as a building block to explain two‐dimensional preference maps. However, Project Implicit does not provide IAT results as preference maps, only preference scales. I presented combined Race IAT and Gender‐Science IAT results for illustrative purposes as a means to explain preference maps. To help make the concept of preference maps even clearer, my next and final example will introduce an assessment tool that is specifically geared toward generating a two‐dimensional preference map: The Herrmann Brain Dominance Instrument® (HBDI®). This is another good example because HBDI®, and the Whole Brain® Thinking model upon which it is based, are both rooted in cognitive science and characterize thinking preferences and cognitive diversity, which can be universally understood and applied to anyone.
Example of a Preference Map: Whole Brain® Thinking and the Herrmann Brain Dominance Instrument® (HBDI®) According to the theories of brain specialization and lateralization, interconnected networks across different regions of the brain preside over different types of thinking (see Figure 1.10). People are said to prefer certain types of thinking over others, which is reflected in the way we communicate, what motivates us, what we learn, what we pay attention to, and more. This ultimately impacts our behaviors and how we interact at home, at work, and in the world.
Ned Herrmann, whose journey is captured in his book The Creative Brain, was the head of management education at General Electric in the 1970s and 1980s, leading GE's renowned Crotonville, New York, corporate university.8,9 His background was in physics; he was also an accomplished opera singer, painter, and sculptor. This gave him an appreciation of different styles of creativity. During the late 1970s he led the efforts to update GE's management training programs to make them more reflective of individual differences in learning and thinking style preferences, based on the groundbreaking work of Roger Walcott Sperry. Herrmann's research with GE employees was shaped by Sperry's work illustrating the different processing specialties of key areas in the brain for logical/rational thought vs. intuitive/creative thinking. Herrmann also drew insight from Paul MacLean's work understanding distinctions between the cerebral cortex and limbic systems of the brain in abstract/theoretical vs. concrete/realistic thinking, respectively. This ultimately resulted in the Whole Brain® Model with four quadrants, one for each cognitive system, which is described in Table 1.1 and depicted in Figure 1.11.

FIGURE 1.10 The Impact of Whole Brain® Thinking: Dominance, Preferences, and Behaviors
Buying a car provides a good example of how Whole Brain® thinking works as shown in Table 1.2.
The Herrmann Brain Dominance Instrument® assessment, or HBDI® survey, is comprised of 120 questions that measure thinking preferences based on the Whole Brain® model. Over 2 million HBDI® assessments have been completed worldwide, and the HBDI® has shown strong repeated evidence of validity in psychometric research, including very good test‐retest reliability and internal consistency. Face validity is extraordinarily high at over 95%. The HBDI® Profile or assessment report represents a two‐dimensional preference map and provides the following key information about you (see Figure 1.12a):
TABLE 1.1 Ned Herrmann's Four‐Quadrant Whole Brain® Model
Source: N. Herrmann, The Creative Brain (Lake Lure, NC: Ned Herrmann/Brain Books, 1989).
| Whole‐Brain® Model | |
| A (Blue) Analytical Upper‐left quadrant Purpose • Fact • What A person with a preference for activities that involve logic, analysis, fact‐finding, and quantitative reasoning. | D (Yellow) Experimental Upper‐right quadrant Possibilities • Future • Why An original and holistic person motivated by novelty, possibility, variety, oddities, and incongruities (not structure), with a preference for matters requiring intuition, integration, and synthesis. |
| B (Green) PracticalLower‐left quadrant Process • Form • When An action‐oriented person with a preference for activities that involve organization, sequencing, planning, and detail. | C (Red) Relational Lower‐right quadrant People • Feeling • Who A sensitive and feeling‐based people‐reader and mood‐minder with a preference for activities reflecting interpersonal, kinesthetic, and emotional significance. |

FIGURE 1.11 Ned Herrmann's Four‐Quadrant Whole Brain® Model
TABLE 1.2 Example of How the Whole Brain® Model Works When Buying a Car
| A (Blue) Analytical
| D (Yellow) Experimental
|
| B (Green) Practical
| C (Red) Relational
|

FIGURE 1.12A Example of a Two‐Dimensional Preference Map Using the HBDI® Profile
- Preference Code: A classification of your overall preference score in each quadrant of the Whole Brain® model. You will have a score here between 1 and 3. A score of 1 indicates a primary or high preference and relates to a score between 67 and 189 and above. A score of 2 indicates a secondary or intermediate preference and relates to a score between 34 and 66. A score of 3 indicates a tertiary or low preference and relates to a score of between 0 and 33.
- Profile Scores: Your profile scores for each quadrant under normal circumstances, ranging from 0 to 189. The higher the score for a quadrant the higher the degree of preference for that thinking style.
- Under Pressure: Your profile scores for each quadrant under pressure, ranging from 0 to 189. The higher the score for a quadrant the higher the degree of preference for that thinking style under pressure.
- Percentages: The percentages at the top and bottom show how much you prefer the cerebral mode of thinking (abstract and theoretical) vs. the limbic mode of thinking (realistic and concrete). The percentages to the left and right show how much you prefer to think (with the rational analytical and practical) versus the intuitive mode of thinking (experimental and interpersonal).
- Kite‐Shaped Figures: The kite‐shaped figure with a solid line visually depicts the four thinking preference profile scores under normal circumstances. The kite‐shaped figure with a dashed line visually depicts the four thinking preference profile scores under pressure.
If Figure 1.12a represented your HBDI® report, you would also have a slight thinking preference for cerebral (abstract and theoretical) thinking (54%) and right mode (experimental and interpersonal) thinking (52%). Under normal circumstances, you would have a “triple dominant profile” of “1211” reflecting three primary and high thinking preferences (three preference codes of 1, namely, an “analytical” profile score of 73, “relational” profile score of 68, and “experimental” profile score of 79) and one secondary and intermediate thinking preference (one preference code of 2, namely, a “practical” profile score of 61). In other words, under normal circumstances, you may have a blind spot for matters that relate to practical thinking such as organizing, planning, and attention to details. Once again, jumping slightly ahead to Step 2: DEI Imperatives, if your personal DEI objective is to stretch and expand your thinking preference into the “practical” quadrant, then your personal DEI goal could be to complete a diverse 360° assessment (explained later in this chapter) now and one year later to see if family, friends, or colleagues have observed greater intentionality toward organizing, planning, and paying attention to details.
Under pressure, your preferences would generally shift away from experimental thinking (profile score decreases from 79 to 58) and analytical thinking (profile score decreases from 73 to 58) and shift toward practical thinking (profile score increases from 61 to 82) and relational thinking (profile score increases from 68 to 82). Figure 1.12b shows the preference tilt for your general score and your under pressure score—it visually depicts how your preferences shift when operating under normal circumstances to operating under pressure. As you can more clearly see in Figure 1.12b, because your preference tilt under pressure is toward practical thinking (the lower left quadrant) such as organizing and planning, and relational thinking (the lower right quadrant) such as matters related to interpersonal relationships and intuition, you could therefore have a blind spot for experimental thinking (the upper right quadrant) such as synthesizing and conceptualizing ideas, and analytical thinking (the upper left quadrant) such as matters requiring logic and ration.
Once again, the value of a preference map like the HBDI® individual report is that it not only deepens your understanding of yourself, but that you can also generate an HBDI® pair report that compares your profile with another person, and an HBDI® team report that analyzes a group of people. This can lead to more productive communication, meetings, team building, innovation, and more. To take the HBDI® inventory and debrief your results, you must engage an HBDI® Certified Practitioner, which includes several professionals at BCT Partners.

FIGURE 1.12B Example of a Two‐Dimensional Preference Map Using the HBDI® Profile (General Score and Under Pressure)
While the preceding examples depicted two‐dimensional preference maps, preference maps can be multidimensional and depict any number of preferences using several axes and various shapes, sizes, colors, numbers, and more, on the map. Next, I will explain how to assess your competences against a continuum, which is relatively easier to explain.
Assessing Your Competences
Competence is measured by locating where you are along a developmental continuum. Unlike a preference assessment such as the IAT or HBDI®, which evaluates your tendencies to do certain things, a competence assessment evaluates your capacity or ability to do certain things as evidenced by your knowledge, skills, and attitudes/attributes (KSAs). For example, I have evidence to suggest I have a high degree of competence for public speaking. I have studied great public speakers (knowledge). I have honed my abilities as a keynote speaker, trainer, and facilitator over the past 30 years (skills). I have certain innate characteristics or gifts, such as the ability to rhyme and use alliteration (natural attributes) that I have further developed through regular practice and rehearsals (nurtured attributes), combined with the empowering belief (attitude) that I can be a great public speaker through continuous self‐improvement. In a given week, I can deliver up to 10 speeches or seminars to audiences ranging from 10 people to 10,000 people, and I consistently receive positive evaluation marks with invitations to return and speak at events again. If I were to measure my competence for public speaking, I would likely score on the higher end of the continuum. By comparison, I have a low degree of competence as a vocalist. I cannot sing or, stated differently, I could not carry a tune if it had a handle! I don't have the knowledge, skills, or attributes of a great singer and if I were to measure my competence for singing, I would likely score at the bottom of the continuum. Assessing your competences requires finding a tool or instrument that can locate you on a developmental continuum by measuring your level or degree of competence in the specific area(s) you seek to evaluate.
Understanding a Competence Continuum A competence continuum is an easy concept to understand and requires less explanation than a preference scale or map. Figure 1.13 shows a basic example of a linear competence continuum comprised of three levels from Level #1 to Level #3.
For example, imagine that Figure 1.13 depicts a continuum for public speaking or singing competence ranging from beginner (Level #1) to intermediate (Level #2) to advanced (Level #3). A competence assessment would evaluate your knowledge, skills, and attitudes/attributes (KSAs) for public speaking or singing and locate you on the continuum. Assuming you were assessed at the intermediate level (Level #2), you could then pursue ways to increase your competence to the advanced level (i.e., move up to continuum to Level #3) by increasing your knowledge, improving your skills, and/or enhancing your attitudes/attributes (KSAs) related to public speaking or singing.
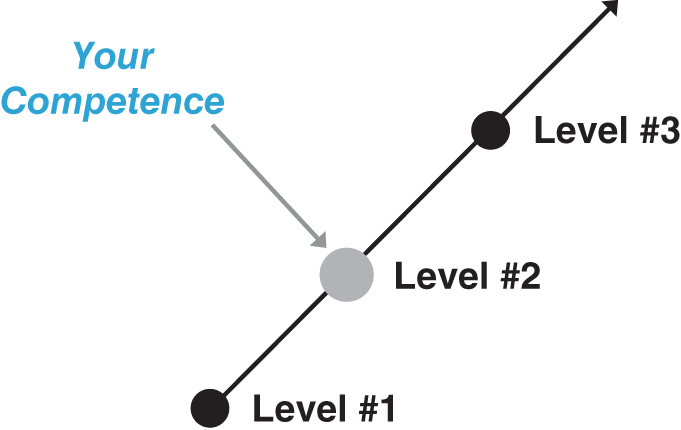
FIGURE 1.13 Basic Example of a Linear Competence Continuum
To explain a competence continuum, I will use inclusive behaviors and the Intrinsic Inclusion Inventory™ (I3™), as my first example. Inclusive behaviors naturally extend our previous discussion about unconscious and implicit bias and are a common and effective measure of DEI for people (and organizations).
Example of a Competence Continuum: Intrinsic Inclusion™ and the Intrinsic Inclusion Inventory™ (I3™) Whether it's conscious, unconscious, or implicit—to be biased is to be human. Despite this reality, some humans behave more naturally inclusively than others. Their internal motivation and drive to connect with others who are different from them is natural, intentional, and impactful. They practice key behaviors that disrupt bias and create inclusion. Based on the research outlined in their book, Intrinsic Inclusion: Rebooting Your Biased Brain, Dr. Janet B. Reid and Vincent R. Brown refer to this phenomenon as Intrinsic Inclusion™. They define the following five characteristics of people with an intrinsically inclusive mindset:10
- Naturally Seek People Who are Like and Unlike Themselves—seek to build relationships with those who are like and unlike themselves with the same amount of enthusiasm. This includes relationships with other people both personally and professionally.
- Naturally Curious—They have a natural curiosity and seek to gain a deeper understanding of people from cultures and with lived experiences that differ from their own.
- Not Afraid of Others Who are Different—They have less unjustified fear and negative stereotyping of those who are different. Therefore, they often build highly effective, diverse, and inclusive teams.
- Learn from Mistakes—They know they might make mistakes in dealing with those who are different, but that doesn't deter them from pursuing relationships. They readily acknowledge and learn from a mistake and act to rectify the situation.
- DEI Champions—They consistently deliver to their organizations the advantages of DEI, such as increased employee engagement, innovations, better problem solving, lower turnover, and bottom‐line benefits, while also appreciating and uplifting the importance of people.
Intrinsic Inclusion™ lies at the intersection of diversity, neuroscience, and bias.11 Just as our individuality develops in dimensions—internal traits (primary), external experiences (secondary), and on‐the‐job classifications (organizational)—so does our unique set of biases. Bias is an automatic reaction to both inherent and learned preferences such as food, music, and status. Curious and adventurous personality types are intrinsically more inclusive when outside the social group to which they psychologically identify (i.e., their “in‐group”) and may pause their reflexive and automatic responses to act more reflectively and deliberately. Most people are unaware of instinctive preferences—unconscious and implicit biases—and may not recognize bias as a factor in their behavior. The good news is this: We can learn to disrupt automatic thoughts and consider new information. This is the basis of a concept known as “neuroplasticity” or the ability of our brain to form, organize, and reorganize synaptic connections. Empirical data strongly indicates we can grow new neural pathways for greater neural flexibility and cognitive function including behaviors that disrupt our biases.
Based on their research to identify ways to prevent our preconceptions from hijacking our thoughts and determining our judgment, Dr. Russell Fazio of The Ohio State University and Dr. Michael Olson of the University of Tennessee found that “motivation and opportunity can be determinants of spontaneous behavior.” Their theory, known as the M.O.D.E. model (Motivation and Opportunity can be the Determinants for Spontaneous Behavior), gives us a methodology for gaining control over our thought processes and their outcomes, as shown in Figure 1.14.
Dr. Fazio refers to M.O.D.E. as a “gating mechanism.” With enough motivation (i.e., any incentive that causes a person to stop and think about outcomes such as concern for safety, sticking to a budget, avoiding embarrassment, or important new information) and the opportunity (i.e., people having the resources to think clearly and consciously, meaning they aren't tired, in a hurry, feeling stereotyped, or distressed in other ways), our brains can shut the gate on, or interrupt, an automatically activated attitude. This allows new ideas to inform deliberate, better‐informed decisions and actions. With motivation and opportunity, people can develop a mindset of curiosity and intrinsic inclusion and embrace what Dr. Reid and Brown have popularized as “The Power of the Pause”—a deliberate pause that has power to stop automatic reactions, allowing our brain to consider biases and new information, and then to control decisions. Dr. Reid and Brown have identified the following four behaviors—or “inclusion accelerators”—that can cultivate the Power of the Pause, upend patterned thinking, and may reboot our biased brain (see Figure 1.15):
- Shared Trust occurs when a significant relationship forms between people different from each other that allows them to be vulnerable. It has three components:
- Enables learning and growth
- Equally shared among all parties
- Shared definition and framework
- Respectful Empathy occurs when a person embodies the perspectives and feelings of another and chooses to bond with them. It is not sympathy. Respectful empathy has three components:

FIGURE 1.14 The M.O.D.E. Model (Motivation and Opportunity Can Be the Determinants for Spontaneous Behavior) of Intrinsic Inclusion™
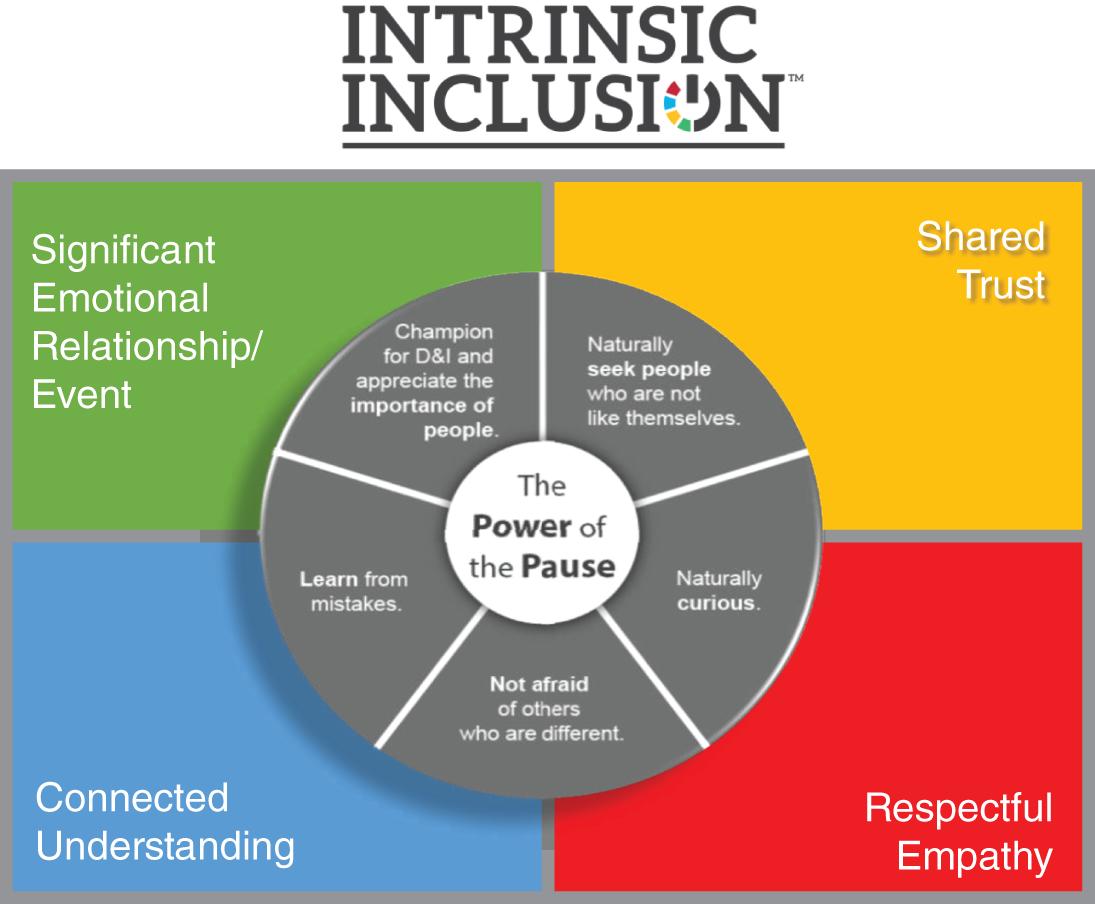
FIGURE 1.15 The Five Characteristics and Four Inclusion‐Accelerating Behaviors of Intrinsic Inclusion™
- Cognitive empathy: intuitively knowing how another thinks
- Emotional empathy: understanding how another feels
- Compassionate empathy: wanting to connect with and understand another deeply
- Significant Emotional Relationship/Event occurs when people who are different from one another develop deep respect, become close, and are concerned for one another. It has three components:
- Life‐altering impact
- Emotional connection
- Meaningful and enduring
- Connected Understanding occurs when two or more people understand and appreciate how others different from themselves prefer to communicate and process information. It has three components:
- Mutual respect and understanding
- Communicating in ways that ensure all voices are heard equally
- Heightened attentiveness to the styles of others
Biases will always exist, but in changing how you think, feel, and act, these four inclusion‐accelerating behaviors can also change your personal and professional relationships and performance. By seeking experiences and opportunities to demonstrate these behaviors, you will lead a more intrinsically inclusive existence. Intrinsic Inclusion™ powerfully illuminates how individuals and teams can disrupt unconscious biases—unlocking improved decision making, communication, collaboration, innovation, inclusion, and belonging.
Dr. Reid, Vincent Brown, LaToya Everett, Patricia Melford, John Grooms, and BCT's Peter York, Dr. Miriam Sarwana, Dr. Astrid Hendricks, Phylicia Thompson, Dr. Lisa Kulka, E'Driana Berry and I conceptualized and developed the Intrinsic Inclusion Inventory™ (I3™). It is a statistically valid and reliable psychometric instrument that measures the competence or ability of people and organizations to be intrinsically inclusive by assigning a score or index to each of the seven different roles that inform the inclusion accelerators.
For example, looking slightly ahead to Step 2: DEI Imperatives once again, if your personal DEI objective is to improve your competence with demonstrating inclusive behaviors, then your personal DEI goal could be to complete the I3™ assessment six months apart and increase your score from one level to the next.
I3™ offers individual and group reports, which deepen your understanding of yourself and others such as colleagues, coworkers, and close friends and family. This can help you to become more effective in leading and working with others more inclusively, optimizing teams, and improving organizational performance.
Next, I will use intercultural competence and the Intercultural Development Inventory® (IDI®) as another example of a competence continuum. As its name implies, intercultural competence is not only a competence but also a concept that can be universally applied across multiple cultures and cultural contexts.
Example of a Competence Continuum: Intercultural Competence and the Intercultural Development Inventory® (IDI®) According to IDI, LLC, intercultural competence is defined as “the capability to shift cultural perspective and appropriately adapt behavior to cultural differences and commonalities. Intercultural competence has been identified as a critical capability in a number of studies focusing on overseas effectiveness of international sojourners, international business adaptation and job performance, international student adjustment, international transfer of technology and information, international study abroad, and inter‐ethnic relations within nations.”12
The Intercultural Development Continuum™ (IDC™) describes orientations toward cultural difference and commonality that are arrayed along a continuum from the “monocultural mindsets” of Denial and Polarization through the transitional orientation of Minimization to the “intercultural or global mindsets” of Acceptance and Adaptation. The capability of deeply shifting cultural perspective and bridging behavior across cultural differences is most fully achieved when one maintains an Adaptation perspective. This continuum is adapted from the Developmental Model of Intercultural Sensitivity originally proposed by Milton Bennett and includes the following five orientations:
- Denial—An orientation that recognizes more observable cultural differences (e.g., food), but may not notice deeper cultural difference (e.g., conflict resolution styles) and may avoid or withdraw from such differences.
- Polarization—An orientation that views cultural difference in terms of “us” and “them.” This ranges from:
- Defense—a more uncritical view toward one's own cultural values and practices coupled with an overly critical view toward other cultural values and practices, to
- Reversal—an overly critical orientation toward one's own cultural values and practices and an uncritical view toward other cultural values and practices.
- Minimization—An orientation that highlights cultural commonality and universal values and principles that may also mask deeper recognition and appreciation of cultural differences.
- Acceptance—An orientation that recognizes and appreciates patterns of cultural difference and commonality in one's own and other cultures.
- Adaptation—An orientation that can shift cultural perspective and change behavior in culturally appropriate and authentic ways.
Dr. Mitchell R. Hammer, president of IDI, LLC, conducted the cutting‐edge research that resulted in the Intercultural Development Inventory® (IDI®).13,14 The IDI® measures how a person or a group of people tends to think and feel about cultural difference stemming from any aspect of diversity, human identity, and cultural difference. It assesses the core mindset regarding diversity and cultural difference and determines your level of intercultural competence along the IDC™. It is a statistically valid and reliable psychometric instrument that measures one's current degree of intercultural sensitivity and intercultural competence affects or “shows up” in your interactions (e.g., cross‐cultural communication) with other people.
Figure 1.16 provides an example of an IDI® report, which provides the following key information:
- Perceived Orientation (PO): A measure of how you rate yourself in terms of your own capability to adapt to cultural differences along the developmental continuum.
- Developmental Orientation (DO): Your primary orientation or how you are more likely to experience cultural differences and similarities. This is a more accurate measure of how you experience and adapt to cultural differences and similarities. This is also how others likely experience you.
- Orientation Gap: This reflects the difference between your Perceived Orientation and the Developmental Orientation. Your Perceived Orientation score may be higher than the Developmental Orientation score or vice versa. This indicates that you may be overestimating or underestimating your level of intercultural competence.
If this were your IDI® report, based on your development orientation (DO) score of 124.26, your primary orientation toward cultural differences would be within “Acceptance,” reflecting an orientation that recognizes and appreciates patterns of cultural difference in your own culture and other cultures in values, perceptions, and behaviors. Once again, looking ahead to Step 2: DEI Imperatives, if your personal DEI objective is to improve your intercultural competence and ability to navigate difference, then your personal DEI goal could be to increase your IDI® score from Level 3: Minimization to Level 4: Acceptance in one year.

FIGURE 1.16 Example of a Competence Continuum Using the IDI®
The IDI® also offers individual and group reports. This can help you to become more effective in leading, working in, and succeeding in an increasingly diverse domestic and global workplace and marketplace, and enable your team to do the same. To take the IDI® assessment and debrief your results, you must engage an IDI® Qualified Administrator, which includes several professionals at BCT Partners.
As a final example of a competence continuum, I will use antiracism and the Antiracist Style Indicator (ASI), which measure antiracist competence.
Example of a Competence Continuum: Antiracism and the Antiracist Style Indicator (ASI) “Being an antiracist involves making intentional and conscious decisions to support policies, practices and procedures that promote racial equity in housing patterns, criminal justice system, wealth distribution, education, healthcare, and voting rights. Being an antiracist is also a dynamic process that plays out in your everyday life in your attitudes and beliefs. Beyond working to dismantle systemic racism, being an antiracist involves how you express yourself as a racial person and how you interact within a multiracial society with others who do not share your same racial identity,” according to Deborah L. Plummer, author of the Antiracist Style Indicator (ASI).
“Rooted in Gestalt psychology principles and family systems theory, the 70 items of the Antiracist Style Indicator (ASI) reflect the attitudes, knowledge and skills [KSAs] for being an effective antiracist.” The ASI assigns a score in each of three categories—Underfunctioning, Functioning, Overfunctioning—that represent the degree to which these characteristics show up in your lifestyle. Underfunctioning and Overfunctioning both represent lower levels of competence while Functioning represents the highest level of competence as shown in Figure 1.17. “Functioning antiracists are effective disrupters and eradicators of racism who turn us and them into we. They recognize and understand the structures that shape and maintain racism. They understand racial dynamics and treat associated tensions as challenges to be mastered with education and learning and work to stay updated on contemporary scholarship,” says Plummer, “The ASI does not predict success or failure in being an antiracist. As a self‐assessment tool, it is designed to help you focus on specific aspects of your personality, behavior, skills, and knowledge as areas of strength and weaknesses. You can make your own interpretations about your scores and determine choices for your growth areas. It is an ipsative measure rather than a norm‐based assessment, meaning your score only applies to you and you can take it again over time to see if your scores change and improve.”15

FIGURE 1.17 Example of a Competence Continuum Using the Antiracist Style Indicator (ASI)
Assessing Your Preferences and Competences
As mentioned previously, the value of personal DEI assessments like the IAT, HBDI®, ASI, I3™, IDI®, and the like, is the ability to generate a profile that fosters understanding and delivers insights, and to establish a baseline from which to establish personal DEI objectives and goals, which is the basis for Step 2: DEI Imperatives. I strongly recommend that you assess both your preferences and your competences to engender a comprehensive personal DEI journey and to empower yourself with insights into your blind spots, areas of strength, and areas for improvement.
Once you know your preferences, you can establish objectives to shift, stretch, flex, or expand into areas of low preference. Once you know the level at which your competence is assessed, you can more easily begin to chart a path for where you aspire to be and, of equal importance, where you can realistically be in a certain amount of time. Although it is possible, it is less likely that you will skip over several levels of a competence continuum in a short period of time. So, your short‐term to medium‐term personal DEI objectives and goals should necessarily be centered on what it will take to get from one level to the next. When you assess both preferences and competences, you can also focus certain efforts on increasing competence in areas of low preference, thereby further enhancing your ability to stretch and expand when needed. Assessing your preferences and competences helps paint a complete picture.
Leveraging Diverse 360° Assessments An excellent tool to include in your personal DEI assessment is a 360° assessment. A 360° assessment typically combines a self‐assessment with assessments from other people representing three levels of hierarchy: (1) a lower level (subordinate) such as direct reports, (2) a peer level such as colleagues, and (3) a higher level (super‐ordinate) such as a manager or supervisor. Its named is derived from obtaining comprehensive feedback across all three angles and perspectives. I am a big fan of 360° assessments for several reasons.
First, 360° assessments are great because they can assess both preferences and competences including those centered on emotional intelligence. You essentially get a “two‐for‐one” benefit by taking one assessment to cover both preferences and competences. Second, they go wide and deep. They assess a wide range of competences at the same time, such as leadership, communication, productivity, teamwork, and development of others. They also provide deep feedback in each of these areas by allowing you to compare your self‐assessment to the assessments of others, which can offer interesting comparisons between your perspective on your strengths and areas for improvement and the assessments of others. Third, they can often be administered anonymously, thus increasing the likelihood of honesty and transparency. Finally, they can be easily combined with other assessments. I recommend combining a 360° assessment with more focused and specialized assessments such as the IAT, HBDI®, ASI, I3™, IDI®, and the like.
At BCT, we put a DEI spin on 360° assessments. In place of, or in addition to, seeking feedback from a subordinate, peer, and super‐ordinate, we recommend seeking feedback from colleagues who are different from you with respect to race/ethnicity, gender, age, physical ability, gender identity, sexual orientation, religion, national origin, languages spoken, and beyond. We refer to this as a diverse 360° assessment.
To perform a diverse 360° assessment, you can use a formal 360° assessment tool like the ones highlighted in the next section, or you may opt for a less formal approach: You could easily develop your own survey or questionnaire in the areas of greatest interest to you for others to complete (moreover, several of the formal 360° assessment tools allow you to add your own questions) or you could simply arrange a day/time to meet with each person you have selected to be a part of your 360° assessment, elicit their feedback verbally, and take notes. My point here is that a diverse 360° assessment can be a simple, powerful, and invaluable way to conduct a personal DEI assessment. You will be amazed at the insights you can glean from others when you seek diverse perspectives on how well you function in diverse settings.
As you will see later, for objectives that may be seemingly difficult to measure such as being an ally or an antiracist, a diverse 360° assessment will serve you well as a tool for measuring progress and evaluating results. Moreover, it is also an excellent fail‐safe for personal DEI assessment. If you have trouble determining or deciding the right personal DEI assessment for you, then you can always rely on a diverse 360° personal assessment to meet your needs.
A List of Personal DEI Assessment Tools
You are now fully versed in the differences between assessing personal preferences and assessing personal competence. A list of personal DEI assessments of preferences and competences can be found in Table 1.3 with the following headings:
- Name of Assessment Tool—The name of the assessment tool.
- What Does It Measure?—A summary of what the assessment tool proclaims to measure.
- When Should You Use It?—A short synopsis of the circumstances under which you should consider using this assessment tool.
TABLE 1.3 List of Personal DEI and Related Assessments
Name of Assessment Tool What Does It Measure? When Should You Use It? Valid?
Reliable?Individual & Team Report?
(Individual/Team)
Is There a Cost?
(Free/Fee/Both)
Is a Certified Practitioner Required? (Required/Not Required/Optional)?Personal Preferences Implicit Association Test (IAT) Implicit bias Designed to measure beliefs and attitudes that individuals may be unwilling or unable to report. The IAT measures strengths of associations between concepts, evaluations, and stereotypes.
implicit.harvard.edu.Not Valid
Not ReliableIndividual
Fee
Not RequiredHermann Brain Dominance Instrument (HBDI®) Thinking preferences Thinking styles assessment tool used to identify one's preferred approach to emotional, analytical, structural, and strategic thinking.
thinkherrmann.comValid
ReliableIndividual & Team
Fee
RequiredIntercultural Conflict Style® (ICS®) Inventory Intercultural conflict style Assesses culturally learned approaches for communicating information and resolving conflict in four styles: discussion, engagement, accommodation, and dynamic.
icsinventory.comValid Reliable Individual & Team
Fee
RequiredCultural Values Profile Cultural values Assesses 10 cultural values that differ greatly between nationalities, ethnicities, religions, age groups, and other demographic classes of people. Measures individual preferences that influence approaches to life, school, and work.
culturalq.comValid
ReliableIndividual & Team
Fee
Not RequiredMyers‐Briggs Type Indicator® (MBTI®) Personality Personality assessment designed to identify natural preferences in how one directs and receives energy, how one takes in information, how one decides and comes to conclusions, and how one approaches the outside world.
themyersbriggs.comValid
ReliableIndividual & Team
Fee
Not RequiredAlternatives to MBTI® (TypeFinder®, Type Explorer®, Jung Typology Test™, and Personality Style Instrument) Personality Personality assessments designed to identify natural preferences using the 16 personality types referenced in the Myers‐Briggs Type Indicator.
www.typefinder.com
www.16personalities.com
www.humanmetrics.com
kilmanndiagnostics.comValid
ReliableIndividual & Team
Varies
Not RequiredKeirsey Temperament Sorter (KTS) Temperament Designed to help one understand self and others by classifying four personality types across four scales of behavior: artisan, guardian, idealist, rational.
www.keirsey.comValid
ReliableIndividual (Free & Fee)
Team (Fee)
OptionalDiSC Assessment Personality Assessment used to determine personality type and behavior style by ranking four areas of behavior: dominance, influence, steadiness, conscientiousness.
www.discprofile.comNot valid
ReliableIndividual & Team
Fee
Not RequiredBirkman Colors Personality and behavior Designed to help one understand self and others measured by four benchmarks: usual behaviors, interests, needs, and stress behaviors.
birkman.comValid
ReliableIndividual & Team
Fee
OptionalHogan Assessments (talent development) Personality and Performance Assessment tools that cultivate strategic self‐awareness so employees, leaders, and your organization will all reach their highest potential.
www.hoganassessments.com/talent-development/Valid
ReliableIndividual & Team
Fee
RequiredThomas‐Kilmann Conflict Mode Instrument (TKI®) Conflict mode Assessment tool that helps individuals understand how different conflict styles affect personal and group dynamics using five conflict‐management modes: competing, collaborating, compromising, avoiding, and accommodating.
kilmanndiagnostics.comValid Reliable Individual & Team
Fee
Not RequiredHartman Value Profile (HVP) Thinking style Critical thinking assessment measuring an individual's problem‐solving strengths, problem‐solving struggles, and the ability to avoid blind spots related to situational bias.
www.valuepartnersconsulting.comValid
ReliableIndividualFeeRequired SOCIAL STYLES™ Assessment Acting, thinking, and making decisions Designed to measure how one displays behavior patterns categorized in four styles: driving, expressive, amiable, and analytical.
www.tracom.comValid
ReliableIndividual & Team
Fee
OptionalInsights Discovery Preferred behaviors, strengths, and challenges Based on four colors, insights discovery helps individuals learn more about their preferred behaviors, the strengths they bring, and the challenges they're likely to face.
www.insights.comValid
ReliableIndividual & Team FeeNot Required Personal Competences Intrinsic Inclusion Inventory™ (I3™) Inclusive behaviors Measures the competence or ability of people and organizations to be intrinsically inclusive according to the following four behaviors (“inclusion accelerators”): Shared Trust, Respectful Empathy, Significant Emotional Relationship/Event, and Connected Understanding. These behaviors can cultivate the Power of the Pause, upend patterned thinking, and reboot our biased brain.
www.intrinsicinclusion.comValid
ReliableIndividual & Team
Fee
Not RequiredIntercultural Development Inventory® (IDI®) Intercultural competence Assessment tool used to assess the capability to shift cultural perspectives and appropriately adapt behavior to culture differences and commonalities.
idiiventory.comValid Reliable Individual & Group
Fee
Not RequiredAntiracist Style Indicator (ASI) Efficacy to dismantle racism Designed to measure an individual's orientation toward racist behavior.
asi.dlplummer.comNot Valid
Not ReliableIndividual
Fee
Not RequiredInternalized Racism Inventory (IRI) Attitudes and behaviors toward racism Designed to assess discriminatory interests, values, attitudes, and behaviors based on race, ethnicity, or national origin.
www.culturalbridgestojustice.orgNot Valid
Not ReliableIndividual
Fee
Not RequiredInternalized Sexism Inventory (ISI) Attitudes and behaviors toward sexism Designed to assess discriminatory interests, values, attitudes, and behaviors based on sex and gender.
culturalbridgestojustice.orgNot Valid
Not ReliableIndividual
Fee
Not requiredThe White Privilege Test (WPT) (26) Awareness of white privilege Tool used to assess the presence of privilege based on common interactions.
monitorracism.euNot Valid
Not ReliableIndividual
Fee
Not RequiredThe White Privilege Test (WPT) (30) Awareness of white privilege Designed to explore the presence of white privilege and used to build racial consciousness as a personal and professional development exercise.
www.theantiracisteducator.comNot Valid
Not ReliableIndividual
Fee
Not RequiredThe White and Male Privilege Test (WMPT) (46) Awareness of white and male privilege Tool used to assess the presence of white privilege and male privilege based on common interactions.
www.nationalseedproject.orgNot Valid
Not ReliableIndividual
Fee
Not requiredIntercultural Awareness Profiler (IAP) Intercultural awareness A diagnostic questionnaire designed to assess the personal orientation of choices that an individual makes when resolving intercultural business issues.
www3.thtconsulting.com/tools/intercultural-awareness-profiler/Valid
ReliableIndividual
Fee
Not RequiredIntercultural Competence Profiler (ICP) – Self Assessment and Observers’ (360°) Intercultural competence A developmental tool that measures an individual's competence in dealing with cultural differences in a bias‐free manner, providing immediate insights on the competence to Recognize, Respect, Reconcile, and Realize cultural differences (4R).
www3.thtconsulting.com/tools/intercultural-competence-profiler-icp/Valid
ReliableIndividual
Fee
Not RequiredThe Passions, Awareness, Skills, and Knowledge Inventory (PASK) Self‐efficacy to discuss differences Assessment tool used to measure an individual's current strengths as well as areas of improvement with intention to promote cultural humility and dialogue about differences.
sparqtools.org/areyoureadytotalk-instructions/Not Valid
Not ReliableIndividual
Fee
Not RequiredCliftonStrengths Talent Talent assessment designed to identify an individual's top five, innate strengths that fall under the domains of strategic thinking, relationship building, influencing, and executing.
www.gallup.com/cliftonstrengthsValid
ReliableIndividual & Team
Fee
Not RequiredStandOut Strengths Assessment Traits and talents Work‐focused talent assessment designed to identify an individual's top two strength roles using a series of situational judgment scenarios.
marcusbuckingham.comValid
ReliableIndividual & Team
Fee
Not RequiredInclusive Leader Self‐Assessment (ILSA) Inclusive leadership Reflection and learning tool used to measure characteristics of inclusive leadership and where an individual falls on the Inclusive Leadership Continuum: aware, unaware, active, advocate.
inclusiveleaderassessment.comUnknown Individual
Fee
Not required360° Inclusive Leader Assessment Inclusive leadership Gathers feedback and self‐assessment results in specific goals supporting the ability to be visible, effective change agents. wmfdp.com/customized-solutions/ Unknown Individual
Fee
UnknownLife Styles Inventory™ (LSI)
[includes 360°]Thinking and behavior Designed for managers, leaders, students, and those in professional and technical roles, the LSI empowers people to actualize their potential and contribute to the success of their organization.
humansynergistics.comValid
ReliableIndividual
Fee
Not RequiredSTAR 360 Leadership Survey tool that utilizes nine executive leader competences to measure an individual's proficiency in critical leadership skills.
www.star360feedback.comNot Valid
Not ReliableIndividual
Fee
Not RequiredCheckPoint 360°® Leadership Leadership assessment tool designed to help managers identify and prioritize development opportunities and leadership skill‐building.
assessmentleaders.comValid
ReliableIndividual
Fee
Not RequiredSpiderGap (360°) Performance Feedback tool that identifies priorities for professional development using customized questionnaires and templates based on organizational goals.
www.spidergap.comNot Valid
Not ReliableIndividual
Fee
Not RequiredSurveySparrow (360°) Performance Designed to assess strengths, areas of improvement, blind spots, and hidden strengths to promote personal and professional development.
www.surveysparrow.comNot Valid
Not ReliableIndividual
Fee
Not RequiredCulture Amp (360°) Effectiveness Employee engagement, performance, and development tools—all in one intuitive platform—including Individual Effectiveness 360, Manager Effectiveness 180, Leadership Effectiveness 360, and Team Effectiveness assessments.
www.cultureamp.comUnknown Individual & Team
Fee
Not RequiredVIA Survey of Character Strength Traits Survey tool designed to assess an individual's character strengths using 24 predetermined traits.
www.viacharacter.orgValid
ReliableIndividual
Fee
Not RequiredGlobal Leadership Survey (GLS) Leadership Assessment tool for understanding leadership styles designed around four dimensions—values, action, ideas, and people.
www.globaldiversityservices.comValid
ReliableIndividual
Fee
Not RequiredPersonal Preferences and Competences Cultural Intelligence (CQ) Pro Assessment Cultural values and cultural intelligence (CQ) Assesses cultural values—10 cultural values that differ greatly between nationalities, ethnicities, religions, age groups, and other demographic classes of people—and cultural intelligence (CQ)—a skill set that predicts effectiveness in diverse situations by measuring capabilities in four distinct areas: CQ Drive, CQ Knowledge, CQ Strategy, and CQ Action.
culturalq.comUnknown Individual
Fee
Not Required360 Inclusive Leadership Compass (ILC) Inclusive leadership effectiveness A multi‐rater feedback tool that measures Inclusive Leadership effectiveness and identifies everyday actions to support behavioral change across the areas of self (embrace), others (empower), team (embed), and organization (enable).inclusiveleaershipcompass.com Valid
ReliableIndividual & Team
Fee
Not RequiredEmotional Quotient Inventory (EQ‐I 2.0) Emotional intelligence The Emotional Quotient Inventory 2.0 (EQ‐i 2.0) measures an individual's emotional intelligence including five areas of emotional and social functioning. It also provides a deeper understanding of how the results affect a participant's workplace performance (conflict resolution, change management, teamwork, decision making, and more).
www.eiconsortium.orgValid
ReliableIndividual & Team
Fee
Not RequiredEmotional Quotient Inventory 360 (EQ‐360) Emotional intelligence Using the same model as the EQ‐i 2.0, the EQ‐360 allows leaders to receive feedback from peers, managers, direct reports, and others on how they leverage their emotional intelligence.
www.eiconsortium.orgValid
ReliableIndividual
Fee
Not RequiredSix Seconds Emotional Intelligence Assessment (SEI®) Emotional intelligence The Six Seconds Emotional Intelligence Assessment (SEI®) is a complete solution for EQ measurement and development that equips people with a framework for putting emotional intelligence into action. www.6seconds.org ValidReliable Individual & Team
Fee
Not RequiredSix Seconds Emotional Intelligence Assessment (SEI®) 360 Emotional intelligence Using the same model as the SEI®, the SEI® 360 is an in‐depth, multi‐rater feedback tool that provides clear, valuable feedback in a framework for action.
www.6seconds.orgValid
ReliableIndividual
Fee
Not RequiredGlobal Diversity Survey (GDS) Interpersonal and self‐awareness Utilizes the head (insight), heart (inclusion), and hands (adaptation) model to assess awareness of and understanding of self, others, and the world.
www.globaldiversityservices.comNot Valid
Not ReliableIndividual
Fee
Not RequiredGlobal Gender Intelligence Assessment (GGIA) Gender intelligence Assessment and understanding of the cognitive, emotional, and behavioral aspects of gender.
www.globaldiversityservices.comNot Valid
Not ReliableIndividual
Fee
Not RequiredAEIOU Single‐Rater Negotiation and conflict management Assesses communication behaviors during conflict, as well as the ability to negotiate when conflict arises. The assessment measures on five scores: Attacking, Evading, Informing, Opening, and Uniting (AEIOU).
www.globaldiversityservices.comNot Valid
Not ReliableIndividual
Fee
Not RequiredAEIOU Multi‐Rater Negotiation and conflict management Using the same model as the AEIOU Single‐Rater, the AEIOU Multi‐Rater includes feedback from up to five people (360°).
www.globaldiversityservices.comNot Valid
Not ReliableIndividual
Fee
Not RequiredThe Energy Leadership™ Index (ELI) Perception and approach to work and life Assesses the way a person views the world, and turns it into something tangible—a metric that you can see and feel and even reevaluate in the future.
www.energyleadership.com/assessmentValid
ReliableIndividual
Fee
RequiredTo learn more about Intrinsic Inclusion™, reference the book Intrinsic Inclusion: Rebooting Your Bias Brain by Dr. Janet Reid and Vincent Brown (Cincinnati, OH: New Phoenix Publishing, 2021).
To learn more about emotional intelligence, reference the book Bar‐On Emotional Quotient Inventory, Technical Manual (A Measure of Emotional Intelligence), by Dr. Reuven Bar‐On (Toronto: Multi‐Health Systems, 2000). - Validity—The extent to which the assessment tool measures what it was designed to measure (“valid”). This may include both construct validity, the extent to which the assessment tool measures a theoretical phenomenon that is not easily observed, and face validity, the extent to which users and professionals feel confident, superficially and subjectively, that the assessment tool delivers on its promise.
- Reliability—The extent to which the assessment tool repeatedly and consistently measures what it was designed to measure (“reliable”). Most widely used assessment tools have undergone a process of confirming validity and reliability. This information is made publicly available and describes the methods and evidence used to support the validity and reliability of the assessment tool as well as appropriate and inappropriate uses of the assessment tool.
- Individual and Team Report—Does the vendor offer reports for individuals only (“individual only”)? Individual and aggregated reports for teams (“individual & team”)?
- Is There a Cost?—Is the assessment available at no cost (“free”), or is the assessment only available at a cost (“fee”), or is the individual assessment available at no cost while the team assessment is available at a cost (“both” free and fee).
- Is a Certified Practitioner Required?—In order to take the assessment and/or access the report, are you required to work through a certified practitioner or qualified administrator or other approved third‐party? Yes (“required”), no (“not required”), or is a certified practitioner available but not required (“optional”)?
Once again, while certain personal DEI journeys may only require an assessment of your preferences or competences, I strongly recommend that you assess both your preferences and your competences to paint a complete picture of your DEI profile and baseline.
Choosing the Right Personal DEI Assessment Tool for You
Now it is time to choose the right tools for your personal DEI assessment that align with your personal DEI aims.
Your personal DEI aims will naturally suggest whether you will need to assess your preferences or your preferences and competences (I recommend both). For example, if your personal DEI aim is to recognize your own biases, then you will need to assess your preferences, at a minimum. If your personal DEI aim is to improve your inclusive behaviors or intercultural competence, then you will need to assess your competences. By comparison, if your personal DEI aim is to mitigate your own biases, then you will need to both assess your preferences (to recognize your biases) and your competences (after having recognized your biases, to have the ability to mitigate them). Once you've determined whether you need to assess preferences or preferences and competences, you must complete three tasks.
Task 1: Choose Initial Personal DEI Core Preferences and Competences The first task is to choose initial personal DEI core preferences and DEI core competences, that is, the specific preferences and competences you will focus on as a part of your DEI journey. Table 1.4 provides a list of 21 personal DEI core preferences and competences—“The ABCDEs of DEI”—and their definitions. You should choose preferences and competences that are most aligned with your DEI aims. And much like your DEI aims, as long as your choices are directionally correct, you will be just fine for now. You will have the opportunity to not only refine and finalize your choices in Step 4: DEI Initiatives, but you will also have the opportunity to inform those choices based on promising and proven practices summarized in Step 3: DEI Insights.
TABLE 1.4 List of Personal DEI Core Preferences and Competences (“The ABCDEs of DEI”)
| Category | Related to Preference? To Competence? | Definition |
|---|---|---|
| 1. Awareness of Self* | Preference and Competence | Consciousness of one's own social identities, cultural influences, behaviors, values, and preferences and their relevance to internal and external interactions. |
| 2. Awareness of Others* | Preference and Competence | Consciousness of other's social identities, cultural influences, behaviors, values, and preferences and their relevance to internal and external interactions. |
| 3. Appreciation of Self* | Preference and Competence | Acknowledging the value and significance of one's own identities and contributions. |
| 4. Appreciation of Others* | Preference and Competence | Acknowledging the value and significance of other's identities and contributions. |
| 5. Affirming Others | Competence | Displaying approval, encouragement, or recognition of someone, their actions, or contributions. |
| 6. Advocacy | Competence | Understanding and communicating the needs of others in support of a specific interest or cause. |
| 7. Allyship | Competence | Action, behaviors, or practices in equal partnership with a marginalized group to actively and purposefully challenge, dismantle, and eliminate the personal (beliefs), interpersonal (behaviors), institutional (organizational culture), and systemic (societal structures) barriers to advance their interests. |
| 8. Antiracism | Competence | Action, behaviors, or practices in equal partnership with racial group to actively and purposefully challenge, dismantle, and eliminate racist beliefs (personal racism), behaviors (interpersonal racism), policies and practices (institutional racism), and societal systems (structural racism). |
| 9. Bias Awareness | Preference and Competence | Acknowledging prejudices or unsupported judgments of individuals or groups. |
| 10. Bias Mitigation | Competence | Decreasing or preventing the occurrence and/or impact of prejudices or unsupported judgments of individuals or groups. |
| 11. Coaching, Mentoring, and Sponsoring | Competence | Coaching—facilitating skill development by providing clear behavioral‐specific feedback, and by making or eliciting specific suggestions for improvement in a manner that builds the confidence and maintains the self‐esteem of others. Mentoring—facilitating a reciprocal learning partnership by establishing mutually defined goals to develop skills, abilities, knowledge, or thinking over an extended period. Sponsoring—utilizing power and influence to advocate for an individual's promotion or advancement that aligns with specific personal and/or professional goals. |
| 12. Collaboration | Competence | The ability to work with two or more people for a common purpose. |
| 13. Common Language | Competence | The ability to define and describe common terms such as diversity, equity, inclusion, belonging, bias, prejudice, discrimination, racism, antiracism, allyship, privilege, and more. |
| 14. Cross‐Cultural Communication | Competence | The ability to recognize both differences and similarities in how cultural groups communicate and exchange information and meaning with people from different cultural backgrounds to effectively engage in a given context. |
| 15. Courage | Competence | The ability to respond or act despite the presence of fear. |
| 16. Cultural Adaptation | Competence | The ability to modify behavior or overcome changes with consideration of language, culture, environment, and context. |
| 17. Cultural Competence | Competence | The ability to understand, appreciate, and interact with people from cultures or belief systems different from one's own. |
| 18. Cultural Humility | Preference and Competence | Respecting and not having a sense of superiority toward other people's cultural backgrounds.16 |
| 19. Cross‐Cultural Conflict Resolution | Competence | The ability to recognize both differences and similarities in how cultural groups resolve conflict and objectively approach a challenge or issue between individuals from different cultural backgrounds. |
| 20. Dialogue | Competence | The ability to exchange opinions and/or ideas with two or more people leading to greater mutual understanding. |
| 21. Intelligence | Preference and Competence | The ability to understand, use, and manage one's own emotions in positive ways to relieve stress, communicate effectively, empathize with others, overcome challenges, and defuse conflict. |
* Includes awareness of personality, culture, temperament, leadership style, communication style, conflict style, cognitive or thinking style, and other preferences.
While you are not limited to the preferences and competences listed in Table 1.4, the list does a good job of capturing some of the most common preferences and competences to consider. If you decide to only assess your preferences, then I recommend you choose a total of three to five preferences as your core focus. If you decide to assess your preferences and competences, then I recommend a total of five to seven preferences and competences as your core focus.
Task 2: Select the Personal DEI Assessment Tools That Map to Your Personal DEI Aims, Core Preferences, and Competences The second task is to select one or more personal DEI assessment tools that map to your personal DEI aims, core preferences, and core competences. Table 1.5 walks you through the entire process for choosing initial personal DEI core preferences and competences and selecting the right personal DEI assessment tool. Later in Step 4: DEI Initiatives, when determining your personal DEI strategies and measures, we will apply a very similar process to selecting your final personal DEI core preferences and competences. While it's important to select personal DEI assessment tools that are appropriate for your personal DEI aims, what's most important is that you put in the time and effort to fully understand and explore the value a tool can deliver.
TABLE 1.5 Mapping Personal DEI Aims to Personal DEI Preferences and Competences to Personal DEI Assessments
| If your personal DEI aims relate to … | Then you must assess your … | First, select from among the following personal DEI core preferences and core competences (“The ABCDEs of DEI”) … | Second, choose one or more DEI assessments that map to the personal DEI preferences and competences you selected … |
|---|---|---|---|
| Diversity: The Range of Human Differences (A Fact) | |||
| 1. Appreciate differences | Preferences | Awareness of Self, Awareness of Others, Appreciation of Others, Cultural Humility, Emotional Intelligence | HBDI®, ICS®, MBTI®, KTS, DiSC, Birkman, TKI®, HVP, SOCIAL STYLES™, EQ‐i 2.0, SEI® |
| 2. Recognize own biases | Preferences | Awareness of Self, Appreciation of Others, Bias Awareness, Cultural Humility, Emotional Intelligence | IAT, EQ‐i 2.0, SEI® |
| Inclusion: Involvement and Empowerment (An Action) | |||
| 3. Mitigate own biases | Preferences | Awareness of Self, Appreciation of Others, Affirmation of Others, Bias Awareness, Bias Mitigation, Cultural Humility, Emotional Intelligence | IAT, EQ‐i 2.0, SEI® |
| Competences | Adaptation, Communication, Cultural Competence, Cultural Humility, Emotional Intelligence | I3™, ILSA, EQ‐i 2.0, LSI, SEI®, Any Diverse 360° | |
| 4. Navigate and bridge differences | Preferences | Awareness of Self, Awareness of Others, Appreciation of Others, Affirmation of Others, Bias Awareness, Bias Mitigation, Cultural Humility, Emotional Intelligence | HBDI®, ICS®, MBTI®, KTS, DiSC, Birkman, TKI®, HVP, SOCIAL STYLES™, EQ‐i 2.0, SEI® |
| Competences | Adaptation, Communication, Courage, Cultural Competence, Cultural Humility, Dialogue, Emotional Intelligence | I3™, IDI®, PASK, ILSA, LSI, EQ‐i 2.0, SEI®, Any Diverse 360° | |
| 5. Be inclusive | Preferences | Awareness of Others, Appreciation of Others, Affirmation of Others, Bias Awareness, Bias Mitigation, Cultural Humility, Emotional Intelligence | IAT, EQ‐i 2.0, SEI® |
| Competences | Adaptation, Advocacy, Collaboration, Communication, Courage, Cultural Competence, Cultural Humility, Dialogue, Emotional Intelligence | I3™, ILSA, EQ‐i 2.0, LSI, SEI®, Any Diverse 360° | |
| 6. Resolve conflict | Preferences | Collaboration, Emotional Intelligence | ICS®, TKI®, EQ‐i 2.0, SEI® |
| Competences | Conflict Resolution, Dialogue, Emotional Intelligence | EQ‐i 2.0, SEI®, Any Diverse 360° | |
| Equity: Fairness and Equality in Outcomes (A Choice) | |||
| 7. Be a mentor 8. Be a sponsor | Preferences | Awareness of Others, Appreciation of Others, Affirmation of Others, Cultural Humility, Emotional Intelligence | HBDI®, ICS®, MBTI®, KTS, DiSC, Birkman, TKI®, HVP, SOCIAL STYLES™, EQ‐i 2.0, SEI® |
| Competences | Advocacy, Coaching, Mentoring and Sponsoring, Collaboration, Communication, Cultural Competence, Cultural Humility, Dialogue, Emotional Intelligence | I3™, IDI®, ASI, IRI, ISI, WPT (26), WPT (30), WMPT (46), PASK, CliftonStrengths, StandOut, ILSA, LSI, EQ‐i 2.0, SEI®, Any Diverse 360° | |
| 9. Be an ally 10. Be an antiracist | Preferences | Awareness of Others, Appreciation of Others, Affirmation of Others, Allyship, Antiracism, Bias Awareness, Bias Mitigation, Cultural Humility, Emotional Intelligence | IAT, EQ‐i 2.0, SEI® |
| Competences | Advocacy, Collaboration, Communication, Courage, Cultural Competence, Cultural Humility, Dialogue, Emotional Intelligence | I3™, ASI, IRI, ISI, WPT (26), WPT (30), WMPT (46), ILSA, EQ‐i 2.0, LSI, SEI®, Any Diverse 360° | |
| 11. Improve performance 12. Increase compensation | Preferences | Awareness of Self, Awareness of Others, Appreciation of Others, Bias Awareness, Cultural Humility, Emotional Intelligence | IAT, HBDI®, MBTI®, KTS, DiSC, Birkman, HVP, SOCIAL STYLES™, EQ‐i 2.0, SEI® |
| Competences | Adaptation, Affirmation of Others, Bias Mitigation, Coaching, Mentoring and Sponsoring, Collaboration, Communication, Cultural Competence, Cultural Humility, Emotional Intelligence | I3™, IDI®, ISI, IRI, ASI, WPT (26), WPT (30), WMPT (46), PASK, CliftonStrengths, StandOut, ILSA, LSI, EQ‐i 2.0, SEI®, Any Diverse 360° | |
Task 3: Generate Reports and Conduct a Debriefing The third and final step is to generate a report and conduct a debriefing. As shown in Table 1.3, some personal DEI assessments require that you work through a certified practitioner or qualified administrator or other approved third party. They will conduct your debriefing. In almost all instances, the work of generating a profile will be done for you and delivered in the form of an electronic or downloadable assessment report. Some reports also include tips, tools, and other insights based on your profile. You and/or your certified practitioner should take the time to conduct a detailed review of your personal DEI assessment results. The findings will serve as the basis for determining your personal DEI objectives and goals in Step 2: DEI Imperatives.
Mitigating Data Bias—Part 1
When administering an assessment tool, it is important to be mindful of how human biases can affect the implementation of the tool and interpretation of its results, and to take deliberate steps to mitigate those biases. Data carries and inherits its own assumptions and biases as a reflection of the human assumptions and implicit biases discussed earlier in this step. This phenomenon is referred to as “data bias” and “algorithmic bias.” A famous example is when a team at Amazon built a computer program to improve their recruitment of women.
“The team had been building computer programs since 2014 to review job applicants’ resumes with the aim of mechanizing the search for top talent,” according to Reuters.17 “Automation has been key to Amazon's e‐commerce dominance, be it inside warehouses or driving pricing decisions. The company's experimental hiring tool used artificial intelligence (AI) to give job candidates scores ranging from one to five stars—much like shoppers rate products on Amazon… . But by 2015, the company realized its new system was not rating candidates for software developer jobs and other technical posts in a gender‐neutral way. That is because Amazon's computer models were trained to vet applicants by observing patterns in resumes submitted to the company over a 10‐year period. Most came from men, a reflection of male dominance across the tech industry.” Essentially, the algorithm underlying Amazon's computer program inherited a gender bias, from among other problems, that disadvantaged women job seekers. Despite all their technological sophistication, even Amazon was undermined by a data and algorithmic bias. There are several ways that data and algorithmic biases can manifest themselves that you should be aware of, so they do not undermine your efforts. Three of the most common data biases—researcher bias, confirmation bias, and attribution bias—are described below along with steps you can take to mitigate them. I will further explore a third bias—selection bias—in the second part of Step 1: DEI Inventory for Organizations, and a fourth bias—algorithmic bias—in Step 5: DEI Impact.
Researcher Bias
Researcher bias shows up long before you employ an assessment tool. It affects how an instrument is conceived, designed, labeled, and presented. When they are developing instruments, scales, terminology, and phraseology, researchers make assumptions, and those assumptions can show up as a researcher bias.
For example, one of the tools we often use at BCT to help clients resolve conflicts and solve problems across cultural boundaries is the Intercultural Conflict Style Inventory® (ICS®). The ICS®, which measures your preference for intercultural conflict against four styles, was also developed by Dr. Mitchell R. Hammer of ICS Inventory, LLC.
In Western cultures there is a bias, or preference, for resolving conflict directly. This reflects an individualistic cultural orientation and a focus on tasks. For example, a common approach to resolving conflict in Western cultures is for both individuals to try to work out their differences one on one and, if that fails, to bring in a neutral third party to resolve the issues and complete the task. In non‐Western cultures there is a bias, or a preference, for resolving conflict indirectly. This reflects a collectivistic cultural orientation and a focus on relationships. For example, a common approach to resolving conflict in non‐Western cultures is to keep the individuals apart and use a third party who knows them both intimately to discuss the issue with them separately and inform them of the resolution to the issue separately, to maintain the relationship. The ICS® is predicated on a theoretical model that embraces both preferences for resolving conflict and, in doing so, mitigates researcher bias. It was intentionally developed by Dr. Hammer “to eliminate potential cultural bias by insuring that the theoretical model is grounded in research evidence that is generalizable and inclusive of a wide‐range of cultural communities (e.g., individualistic to collectivistic cultural groups).”18
When evaluating an assessment tool, you want to be certain to ask questions such as the following:
- Is the model or framework for the assessment inclusive?
- Does it reflect diverse perspectives, racially, ethnically, culturally, domestically, and internationally in its conception, design, labeling, and presentation?
- If so, how was this accomplished?
This will help mitigate the potential of researcher biases to skew the assessment questions, methodologies, analysis, and results.
Confirmation and Attribution Bias
Confirmation bias occurs when we actively search for information or evidence that confirms our preconceived assumptions and hypotheses while ignoring information or evidence to the contrary. Prior to conducting an assessment, people often harbor expectations of the results. For example, imagine that you have always prided yourself on being an organized person, but your close friends and family regularly disagree and consider you a very disorganized person. If you were to assess your thinking preferences using the HBDI® and your results came back with a high profile score for “practical” thinking (organized/sequential/planned/detailed) it would very likely be interpreted as confirmation of your expectations, thus reflecting your confirmation bias. However, you should not ignore the feedback from your friends and family as it also represents valuable data that could cause you to have a blind spot. Moreover, you should recall that a preference is not a competence. Therefore, while the HBDI® may have assessed you as having a high preference for being organized, the feedback from you friends and family may suggest you have a low competence for being organized!
As another example, imagine you are assessing your implicit biases using the IAT. You may take the test believing you don't have any implicit biases because you incorrectly assume that a bias is a bad thing or says something negative about you (in fact, I've witnessed this “bias about bias” on countless occasions during trainings and facilitations) or that you could not possibly harbor any preferences, thus reflecting an attribution bias. As result, you are likely to reject the results if they come back with anything other than a neutral or positive finding. Stated simply, a confirmation bias may cause you to passively accept assessment results you like and/or vehemently reject assessment results you don't like.
To mitigate confirmation bias, attribution bias, or other forms of bias, you can employ a technique akin to Structured Free Recall (SFR).19 SFR has proven to be successful in reducing the influence of bias when evaluating people or decisions. It suggests that you consider all the positives and negatives associated with the person or the decision before completing your evaluation. I think of SFR as a way to mitigate bias by first calibrating your brain to all possibilities both positive and negative. In this context, I recommend that you consider all the positives and negatives associated with you and your preferences and competences, including seeking feedback from a diverse set of colleagues, coworkers, and close friends and family, prior to completing a personal DEI assessment. This can help mitigate the potential influence of bias when you receive and interpret your personal DEI assessment results.
Notes
- 1. https://www.thinkherrmann.com/hubfs/CP_Site/HBDI_and_Whole_Brain_Thinking_FAQ.pdf
- 2. Sondra Thiederman, 3 Keys to Defeating Unconscious Bias: Watch, Think, Act (San Diego, CA: Cross‐Cultural Communications, 2015).
- 3. Daniel Kahneman, Thinking, Fast and Slow (New York: Farrar, Straus and Giroux, 2013).
- 4. Myriam Callegarin, “Three Things You Should Know About How the Brain Works,” LinkedIn Pulse, December 4, 2015.
- 5. https://www.pnas.org/content/116/26/12590
- 6. https://implicit.harvard.edu/implicit/education.html
- 7. https://implicit.harvard.edu/implicit/aboutus.html
- 8. N. Herrmann, The Creative Brain (Lake Lure, NC: Ned Herrmann/Brain Books, 1989).
- 9. http://paei.wikidot.com/herrmann-ned-brain-dominance-instrument
- 10. J.B. Reid and V.R. Brown, Intrinsic Inclusion: Rebooting Your Biased Brain (Cincinnati, OH: New Phoenix Publishing, 2021).
- 11. J. B. Reid, “Neuroscience of Bias,” Chrysalis Coalition (2022).
- 12. https://idiinventory.com/products/
- 13. M. R. Hammer, “The Intercultural Development Inventory® (IDI v5)” (Olney, MD: IDI, LLC, 2016).
- 14. M. R. Hammer, “The Intercultural Development Inventory® (IDI®) Resource Guide” (Olney, MD: IDI, LLC, 2020).
- 15. https://asi.dlplummer.com/understanding-your-score
- 16. J. N. Hook, D. E. Davis, J. Owen, E. L. Worthington Jr., and S. O. Utsey, “Cultural Humility: Measuring Openness to Culturally Diverse Clients.” Journal of Counseling Psychology 60, no. 3 (2013), 353.
- 17. https://www.reuters.com/article/us-amazon-com-jobs-automation-insight/amazon-scraps-secret-ai-recruiting-tool-that-showed-bias-against-women-idUSKCN1MK08G
- 18. https://icsinventory.com/ics-inventory/why-using-the-ics-inventory-is-best-option
- 19. C. Rudolph, E. Toomey, and B. Baltes. “Considering Age Diversity in Recruitment and Selection: An Expanded Work Lifespan View of Age Management,” in The Palgrave Handbook of Age Diversity and Work, edited by J. McCarthy and E. Parry (Palgrave‐Macmillan, 2016), 626–628.