
Chapter 4
Kinetics
As noted in previous chapters, important information is obtained by equilibrium measurements and correlations regarding a given crystallization process. However, much of the effort expended in developing and designing such a process is dedicated to defining the rate processes involved. This chapter presents a brief discussion of the rate processes which define the nature of the final crystalline product and, of course, the equipment required to produce it.
Kinetics of nucleation and crystal growth can be modified to some extent to favor an efficient process, but in almost all commercial crystallization processes, this flexibility is limited by the needs of the users of the product.
In the pharmaceutical industry, the users of bulk final products are the dosage form formulators, who must provide a product which will produce the desired beneficial effect on patients health. As can be imagined, purity, and bioavailability criteria must be satisfied before the formulators can address concerns about other crystal properties such as flow‐ability, compaction properties, and other parameters.
Users of intermediate products (those who carry out the next step) are always concerned with levels of impurities being carried forward to them from the previous crystallization process, but generally they have fewer concerns about other properties of the solids. This can often allow manipulation of process parameters to favor reduced time cycles or more efficient types of processing equipment.
A general description of the kinetics of particle size distribution or population balance equation can be expressed as:
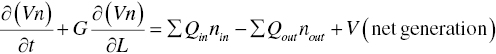
where n (t, L) represents particle size distribution or population density function, which is a function of t time and L particle size/length; V is the volume of the batch; Qin and Qout are respective in‐flows and out‐flows to the crystallizer; subject to
- Initial conditions: n(t = 0, L) which is the initial seed, V(t = 0) which is initial batch volume, and C(t = 0) which is initial solution concentration.
- Boundary conditions: Qin(t), Qout(t) and
- Rate equations which include nucleation rate B (Eq. 4.2) which is embedded in the net generation term and crystal growth rate G (Eq. 4.3); Both B and G are functions of supersaturation and will be detailed in the following Section 4.1.
As noted throughout this book, the reader is encouraged to review the detailed treatment of kinetics in the many excellent texts on crystallization. Development of many of the kinetic models used by current researchers is described in the texts of Nielsen (1964), Ohara and Reid (1973), Nyvlt et al. (1985), and Sohnel and Garside (1992). More recent summaries and descriptions are those of Myerson (2001), Mullin (2001), and Mersmann (2001). Kinetic models are also described more briefly by Johnson (2003), who provides an overview of rapid precipitation of organics, and by Davey and Garside (2000), who review all aspects of crystallization in an excellent introductory volume.
4.1 SUPERSATURATION AND RATE PROCESSES
As supersaturation is increased in a solution containing crystalline material or surfaces upon which crystals can grow, growth is the dominant process. However, if/when supersaturation reaches a critical value, new nuclei are rapidly formed, relieve much of the supersaturation and, thereafter, becoming new sites for growth. The control of crystal size in industrial operations depends upon the control of nucleation and growth. The mechanisms by which nucleation and growth occur are outlined in later sections of this chapter.
The driving force for crystallization is the excess activity of the solute compared to that in equilibrium with the crystalline solid. The most common supersaturation ratio, for example, is ![]() . For most purposes, it is common to assume an activity coefficient (γ) of 1 and to discuss supersaturation in terms of concentration difference (C − C*) or ratio (C/C* or [C − C*]/C*).
. For most purposes, it is common to assume an activity coefficient (γ) of 1 and to discuss supersaturation in terms of concentration difference (C − C*) or ratio (C/C* or [C − C*]/C*).
The kinetic order in expressions for crystal growth is discussed in Section 4.3.1.6, that for heterogeneous nucleation in Section 4.2.3.1, and that for homogeneous nucleation in Section 4.2.1.
In combination with vessel geometry and mixing as well as the character of the slurry, supersaturation governs the rate and nature of the nucleation and crystal growth processes which will occur. As noted above, this chapter provides a brief discussion of these processes. Supersaturation, at least locally, is an absolute requirement to drive nucleation and crystal growth. For nucleation to occur, molecular clusters (aggregates) of the dissolved substance must continually form and decompose because of local concentration fluctuations. In a supersaturated solution outside the metastable region, the rate of formation of aggregates exceeds that of their decomposition. In the case of crystal growth, growth takes place when the rate of integration of single molecules or aggregates into an existing lattice structure exceeds the rate of release of these entities from the surface, a process also driven by local concentration fluctuations.
Although supersaturation for crystallization in the pharmaceutical industry is usually measured as a difference or ratio of absolute solution concentrations, the solubility product is most often used for very fast precipitation, which is more common with inorganics.
Crystallization is a combination of nucleation and crystal growth processes. Induction time for nucleation, as measured by current in‐line instruments, is the combined time for initial nucleation and subsequent growth to reach instrument detectability. Figure 4.1 shows, for release of a given amount of material, the prototypical shape of the curves of nucleation and growth rates as they are affected by supersaturation. At low supersaturation, growth dominates and ultimate product particle size is maximized. An increase in supersaturation, shown in Figure 4.1 as the saturation ratio (S = C/C*) rather than [(C − C*)/C* = (S − 1)], increases nucleation rates, and at high supersaturation the process is controlled by nucleation mechanisms.
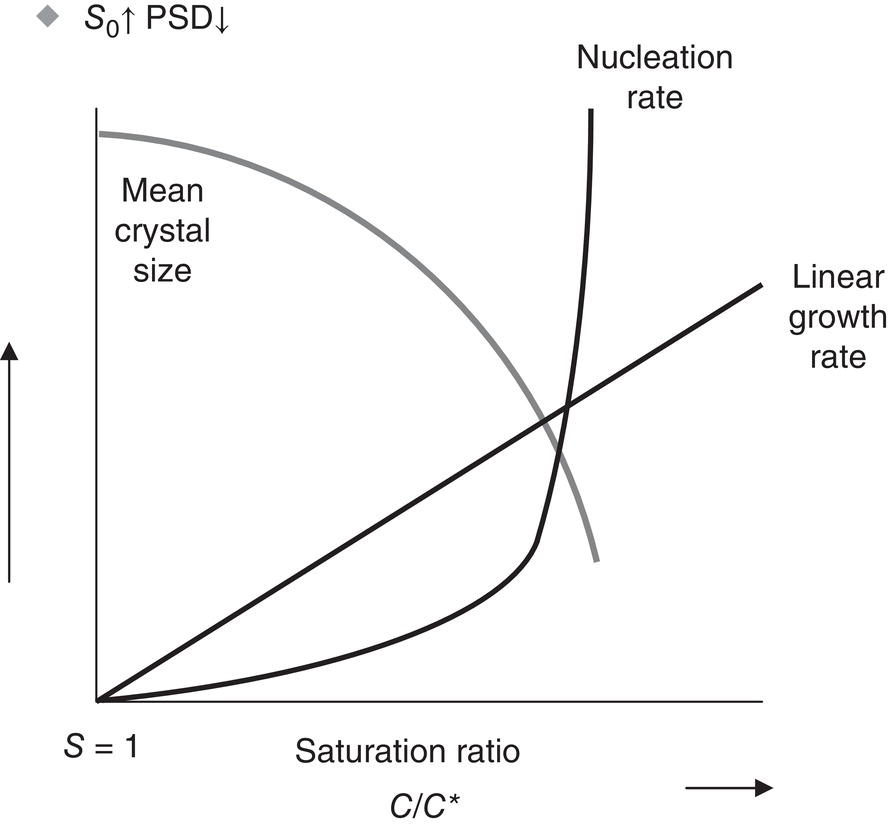
Figure 4.1 Effect of supersaturation on growth rate and particle size.
In almost all industrial crystallizations, both nucleation and growth contribute to the final result (purity, morphology, and size distribution) in a major way. All growth processes, emphasized in this book as being desirable for maximum control and robustness in many or most situations, still require an understanding of the nucleation properties of the system being studied in order to minimize the contribution of nucleation to the final result.
The following section will discuss homogeneous, heterogeneous, and secondary nucleation mechanisms and kinetics. This will be followed by a similar discussion of crystal growth. The reader is directed to the references cited above, and others, for detailed treatment of these phenomena.
4.2 NUCLEATION
Creation of new crystals (nucleation) can take place through a variety of mechanisms. Figure 4.2 summarizes the types of nucleation which can occur. Some of these are true nucleation (driven essentially only by free energy considerations); others are heavily dependent on imposed conditions (mixing and others).
The presence and width of a metastable zone, in which nucleation is not spontaneous, have been discussed in Chapter 2. The thermodynamic limit of the metastable zone is a locus of points known as the spinodal curve, where spinodal decomposition replaces nucleation and crystal growth as the phase separation. In typical industrial crystallization, nucleation (and release of supersaturation) occurs at much lower supersaturations than the spinodal curve.
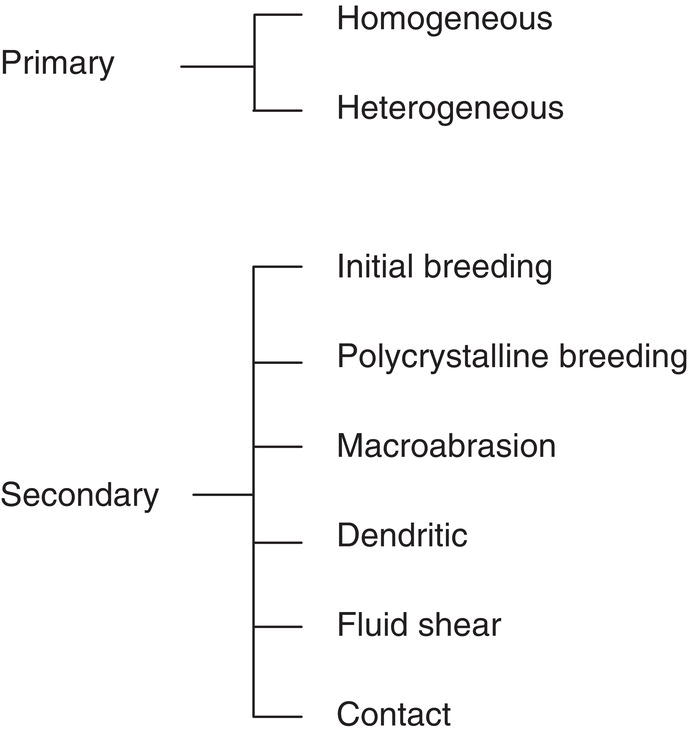
Figure 4.2 Mechanisms of nucleation.
4.2.1 Homogeneous Nucleation
As the cluster size increases, the specific surface (area/volume) decreases. For any given system, there is a critical stable cluster size at which the intermolecular force accompanying the addition of new molecules exceeds the force required to extend the surface area of the aggregate. If the aggregate is smaller than the critical size, the probability of its decomposition is great. Likewise, particles larger than the critical size are likely to survive and grow.
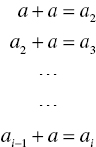
The classical nucleation theory of Volmer (1939), Nielsen (1964), and others assumes the addition of single molecules to a cluster until it reaches a critical size:
During the cluster formation process, the free energy for nucleus formation is a balance between that for formation of the nucleus surface (positive) and that for phase transformation (negative). As the cluster becomes larger, the intermolecular forces of the particles within the cluster begin to predominate over the effect of the surrounding particles. Figure 4.3 was calculated by Johnson (2003) for β‐carotene in 47 wt% tetrahydrofuran in water at S = 2, where S = (C/C*). The aggregation number (cluster volume) is used rather than the commonly used cluster radius because it relates directly to the cluster formation process taking place. At the critical cluster size Q*, as shown in Figure 4.3, the free energies for surface formation and phase transformation are in balance and the energy change for addition of another molecule becomes negative (the cluster is likely to survive and a nucleus is born).
In Figure 4.3, Q* is the critical aggregation number, ΔGs is the surface excess free energy (between the surface and the bulk of the particle), ΔGυ is the excess free energy between a particle at r = ∞ and the solute in solution, γ12 is the surface tension, and ω is the molecular volume.
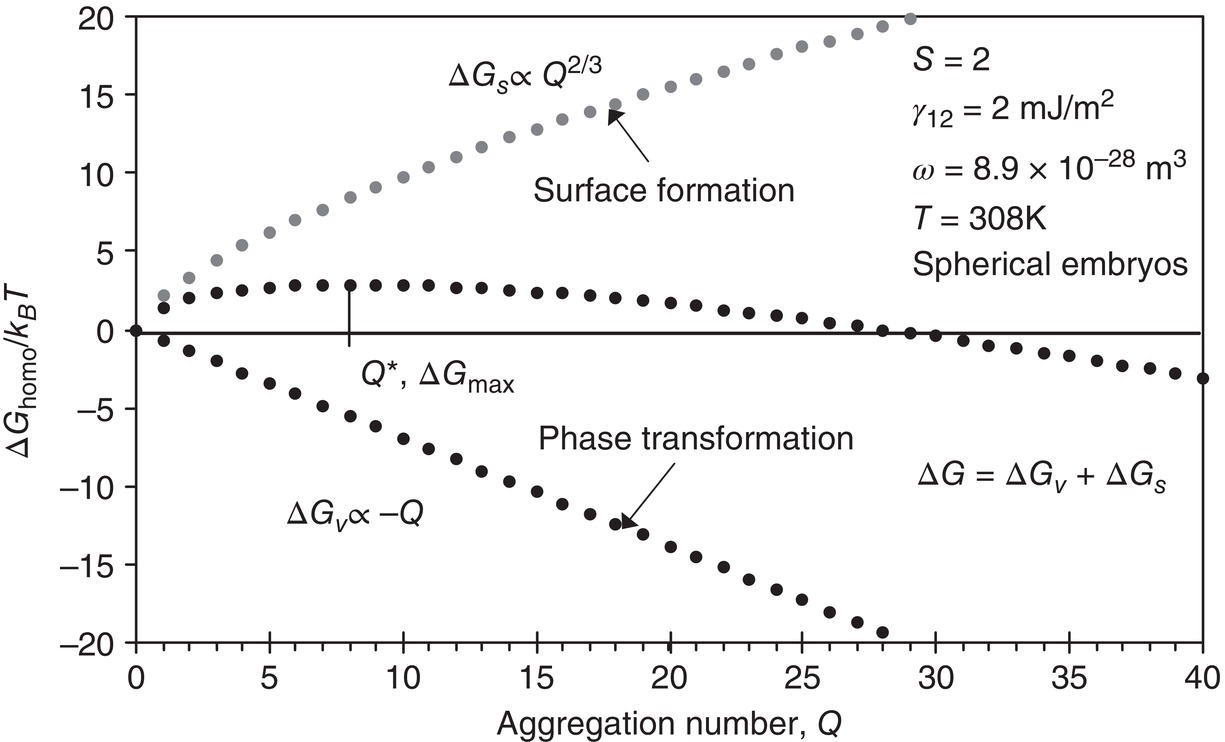
Figure 4.3 Contributions to Gibbs free energy for homogeneous embryo formation.
As supersaturation is increased, the entropy of phase transformation is lowered, thereby lowering ΔG for formation of the condensed crystalline phase (nucleation), as shown in Figure 4.4. In the β‐carotene/THF/water example of Figure 4.3, S > 8, the critical‐sized embryo is about one or two molecules.
The rate of homogeneous nucleation of a sphere takes the following form, derived from an Arrhenius‐type expression:
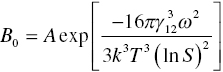
where B0 = nucleation rate (number per m3 per second), S = saturation ratio [C/C*], and v = molecular volume (m3 per molecule). A is a prefactor containing solute diffusivity, supersaturation, molecular diameter and volume, equilibrium solute concentration, and Avogadro’s number. The terms in the exponential reflect the energetics of phase change.
Derivations of Eq. (4.1) are in the references cited above. One such location is Myerson (2001, pp. 45–46). Theoretical computation of A is given by Nielsen (1964). Predicting diffusion to the surface results in a value of A ~ 1030. Measurements of A for lovastatin by Mahajan and Kirwan (1996) show Nielsen’s value to be orders of magnitude too high, presumably because of the slow surface integration rate exhibited by many organic molecules.
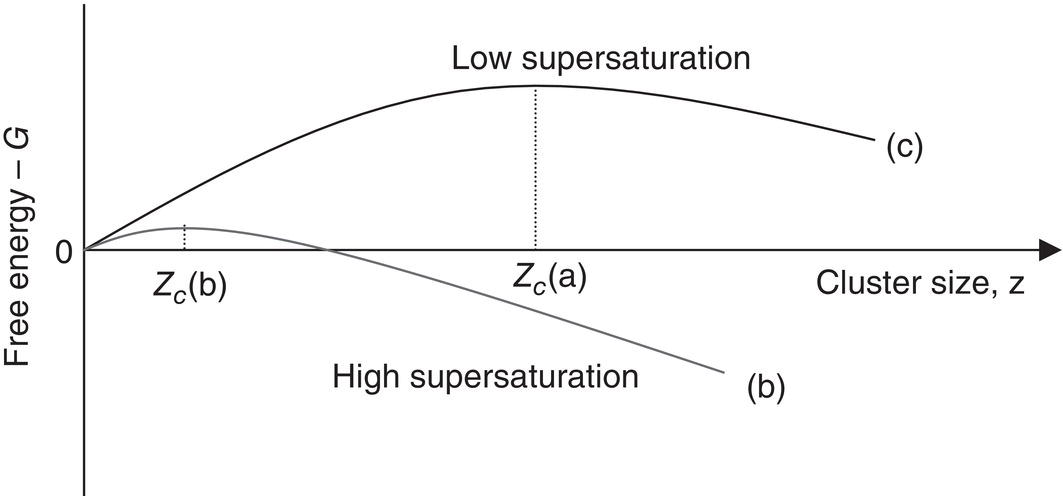
Figure 4.4 Effect of supersaturation on free energy of cluster formation.
4.2.1.1 Limitations of Classical Nucleation Theory
There are a number of oversimplifications in this theory, including the important one that classical thermodynamic considerations, which are based on averages of larger groupings of molecules, may not be applicable to small nucleating clusters. However, the most frequently discussed limitation is its basic presumption of the addition of one molecule at a time to the growing cluster. It is almost certain that the clusters or embryos aggregate and rearrange while building up to critical size. In practice, the entire process is also affected by local concentration fluctuations.
Especially with organics, which create complex crystal lattices held together by relatively weak forces, the rate of addition of molecules to the forming solid phase can exceed the ability of these molecules to orient themselves properly. This can easily result in a partially or totally amorphous structure in the solid. The frequency of this event can be minimized by providing seed particles with the desired final lattice structure. The authors suggest that seeded growth processes should be considered early in development.
Other considerations in homogeneous nucleation relate to surface stresses in small crystals and to the effect of solute depletion in the immediate neighborhood of forming aggregates.
4.2.1.2 Ostwald Ripening
Clusters formed by the processes described above experience a phenomenon which is not a nucleation event but does affect the nature of the resultant crystal population. Figure 4.5 illustrates the fact that a cluster’s surface molecules are under stress because they are insufficiently coordinated. This stress raises the pressure in the interior, increases the interfacial tension, and results in increased solubility of smaller entities, especially near the critical cluster size. This phenomenon is described by the Ostwald–Freundlich equation and leads to the process called Ostwald ripening, which is commercially important. Many industrial crystallization processes run age cycles, often with heating and cooling, to grow the larger crystals in the population at the expense of the smaller ones. Ostwald ripening is further discussed in Sections 4.3.1.7 and 4.4.
4.2.1.3 Localized Solution Concentration
Clusters which are approaching stability can be undermined by a localized reduced concentration, created by depletion from rapid nucleation. A schematic is shown in Figure 4.6. Although this is a minor effect, in some systems it can increase the induction time for nucleation.
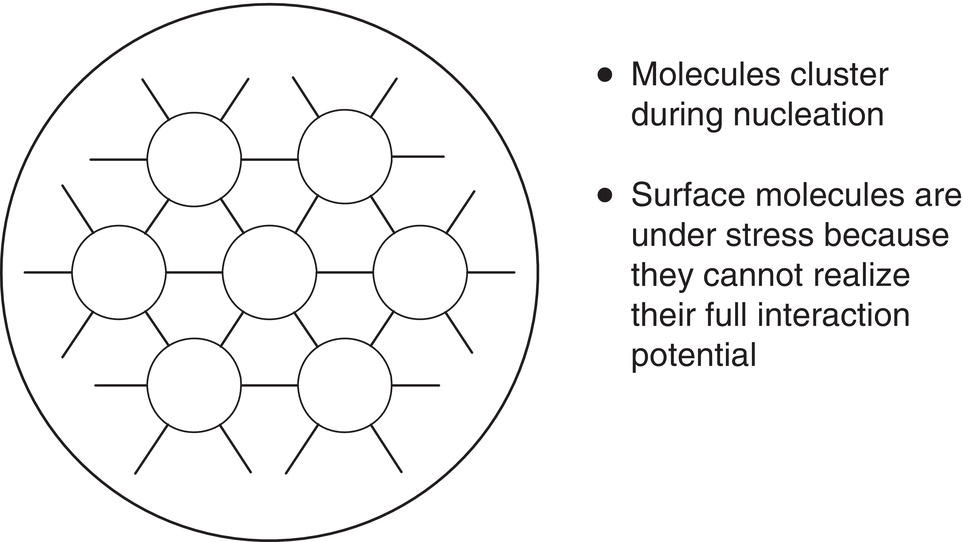
Figure 4.5 Stress on surface molecules in a cluster or crystal can alter its properties.
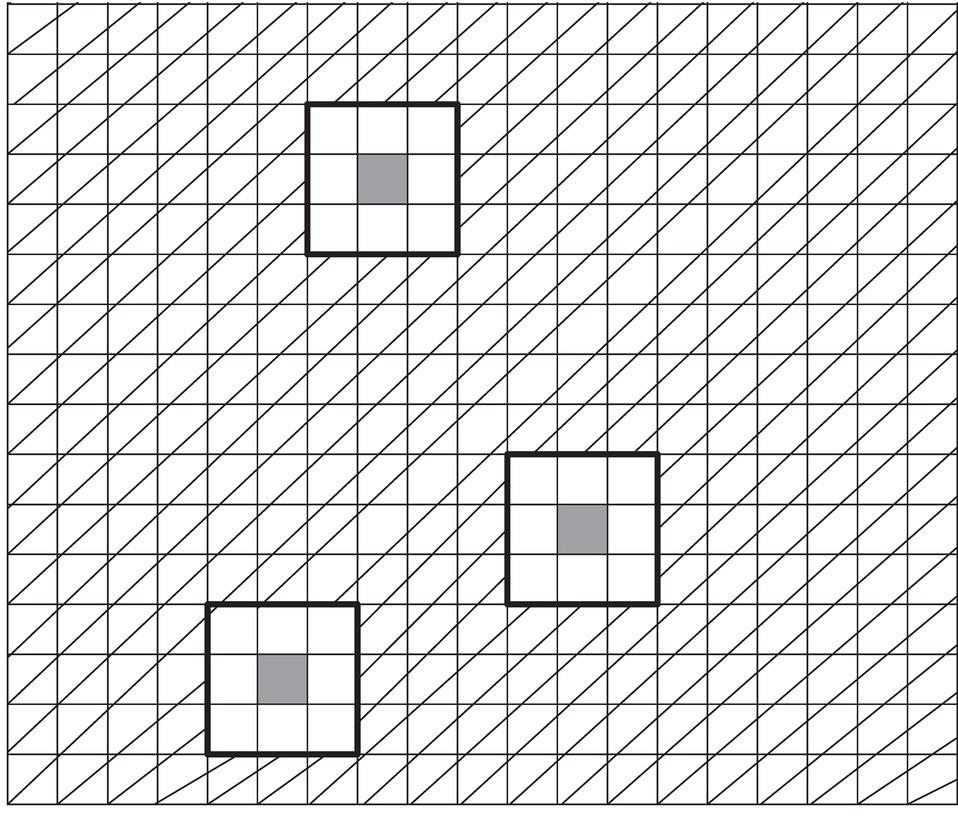
Figure 4.6 A schematic representation of the solution depletion in the vicinity of the aggregate being formed (the density of lines represents the concentration of solution).
4.2.1.4 Nucleation of Polymorphs
Problems in the pharmaceutical industry related to the crystallization of polymorphs are discussed in Chapter 3. Both true polymorphs and solvates can form crystalline phases which are not the most thermodynamically stable entities in any given situation. Ostwald (1897) proposed a mechanism, now called the Ostwald Rule of Stages, in which the nucleating structure is not the final, most stable form, but rather that representing the smallest change in free energy. There is then a succession of small free energy reduction (nucleation) events taking place until the stable form is reached.
Although the Rule of Stages is often operative in polymorphic systems, there are many systems in which it either does not apply or may apply only under certain supersaturation conditions. These criteria are described in Davey and Garside (2000, pp. 19–20). Furthermore, as discussed in Chapter 3, Section 3.3.2, surface tension and molecular diffusivity play important roles in affecting the nucleation rate of crystals under supersaturation. To accelerate the formation of stable form, either directly or through Ostwald ripening, it is desirable to minimize surface tension of the crystal and/or maximize its diffusivity. On the other hand, to minimize the Ostwald ripening (conversion from metastable form to stable form), it is desirable to slow down the kinetics by maximizing the surface tension and minimize diffusivity after the formation of metastable form.
As mentioned, increasing the temperature would decrease the surface tension and increase the diffusivity. Increasing the mixing intensity, for example via high shearing rotor‐stator homogenization or sonification, would greatly accelerate the diffusivity and facilitate the formation of stable crystal forms. A case is shown in the later Section 4.4.
4.2.2 Heterogeneous Nucleation
Heterogeneous nucleation can be primary or secondary, the former being caused by foreign particles and the latter by undissolved solute (usually crystallized from that solution).
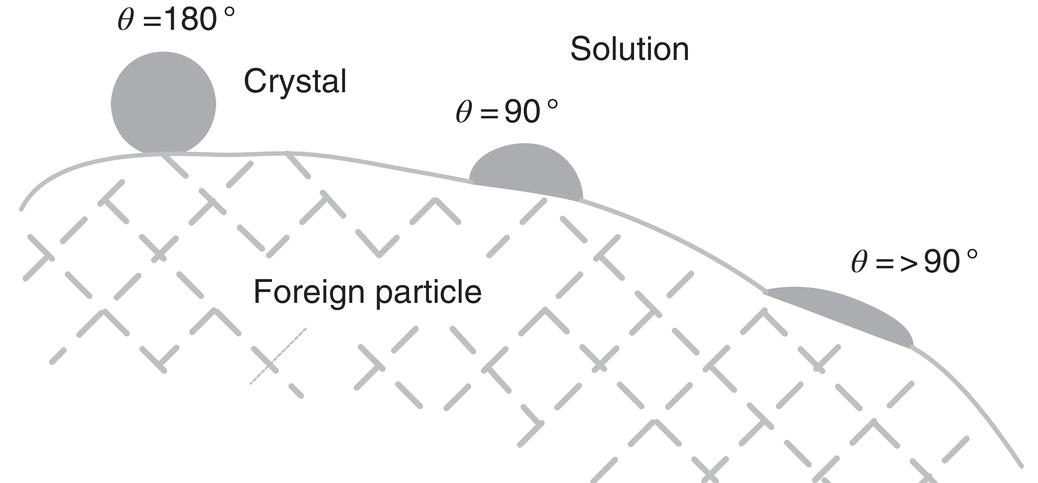
Figure 4.7 Nucleation on a foreign particle for different wetting angles.
Foreign substances in supersaturated solutions reduce the energy required for nucleation. Surface energy and particle geometry play a role. The form of Eq. (4.1) is retained but the negative exponential is generally reduced, often significantly, by the changed surface tension and energetics. Figure 4.7 described the effect of wetting angle on the ability of the clusters to form on the foreign particles. A contact angle of 08 should result in spontaneous nucleation, but in practice the kinds of particles added, intentionally or otherwise, do not generally approach that condition.
Figure 4.8 shows data from Schubert and Mersmann (1996). Using a rapidly mixing device to study barium sulfate precipitation, they showed the transition from (secondary) heterogeneous to homogeneous nucleation rates (changed slope) as supersaturation was raised. They also showed that the heterogeneous nucleation rate was proportional to the particle surface area, not the number of particles. A significant additional result was their ability to further increase the heterogeneous nucleation rate by adding foreign particles of titanium dioxide.
The same transition from heterogeneous to homogeneous nucleation occurs in the crystallization of organics. Figure 4.9 shows data from Mahajan and Kirwan (1996) for rapid crystallization of lovastatin, a pharmaceutical used for cholesterol reduction.
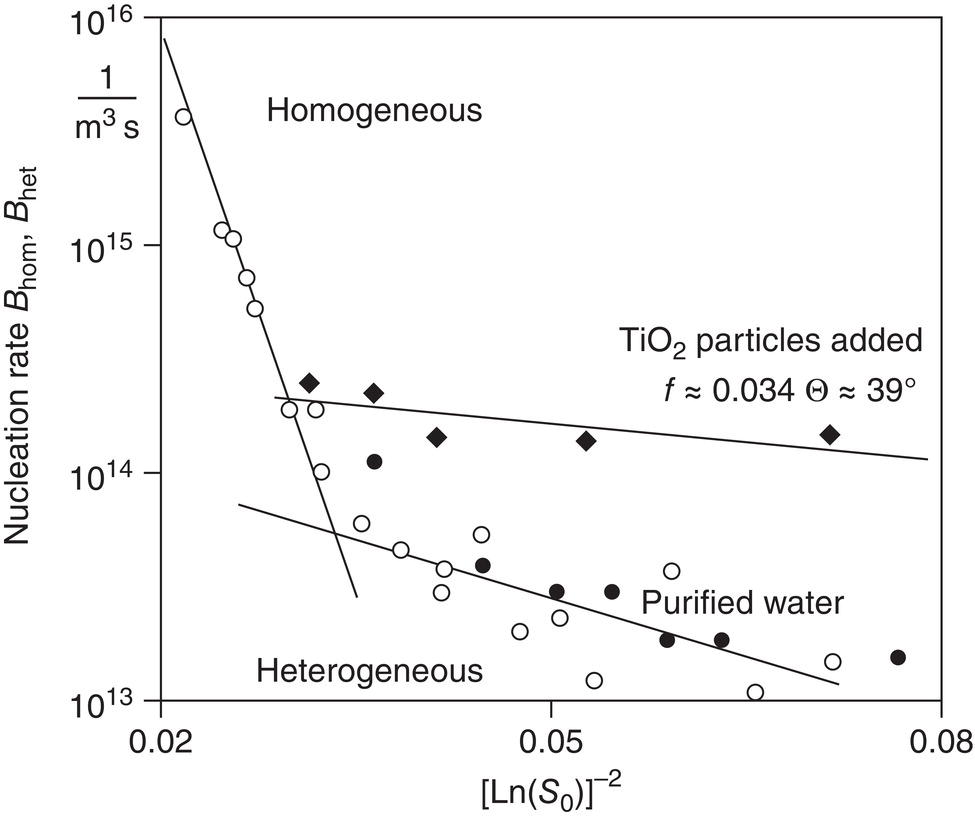
Figure 4.8 Measurement of nucleation kinetics for barium sulfate.
Source: Schubert and Mersmann (1996), by permission CHERIC.
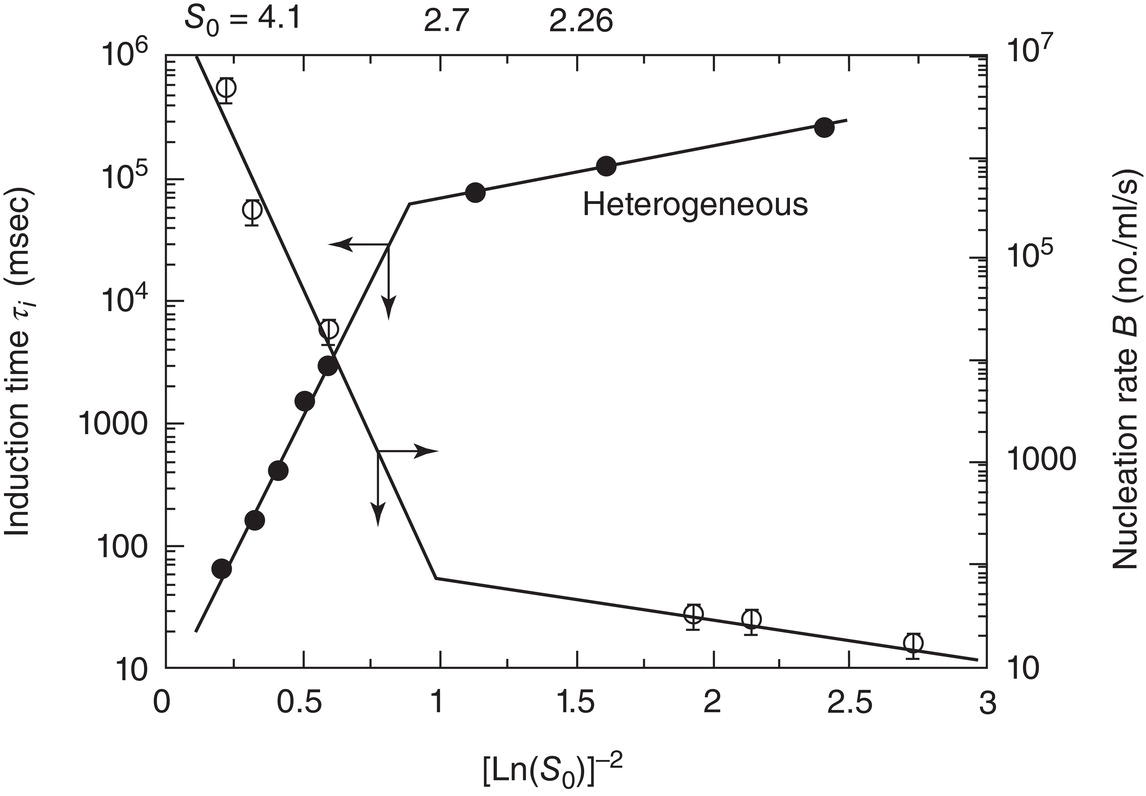
Figure 4.9 Measurement of nucleation kinetics and induction time for lovastatin.
Source: Adapted from Mahajan and Kirwan (1996).
4.2.3 Secondary Nucleation
Secondary nucleation occurs when crystals of the solute are present. Less supersaturation is required to generate new particles under this condition. Referring to the types of secondary nucleation shown in Figure 4.2, all of those are preformed crystals derived by various means from the parent, except for the case where molecular aggregates (clusters) are stripped from the surface. Except for pure breakage effects, as in milling, supersaturation is required in all types of secondary nucleation to satisfy the energetics.
Initial or dust breeding originates from crystallites formed on parent crystals during the growth period or broken off in storage. The crystallites exceed the critical size and are able to form new, fully formed crystals. As noted by Myerson (2001), if these are deemed undesirable for seeded batch crystallization, the crystallites must be removed by appropriate pretreatment (usually a solvent wash). The solvent power should be relatively low for the treatment step, as it is important to have enough volume to provide good washing of all the crystal surfaces.
Needle breeding occurs at higher supersaturation from needle or dendritic growth which is released into the solution or slurry. Figure 4.10, from the classic paper of Clontz and McCabe (1971), shows how needle‐like or spikewise growth can be produced at high supersaturation (usually unintentionally). Figure 4.11 shows the stages of coarsening which can occur with this morphology to produce nuclei.
Contact nucleation is the most common mechanism of secondary nucleation. Crystal–crystal, crystal–impeller, and crystal–wall collisions are involved. Secondary nuclei arise from microabrasion (crystal surface damage) or ordered cluster removal by fluid shear forces, as noted above. Figure 4.12 shows that for a given substance, impeller speed and material of construction can both play a role. Macroabrasion, usually called attrition breeding, causes rounding of edges and corners. It can be an industrial problem, but it has a clear mechanism, and can often be controlled with suitable choices of mixing impellers and other parameters.
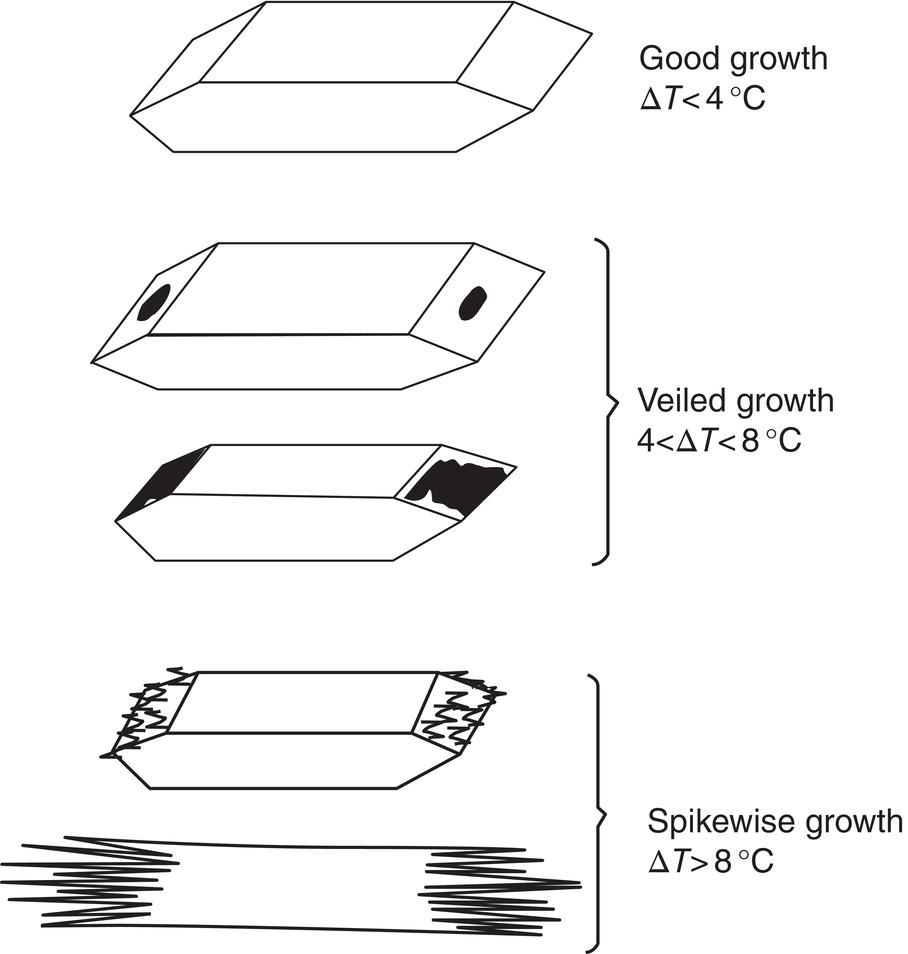
Figure 4.10 Effect of supersaturation on growth characteristics of MgSO4·7H2O.
Source: Clontz and McCabe (1971) with permission American Institute of Chemical Engineers.
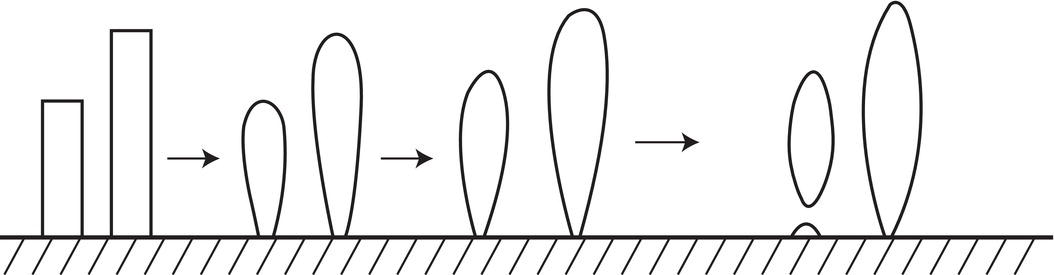
Figure 4.11 A schematic representation of dendrite coarsening.
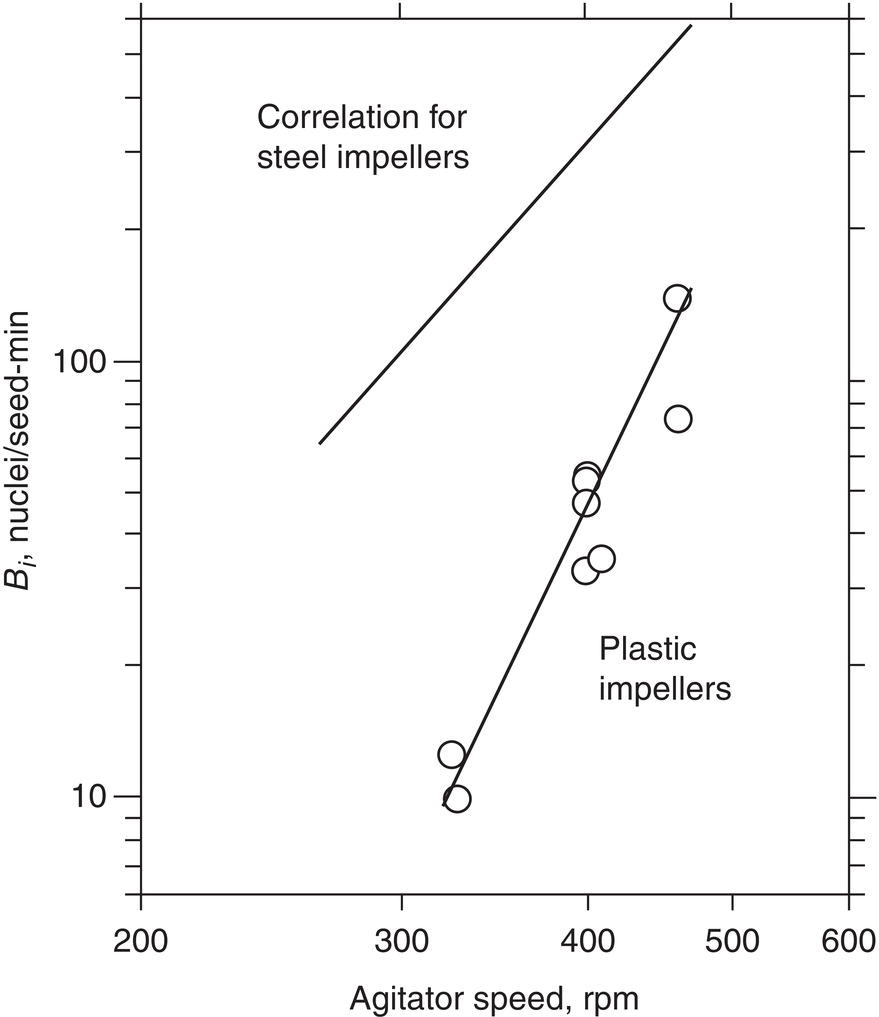
Figure 4.12 Effect of agitator speed on the secondary nucleation rate for steel and plastic impellers.
Source: Adapted from Ness and White (1976).
Another type of nucleation, polycrystalline breeding, occurs at higher supersaturations from irregularly formed aggregates, but this is not a common problem.
4.2.3.1 Secondary Nucleation Correlation
For contact nucleation, the most common type of secondary nucleation, the combination of potential causes usually calls for a power law correlation of the type
where B is the nucleation rate in number per m3 per second, ΔC is the concentration difference supersaturation (C − C*), N is the agitation rate (usually RPM or tip speed), and M is the suspension density.
The value of the exponent b is usually between 1 and 2.5, considerably lower than any predictions based on primary nucleation. The value of the exponent k is usually between 2 and 4. The value of j is generally close to 1, implying that collisions with the impeller(s) and other parts of the crystallizer are more important than crystal–crystal interactions.
4.3 CRYSTAL GROWTH AND AGGLOMERATION
In any crystal, the orientation between any face and the crystallographic unit cell is defined by its Miller Indices, which are the inverse of intersections of the face with the crystallographic axes a, b, and c. For example, the surface (101) is parallel to the b‐axis and cuts the a‐ and c‐axes one unit cell from the origin. Good reviews of Miller Indices are provided by Mullin (2001, pp. 10–13) and Myerson (2001, pp. 35–36).
Crystal growth is a description of the linear velocity of a growing face, that is, the linear velocity perpendicular to that face. Growth velocity, in the classical view, is considered to be constant (size independent), according to the classical McCabe ΔL Law (McCabe 1929).
Crystal growth is envisioned as a growth of layers. As a molecule or cluster arrives at a surface, it must shed its layer(s) of solvent and bond with that layer. Figure 4.13 shows the bond configurations that are possible. Molecules A, B, and C are attached to, respectively, (A) the surface only (one attachment), (B) the surface and a growing step (two attachments), and (C) a “kink site” (three attachments). Energetically, (C) is most favorable for successful bonding to the surface, (B) is less favorable, and (A) is least favorable.
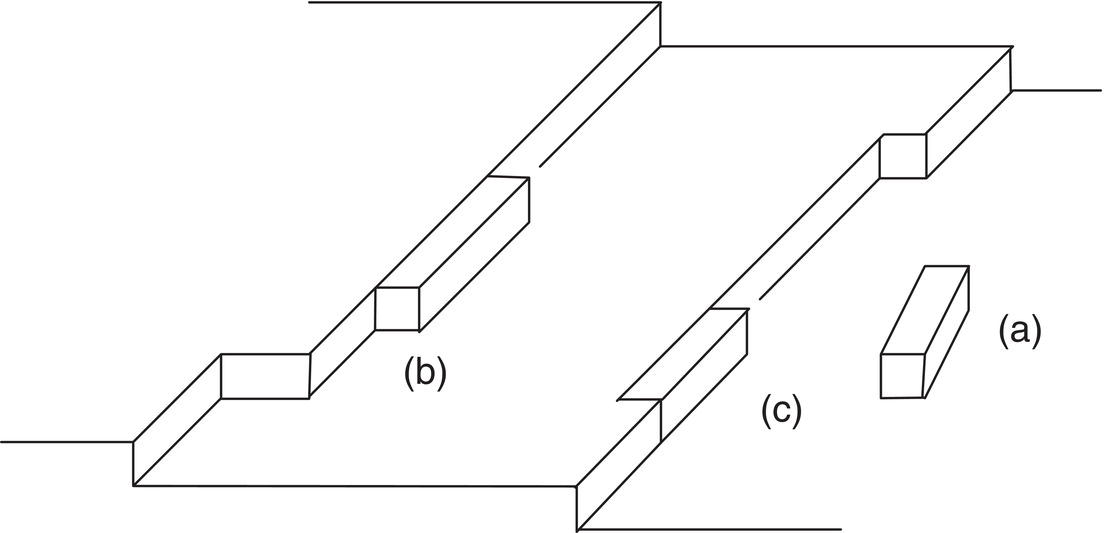
Figure 4.13 Surface structure of a growing crystal: (a) one attachment, (b) two attachments, (c) three attachments.
During crystallization in agitated environment, solid particles will contact with each other due to flow motion. Under crystal growth condition, the contact points/areas among these particles can form stable bridges and form the multiparticle agglomerates. Particle agglomeration is the secondary mechanism for increase of particle size, besides crystal growth as the primary mechanism. Agglomeration may lead to multi‐modal particle size distribution. Additionally, agglomerates may entrap mother liquor into these agglomerates during the crystallization.
4.3.1 Crystal Growth Mechanisms
4.3.1.1 Continuous Growth
Some crystalline materials with high roughness contain enough kink and step sites on the surface to integrate essentially all approaching growth units with minimal complication. This is referred to as continuous growth. Under these conditions, the growth rate is linearly proportional to the supersaturation at all supersaturation levels.
4.3.1.2 Growth by Two‐Dimensional Nucleation
Many or most materials which are crystallized do not have enough roughness to exhibit continuous growth. Steps must be created to accept the incoming growth units. One mechanistic explanation for creation of these steps is two‐dimensional nucleation at the surface. This involves the formation of nucleated circles on the flat crystalline surface, similar to the three‐dimensional nucleation described earlier in this chapter. As illustrated in Figure 4.14, molecules are being adsorbed onto, desorbed from, and diffusing on the crystal surface.
There are several possible mechanisms for completion of the growth layer after surface nucleation. The mononuclear model envisions infinite spreading velocity of the surface nuclei. In this model, the growth rate of each face is proportional to its area, diametrically opposite from the observed behavior, in which the largest faces are the slowest‐growing. The polynuclear model assumes zero spreading velocity. This predicts a global maximum growth rate at intermediate supersaturation. The data of Mahajan and Kirwan (1996) fit this model. The birth and spread model allows a finite spreading rate and nucleation at any location on the surface. It is sometimes used for correlation of data.
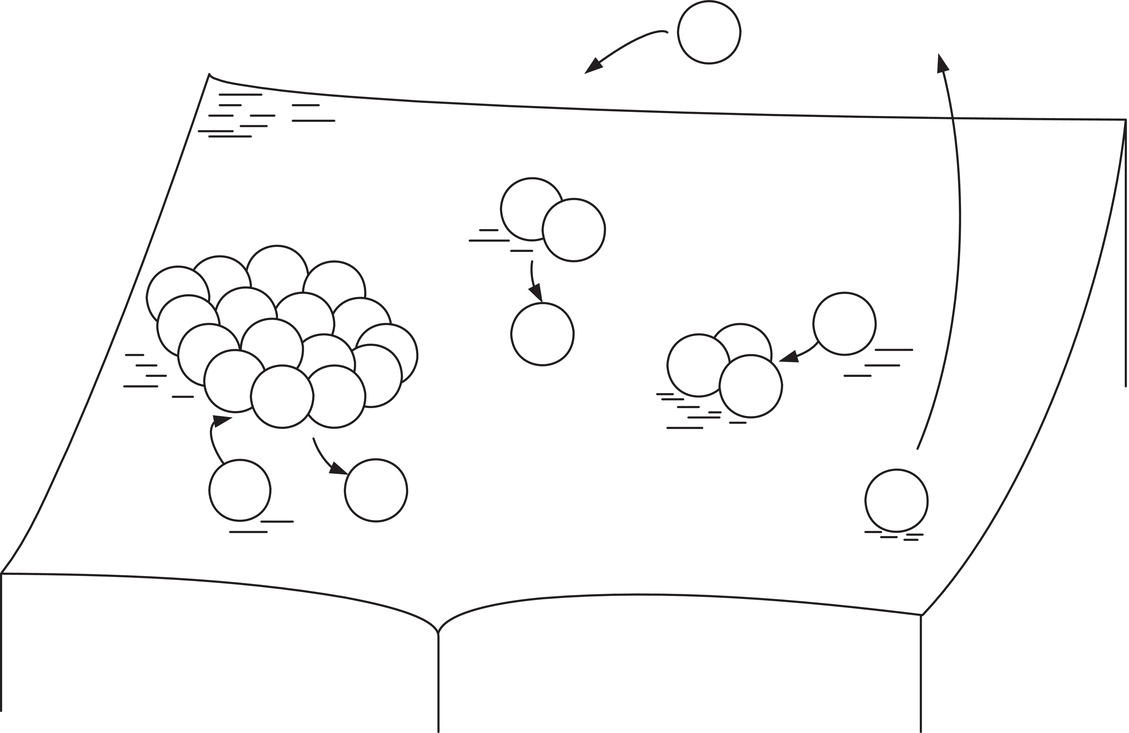
Figure 4.14 Formation of a two‐dimensional critical nucleus on a crystal surface.
4.3.1.3 Screw Dislocation (Spiral Growth)
All of the above models assuming two‐dimensional surface nucleation predict crystal growth rates at low supersaturation which are much lower than those observed in practice. A possible solution to this problem was put forward by Frank (1949), who proposed a self‐generating step creation process involving a screw dislocation. The model was further formalized by Burton et al. (1951) and became known as the Burton–Cabrera–Frank (BCF) model of crystal growth. Detailed discussion of the BCF model can be found in Ohara and Reid (1973) and Nyvlt et al. (1985).
Self‐generating step creation, such as that provided by the BCF model, involves inherently more rapid growth kinetics because of the more favorable energetics for addition of a molecule or cluster to the structure.
Figures 4.15 and 4.16 illustrate the formation of a screw dislocation. Excellent microphotographs of spiral crystal growth are shown in Figure 4.17 (Mullin 2001, pp. 221–222). In Figure 4.17, the lower left photo is of an organic substance (C36, normal alkane).
Dislocations can occur within crystals as a result of stresses in crystal growth on seeds and around surface nuclei and inclusions. Spiral and other self‐perpetuating growth can promote growth rate dispersion (different growth rates on different crystals of the same material) because each crystal is responding to the structure of its own unique dislocation(s).
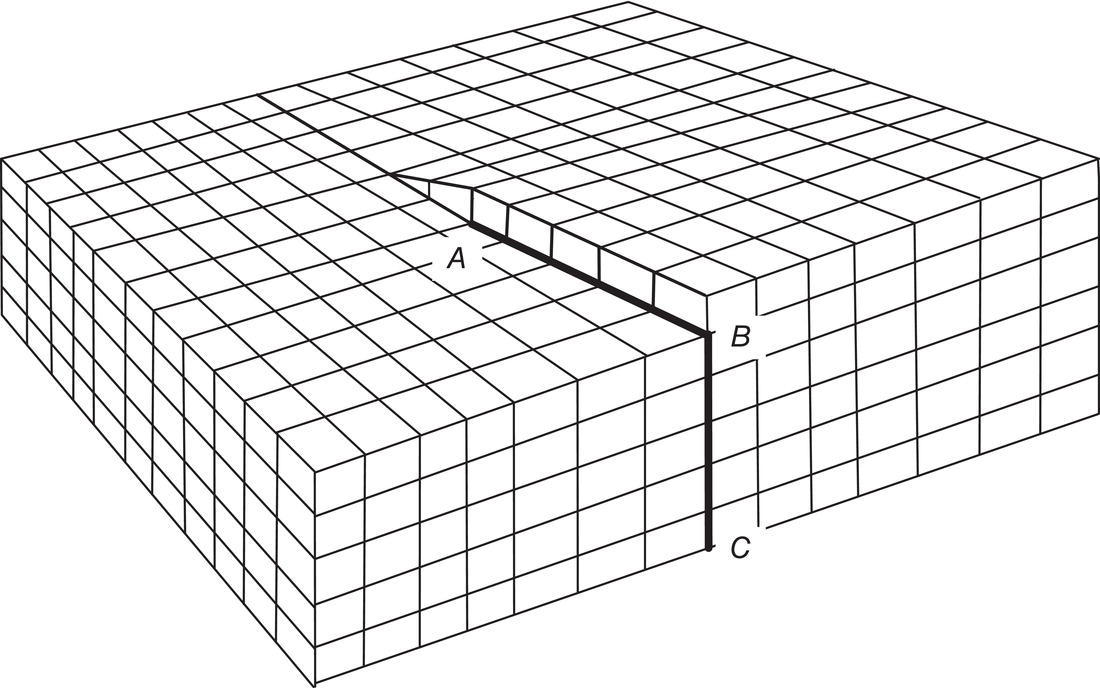
Figure 4.15 A screw dislocation in a simple cubic crystal. AB, BC are dislocations. The screw dislocation AD is parallel to BC (D is not visible).
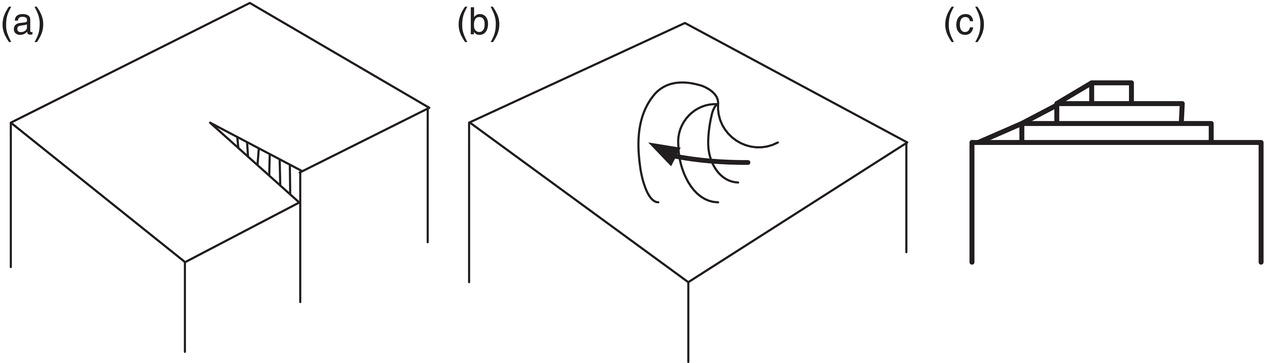
Figure 4.16 Development of a growth spiral starting from a screw dislocation: (a) start, (b) later, and (c) final spiral.
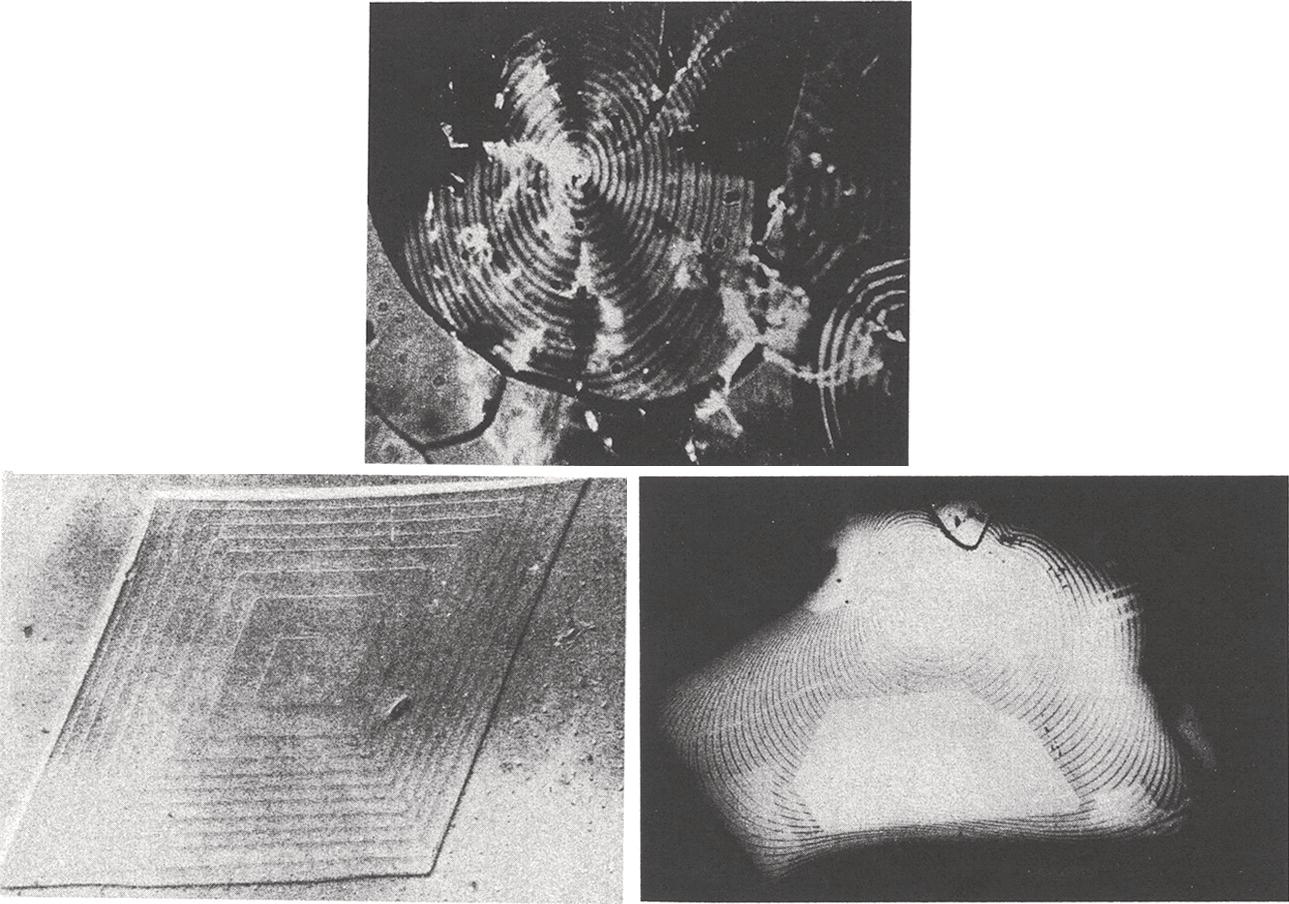
Figure 4.17 Examples of spiral crystal growth.
Source: Mullin (2001), pp. 221–222, by permission.
4.3.1.4 Effect of Impurities and Solvents
Impurities can affect the rates of nucleation and crystal growth, often (or usually) with an effect disproportionate to the amount involved. Part per million levels of impurity have been shown to profoundly influence the size, shape, and rate of growth of some industrially important compounds. Entities as common as table salt are often modified intentionally by producers seeking desirable properties.
One “impurity” always present in solution crystallization is the solvent. It is present, of course, in larger quantity, and in addition to the problem of (often multiple) solvated entities, the solvent molecules must rapidly diffuse away from the growing crystal faces.
The interfacial layer of molecules on a growing crystal surface is considered by most to be intermediate in structure between fully crystalline and amorphous layers. Impurity molecules and clusters from this layer are in competition with the desired compound for adsorption sites on the surface. Figure 4.18 illustrates adsorption of impurities in the kink sites, steps, and ledges shown in Figure 4.13.
Equilibrium incorporation of impurities can take place if they occupy spaces meant for other solute molecules (substitional defects), actual open spaces (vacancy defects), or smaller interstitial spaces. Nonequilibrium impurity uptake (in inclusions, dislocation planes, permanently adsorbed entities, and impurities left in adhering mother liquor) is common at the higher rates pushed in industrial processes, because the solute molecules attracted to the surface at a high rate can physically slow down reverse diffusion of the impurity. Additionally, any adsorptive attraction of the impurity to the crystal surface further exacerbates this effect.
Tailor‐made additives are sometimes used to inhibit growth or activity on certain faces. These are structurally designed molecules which fit these surfaces in a lock‐and‐key arrangement (Davey et al. 1991; Weissbuch et al. 1995).
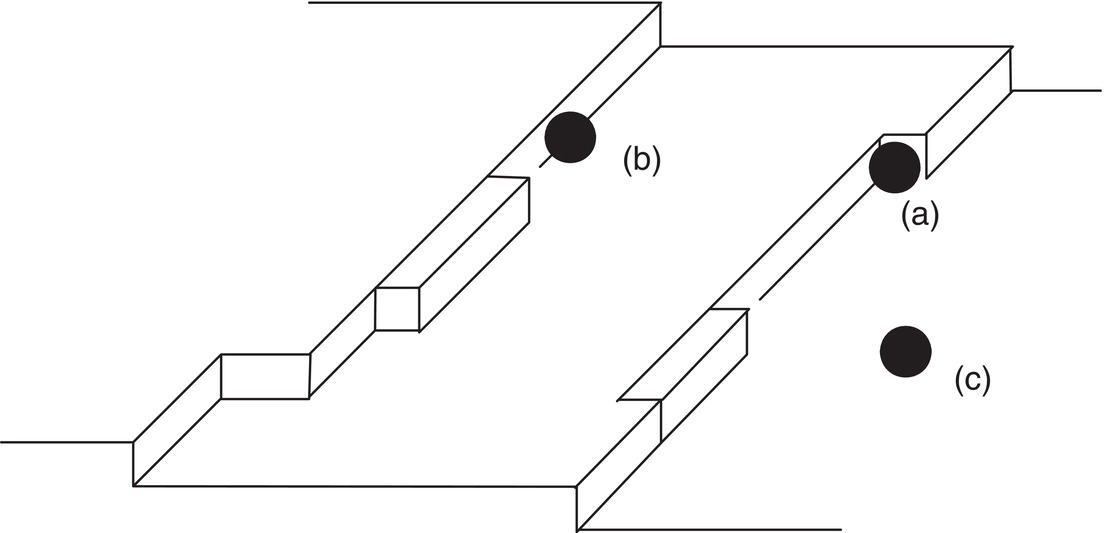
Figure 4.18 Distinct adsorption sites for additives and impurities: (a) kink, (b) step, and (c) ledge.
Table 4.1 First‐order growth rate constants (fluidized bed versus CSTR crystallizer system).
| k × 1000: g/h, cm2, g/cm3 | |||
|---|---|---|---|
| Fluidized bed | CSTR | ||
| Crystallizer temp. (°C) | No nucleation suppressant | Nucleation suppressant added | |
| 25 | 40 | 2.2 | |
| 35 | 70 | 16 | 2.3 |
| 41 | 90 | 2.3 | |
| 46 | 4.1 | ||
Impurities, added or unintentional, can have a major effect on rates of nucleation and crystal growth. Table 4.1 shows the effect of an impurity, structurally similar to the crystallizing solute, added to an all‐growth crystallization (separation of stereoisomers, Examples 7.6 and 13.6). The data for a continuous stirred tank (CSTR) operation show a sevenfold decrease in the first order growth rate constant as a result of addition of this impurity to prevent nucleation of the undesired isomer.
It is clear, in this case, that the suppressant impurity “poisons” the growth surface, presumably by adsorption (CSTR with suppressant versus no suppressant). A higher growth rate in the fluidized bed versus the CSTR implies considerable diffusional resistance (higher fluid slip velocities in the fluidized bed result in improved growth rate).
Impurities are known to profoundly affect crystal morphology. The texts referred to near the beginning of this chapter offer some structural models of impurities that interface with the growth of specific faces. An example from the authors’ experience is shown in Figure 4.19. The three microphotographs are of the same crystal form of a compound “spiked” with small amounts, respectively, of each of three known impurities normally present in much smaller amounts in the mother liquors from which growth is taking place.
4.3.1.5 Mass Transfer Limited Growth
Crystallization from solution often has to overcome serious limitations in bulk diffusion, particularly in large‐scale industrial crystallizers. These limitations have been addressed in a number of formats.
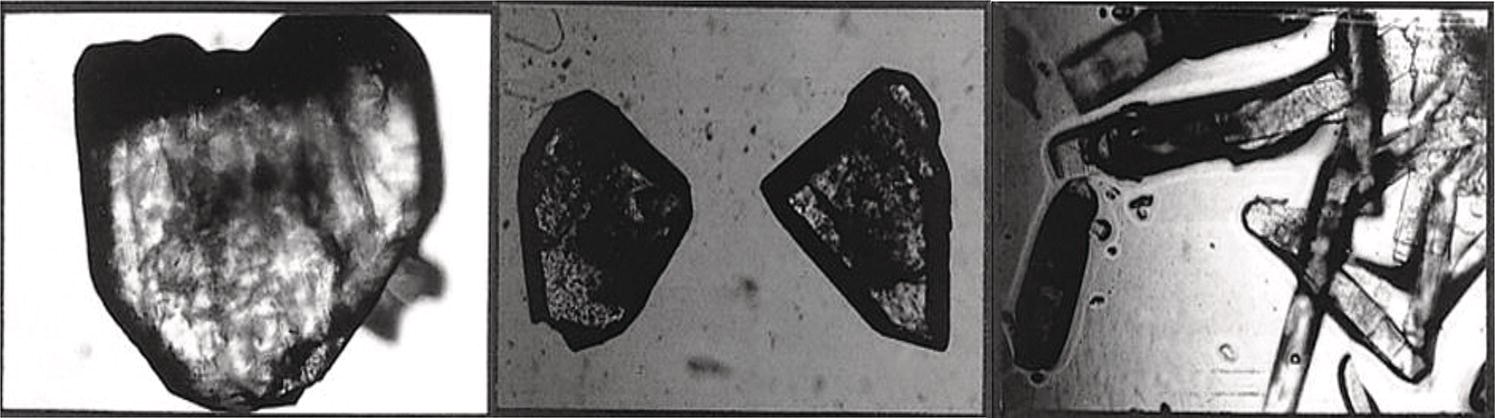
Figure 4.19 Low levels of impurity can affect crystal morphology: three views of the same compound grown under the same conditions with different known impurities.
The best‐known of the early developments addressing mass transfer effects on the BCF model was that of Chernov (1961), setting diffusion of solute through a boundary layer as the rate‐limiting step. Other, more complex descriptions taking both surface and bulk diffusion into effect have been presented by Bennema (1969) and Gilmer et al. (1971).
An effectiveness factor has been presented by Garside (1971) as the ratio of the actual growth rate to the one that would occur if the interface were exposed to the bulk conditions. This is also presented as a Damkoehler number, but it is different from the Damkoehler numbers described in Chapter 6, which relate to mixing time/process time ratios.
Diffusion‐limited crystal growth processes require attention to mixing and other aspects of fluid flow around the crystals. These issues will be discussed in more detail in the following chapter on mixing. As an example of the effect of hydrodynamics on crystal growth kinetics, refer to Table 4.1 in the above discussion on effect of impurities. Comparing the growth rate in a fluidized bed with that in a CSTR, both with no added impurity, results in more than a fourfold improvement in the fluidized bed under the same process conditions. The most credible explanation for this improvement is the increased slip velocity of the fluid around the fluidized particles. The positive effect of higher temperature on growth rate, in this case, is probably caused by a reduction in resistance to both mass transfer and surface integration.
4.3.1.6 Kinetic Order for Crystal Growth
The introductory section of this chapter cites texts showing full development of the crystal growth models described above. Those models describing continuous growth, two‐dimensional nucleation, and screw dislocation (BCF and variants), with or without diffusional limitation, predict values of kinetic order (exponent r) between 1 and 2 in the expressions
and
where G is linear crystal growth velocity and RG is the mass growth rate per unit surface area. The growth rate constants kG and kGM are temperature dependent.
The experience of the authors is in general agreement with a growth kinetic order between 1 and 2. Indeed, many pharmaceutical compounds exhibit simple first‐order growth with no complication. There are some exceptions, however, and some of these come without explanation. Figure 4.20 shows (relative) growth rate constants (kGM) for a cooling, all‐growth crystallization of a compound solubilized by the presence of an acid (acid salt more soluble than the free base). As can be seen, the kinetic order is 2.5. The compound in Figure 4.20 is one of several that have shown some level of higher‐order kinetics.
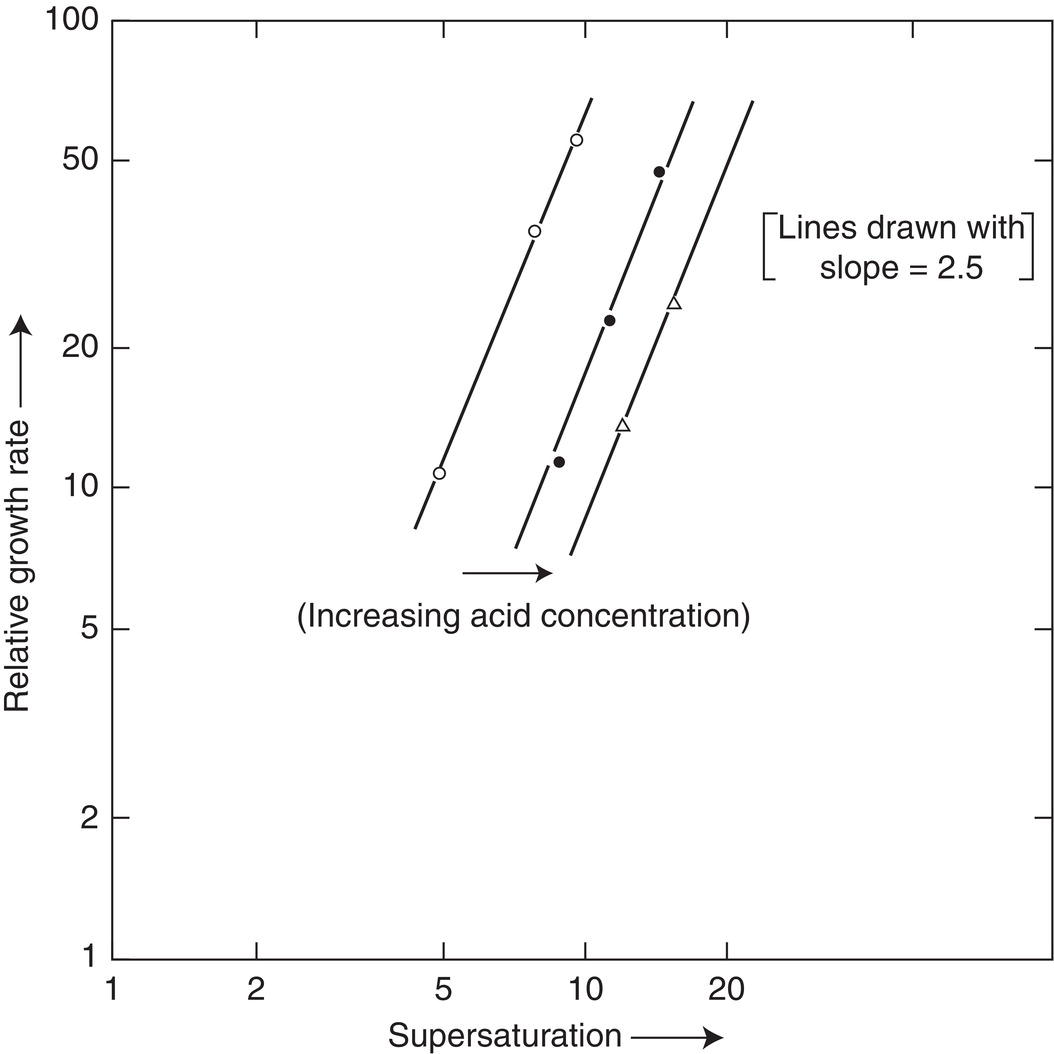
Figure 4.20 Shown is 2.5‐order growth for a pharmaceutical compound solubilized by acid.
4.3.1.7 Size‐Dependent Growth and Growth Rate Dispersion
Models of crystal growth generally assume a size‐independent growth rate (obedience of McCabe’s ΔL Law, as noted in Section 4.3). Many exceptions have been found to this rule, with the rationale for them matching the situation.
- As discussed in Section 4.2.1 under Ostwald Ripening, very small particles (near the 1 micron range) are more soluble than larger ones because of unsatisfied outer bonds and resultant internal pressure. Thus, these very small particles grow more slowly because of a reduced supersaturation driving force. As will be further discussed in Section 4.5, with aging or temperature cycling, these particles can disappear from Ostwald ripening.
- Even in sizes considerably larger than the micron/submicron range, however, smaller crystals have been shown to grow at a lower rate than larger ones. The mechanisms include expected size dependence based on a higher expectation of surface dislocations (larger particles have higher mechanical stresses, collision energy, and impurity inclusions) and bulk diffusion effects (higher slip velocity for larger crystals). Rate expressions incorporating these effects have been summarized by Randolph and Larson (1988).
Situations 1 and 2 are referred to as size‐dependent growth. Another reason for variation of growth rates in a crystal population is growth rate dispersion. This dispersion occurs because of differences in individual crystals. These differences are based on (i) inherent properties of each nucleus, (ii) fluctuations with time of each nucleus, or (iii) expected differences between crystals growing from (differently sized) dislocations by the BCF mechanism described in Section 4.3.1.3 or by others.
Size‐dependent growth and growth rate dispersion do affect the ultimate size distribution in industrial crystallizers. To a large extent, measurement of growth rates with large numbers of crystals in suspension adequately compensates for individual variations within the crystal population.
4.3.2 Agglomeration Mechanism
Figure 4.21 outlines the steps involved in forming the aggregates/agglomerates. On the left diagram, crystals are moving along with the fluid motion. In the middle diagram, individual crystals are in contact with each other due to the fluid motion in agitated systems and form the loose aggregates. For ease of discussion, these contacts can be classified as point‐contact, line‐contact, or surface contact. The strength of the contact or bridge will depend upon the contact time and crystal growth rate. If the contact/bridges between crystals are not sufficiently strong, these loosely bridged crystals can disintegrate back into individual crystals. On the other hand, with sufficient contact time and crystal growth, these loosely bridged crystals can form stronger bounded aggregates/agglomerates and can be difficult to disrupt, as shown on the right diagram. These agglomerates increase the overall particle size and can entrap solvents which containing impurities.
Figure 4.22 shows an example of crystallization with and without particle agglomeration. In this case, both the batch stream and the anti‐solvent streams are added to the crystallizer. When the streams are added above‐surface, it generates a nonuniform high local supersaturation at the addition points, which leads to formation aggregates/agglomerates with a mean particle size of 38.7 μm (Figure 4.22, left picture). When the two streams are added sub‐surface, it generates a much more uniform supersaturation across the entire batch. The batch forms much more uniformly dispersed crystals with minimum degree of agglomeration with a mean particle size of 23.7 μm versus the theoretical prediction of 22 μm for all crystal growth process (Figure 4.22, right picture).
A natural consequence of agglomeration is increase of overall particle size. For needle‐like crystals, the increase in particle size would facilitate filtration and improve solid powder properties. Agglomeration can lead to formation of multi‐modal nonuniform particle size distribution. A special technique, namely spherical agglomeration/crystallization, attempt to generate more uniform agglomerates (Sheikh et al. 2008; Javadzadeh et al. 2015; Chen et al. 2019).
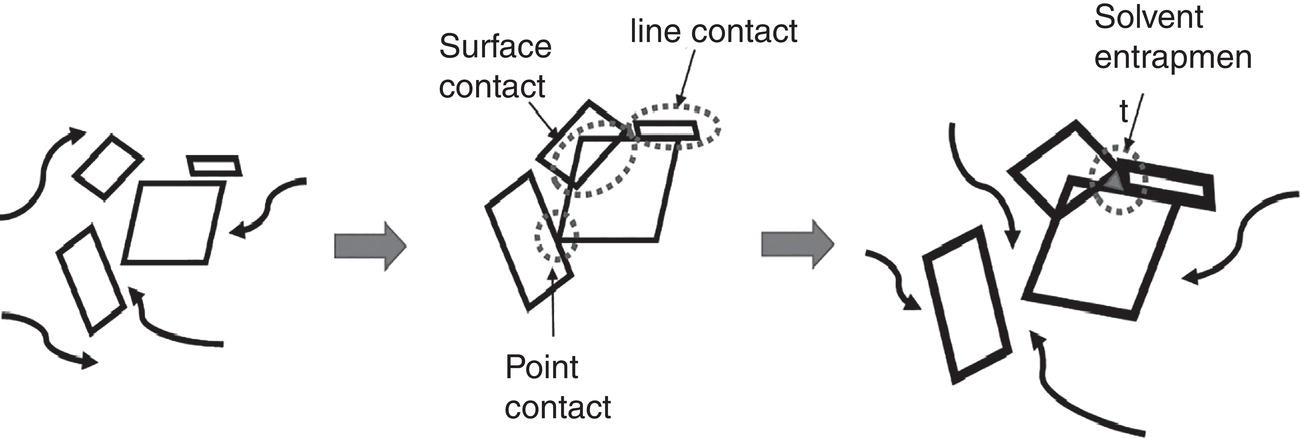
Figure 4.21 Mechanism of aggregation/agglomeration.
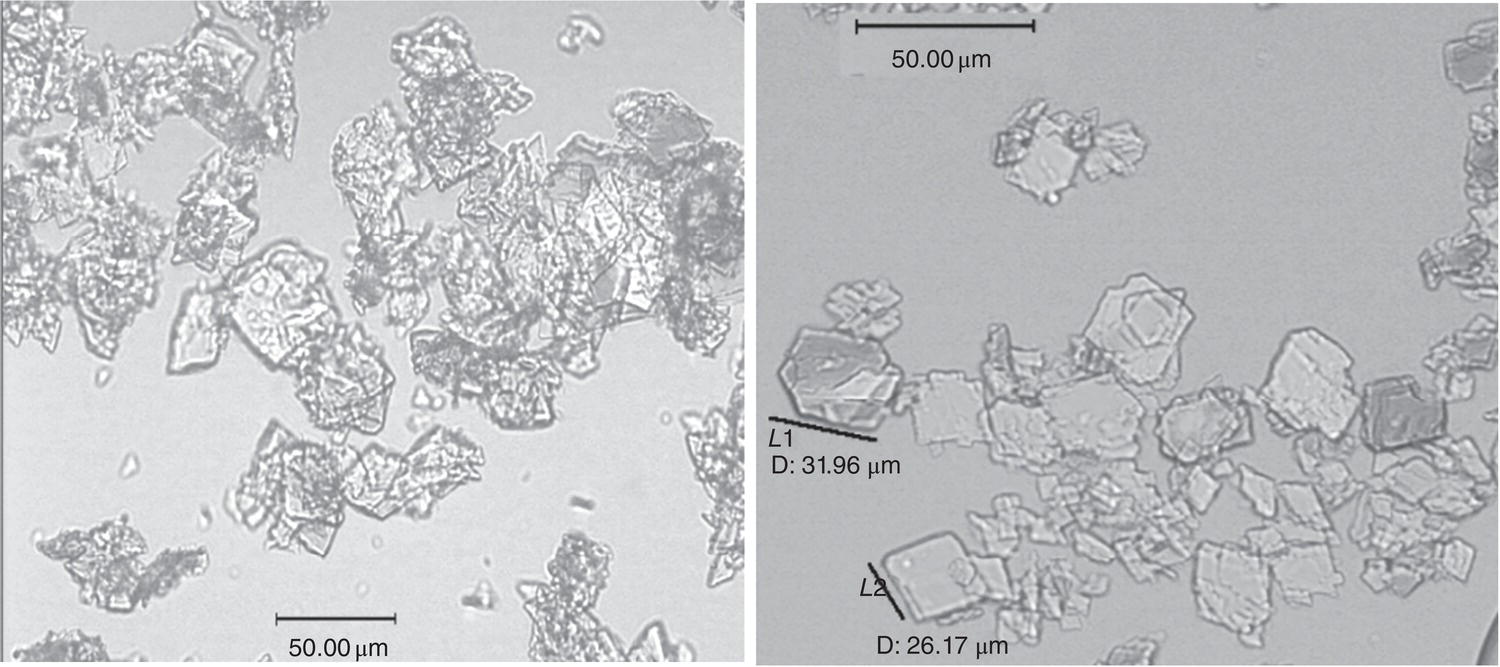
Figure 4.22 Crystallization with (left) and without (right) agglomeration.
However, agglomerates may enhance entrapment of mother liquor in these agglomerates during the crystallization, which will lead to poorer crystal purity as shown in Figure 2.27 of Chapter 2.
4.3.3 Measurement of Crystal Growth Rate
Measurements of both nucleation and growth rates are of great assistance in the development of a crystallization process. Since the authors of this book encourage the use of growth‐based processes if possible, these measured growth rates can then be used to assist at all levels of scale‐up.
Newer, in‐line techniques are making it possible for easy measurement of the growth rate (and the nucleation rate under these conditions) in small‐scale experiments. Myerson (2001), Mullin (2001), and Mersmann (2001) provide excellent descriptions of methods for crystal growth rate measurements. These methods involve measurements of either single crystals or suspensions. Much information can be gained from the traditional technique of measuring (“grab” samples or in‐line) solute concentration versus time in batch crystallization on a seed bed. Initial and later slopes on such a plot can provide multiple data points of growth rate versus supersaturation.
4.3.3.1 A Useful “Workhorse” Measurement System
The authors have found that semicontinuous crystallization in a small fluidized bed (typically 1‐inch diameter), in a system shown schematically in Figure 4.23, provides excellent, high quality data usable through scale‐up to full‐sized manufacturing processes. The “dissolver” vessel is maintained as a saturated slurry by using an excess of solid and an internal filter (examples: sintered vessel bottom or sintered “candle” filters).
Optional features of this system are as follows:
- The fluidized bed crystallizer typically has a screen support (as in a commercial chromatography column) but can be operated without one by use of a tubing clamp on the column inlet line. (The clamp must be closed quickly whenever the pump is stopped.)
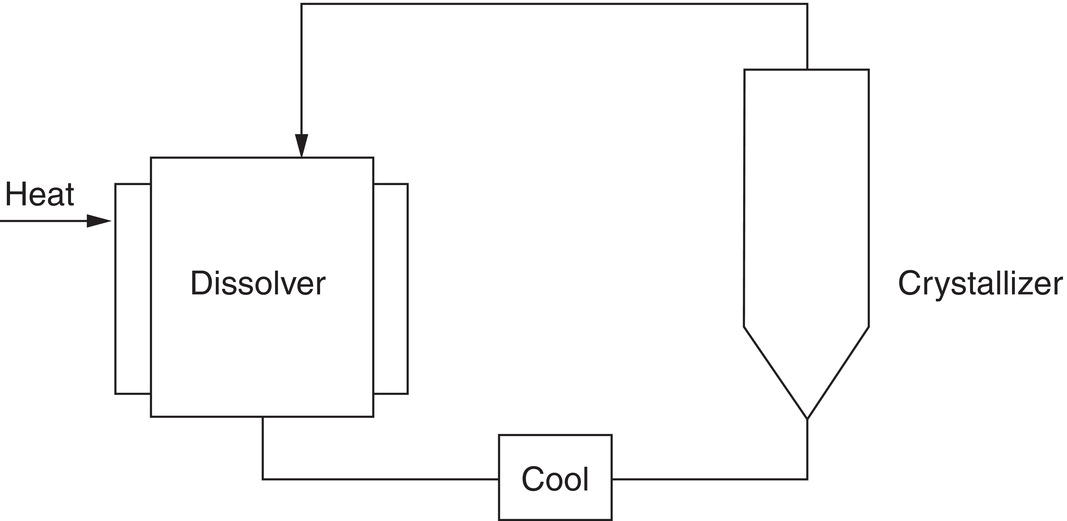
Figure 4.23 Fluidized bed crystallizer growth rate test apparatus.
- If the crystallizer is run at ambient temperature, it is not necessary to use a jacket on the column. However, even at ambient internal temperature, the crystallizer shows reduced (or totally eliminated) internal wall growth if a jacket is used (even without cooling fluid).
- The crystallizer exit stream can have an optional bypass through a line filter (typically sintered glass), which is used for the first 10 minutes or so. This filter can collect fines present in the feed solid caused by the breakup of agglomerated, inherently smaller particles. The weight of solids collected in the line filter is deducted from the initial seed weight when calculating the growth rate. The line filter, in most cases, is not needed, but if one is available, it is useful to check it out when embarking on a set of experiments using new seed material.
- Typically, using about 5 g of mono‐sized seed (usually a sieve fraction), and harvesting after several hours of operation, can produce an accurate and reproducible growth rate measurement. The effects of supersaturation (including the data in Figure 4.20), impurity level in the mother liquors, and absolute temperature are easily determined.
The final dry weight of the product can be used to measure the growth rate, which can be calculated assuming constant surface area/mass:
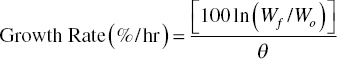
where Wf/Wo = final seed mass/initial seed mass and θ = time (h).
This measured growth rate incorporates the surface area and supersaturation terms in the kinetic expression:
where kGM is the constant from Eq. (4.5) and A is the total surface area.
If sufficient growth has taken place that change in surface area/mass should be taken into account, then surface area/mass (for three‐dimensional growth) is proportional to (Wf/Wo)2/3 and he initial growth rate, which represents the productivity of the initial seed before reduction in surface area/mass, may be particularly useful if that seed is to be used in a scaled‐up operation:
4.3.4 Crystal Population Balance
The population balance approach to measurement of nucleation and growth rates was presented by Randolph and Larson (1971, 1988). This methodology creates a transform called population density [n(L)], where L is the characteristic size of each particle, by differentiating the cumulative size distribution N versus L, shown in Figure 4.24, where N is the cumulative number of crystals smaller than L. Per unit volume, the total number of particles, total surface area, and total volume/mass are calculated as the first, second, and third moments of this distribution.
Randolph and Larson showed that for a steady‐state continuous crystallizer with a (perfectly) mixed suspension, (perfectly) mixed product removal (MSMPR) crystallizer,
where no is the population density at L = 0 (i.e. the nuclei), G is the linear crystal growth rate, and τ is the residence time in the crystallizer.
Thus, running an MSMPR experiment and plotting (ln n versus L) should result in a straight line with slope (1/Gτ), as shown in Figure 4.25. The line from MSMPR experiments is usually straight but often has variants. These are shown in Figure 4.26. Since τ is known, the linear growth rate is known under the crystallization conditions. The intercept no is converted to the nucleation rate Bo by the relation
While this methodology has been shown to be very useful for many crystallization processes, it is subject to size dispersion and the other nonlinear effects of Figure 4.26, and has the additional need to assure (perfect) mixing up to and including the product exit line. Use of large amounts of material is often impossible for pharmaceutical products in the early stages of development, so this technique has only limited use in our industry.
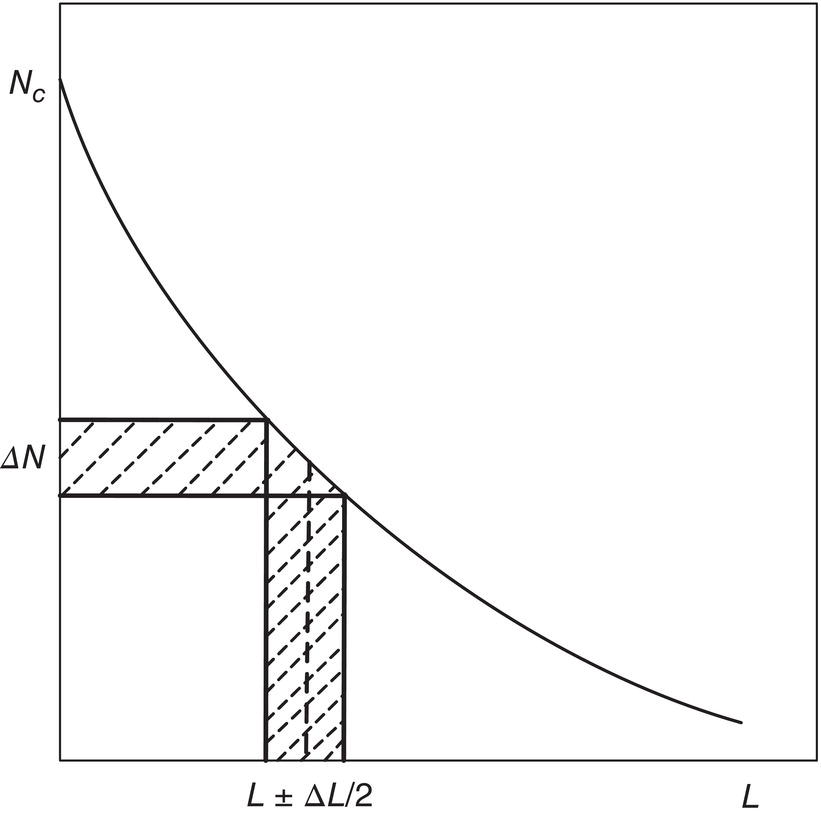
Figure 4.24 Size and number intervals for computation of population density.
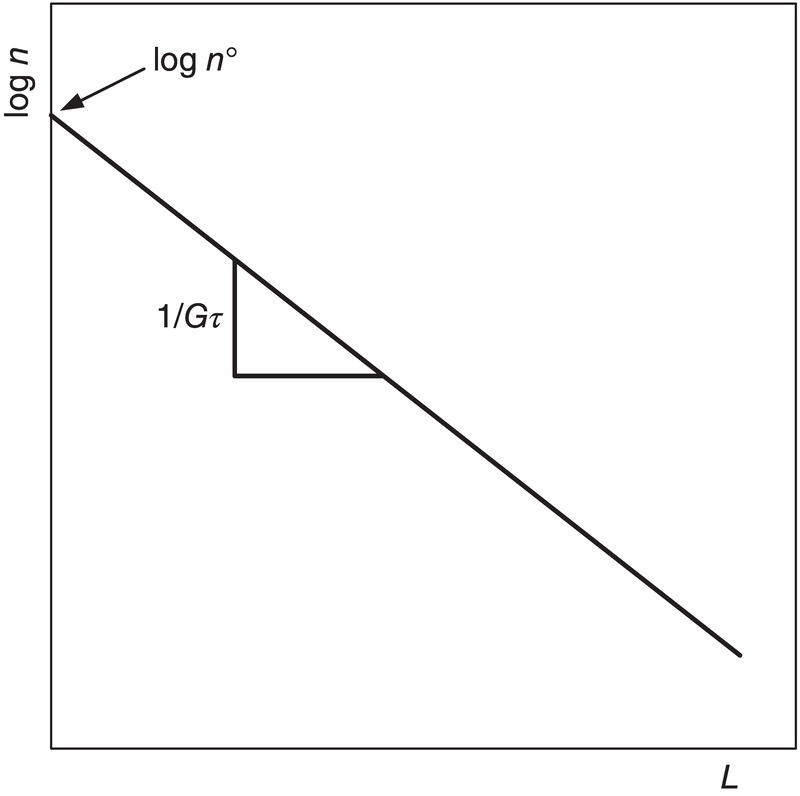
Figure 4.25 Graphic representation of the population balance of the MSMPR crystallizer.
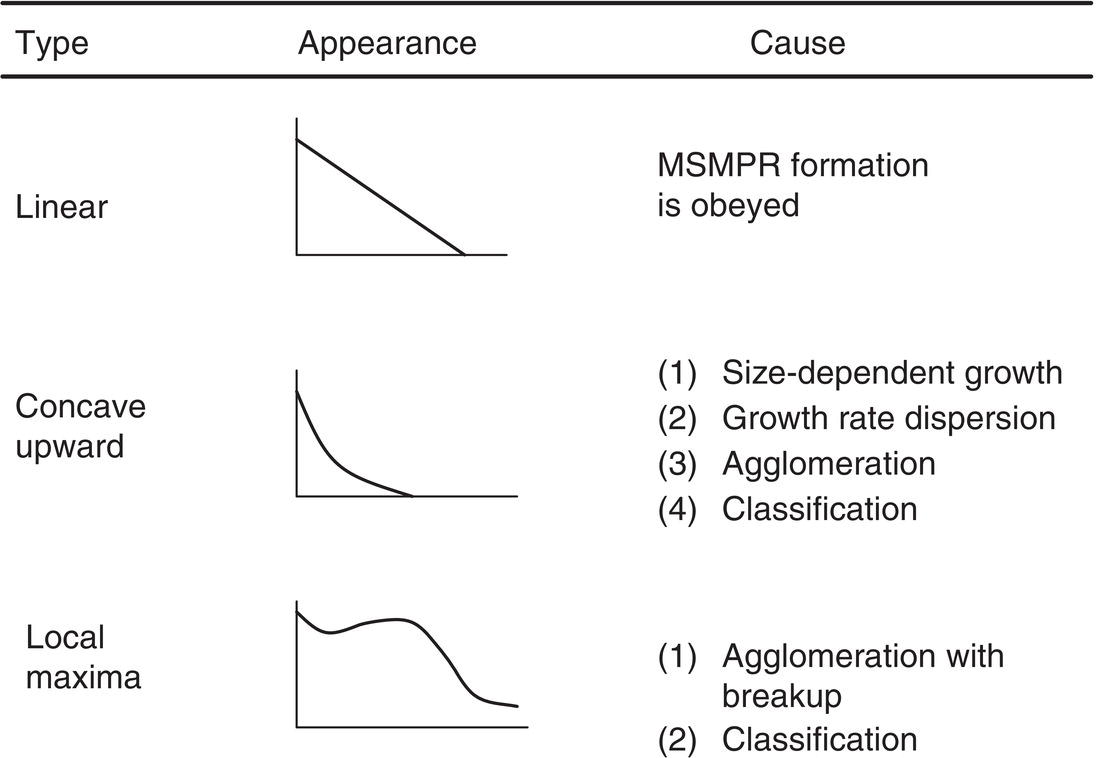
Figure 4.26 Summary of semi‐logarithmic population density plots and potential causes.
4.4 NUCLEATE/SEED AGING AND OSTWALD RIPENING
Ostwald ripening, the disappearance of very small crystals because of an increase in solubility, has been discussed in Sections 4.2.1 and 4.3.1. Despite the fact that the concept applies most directly to particles ≤1 micron in size, it has considerable commercial significance because of its participation in the aging of seed to increase the size, narrow the size distribution, and improve the crystallinity of particles in a crystal growth operation. Mullin (2001, pp. 320–322) contains an excellent discussion of this phenomenon.
Seed particles are produced in many ways, and their production and use are discussed in many places in this book. Figure 4.27 shows typical methods in generating the seed and corresponding particle size ranges.
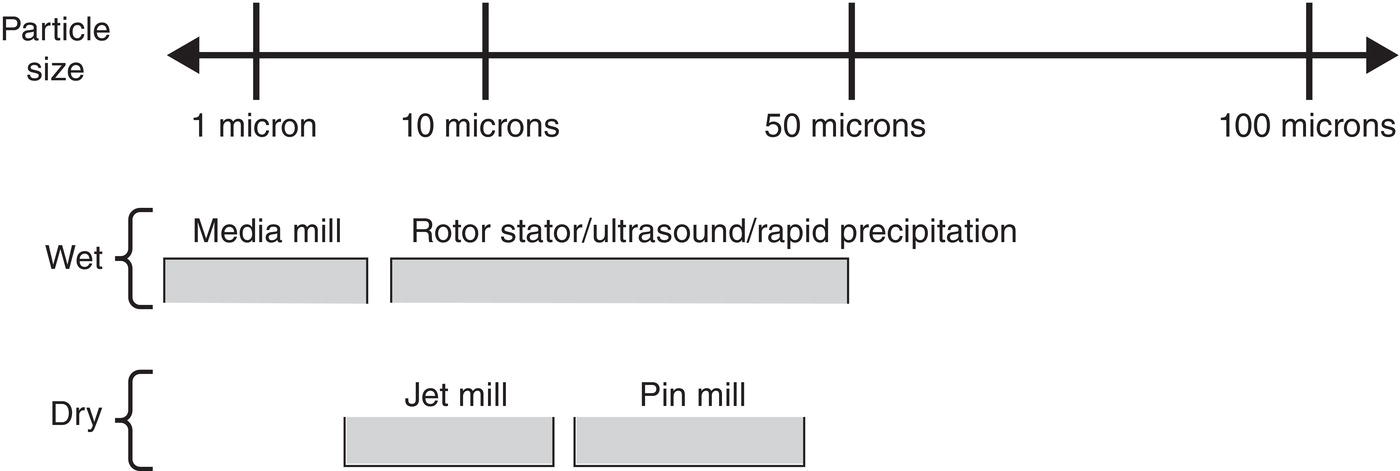
Figure 4.27 Methods of seed generation and corresponding size ranges.
Source: Tung (2013) with permission American Chemical Society.
Since nucleation can generate fine particle, nucleation under controlled supersaturation and mixing intensity can be utilized as an alternative to dry milling. As a matter of fact, because of this unique characteristic, nucleation with controlled supersaturation and mixing or namely in situ wet seed generation, can be applied to substitute dry milling. A recirculation loop around a crystallizer coupled with an in‐line mixer provides a suitable scheme for implementing this technique. As shown in Figure 4.28, under the reverse‐addition operation mode, the anti‐solvent is circulated through a crystallizer external loop which includes a high‐speed rotor/stator homogenizer. The dissolved batch is fed into the external recirculation loop of the crystallizer. The degree of supersaturation can be controlled by the feed rate and the recirculation flow rate in the crystallizer. The mixing intensity can be controlled by the rotor/stator configuration and the rotor tip speed. As demonstrated by Kamahara, et al. (2007), this approach successfully generates the final particle size at a mean size of 9–10 μm, which is much smaller than that obtained by the direct wet milling approach. Also, it eliminates the need for dry milling.
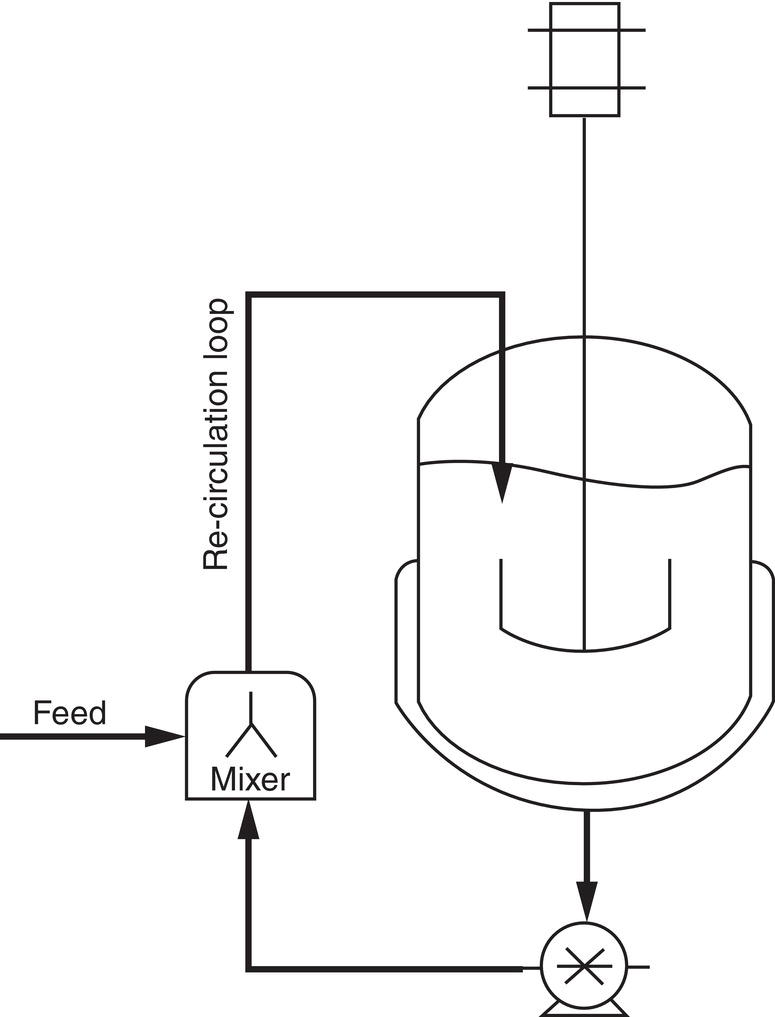
Figure 4.28 Generic diagram showing a crystallizer with an external recirculation loop and in‐line mixer.
Source: Tung (2013), with permission American Chemical Society.
The recirculation scheme can certainly be applied to forward addition mode operation where anti‐solvent (or reactant) is charged into the loop and the solvent containing the batch is circulated. For simultaneous addition mode, multiple streams can be simultaneously charged into the mixer/loop or one stream into the mixer/loop and other steam into the crystallizer. For reverse addition mode operation, the batch is charged into the loop and anti‐solvent is being circulated.
The whole operation may take place only for the seed generation stage, or can take place throughout the entire crystallization. Additionally, since mixing intensity or tip speed of the in‐line mixer is adjustable. One combination is to apply maximum mixing intensity (or tip speed) of the mixer during the seed generation stage for the purpose of generation of seed, and apply less intense mixing of the mixer during the rest of crystallization for the purpose of enhance crystal growth and deagglomeration.
Many seed generation processes, including contact nucleation (discussed earlier in this chapter) and milling, produce particles with more physical stresses and wider size distributions than desired for good growth operation. Seed aging is frequently utilized, either after seed addition or after initial nucleation, to minimize the smallest and most stressed particles in the population. In general, these particles are characterized by higher solubility, the smaller ones by a combination of the surface stresses and Ostwald ripening, and some larger ones by stresses alone. It should be pointed out that seed aging can be easily adapted into the in situ wet seed generation technique.
The aging, or ripening, of seed (and sometimes of the final product) can take place at a single temperature through normal dynamic equilibrium processes, but it can also be significantly accelerated by higher temperatures and, in particular, by temperature cycling. The overall process of seed aging carried out in this manner is thermal digestion. Several such processes are part of some of the examples in this book.
Using a similar set‐up as shown in Figure 4.28, Carrasquillo‐Flores et al. (2021) demonstrates that the rotor‐stator high shear mixer can greatly facilitate the conversion of metastable Form I to stable Form II. Table 4.2 extracts few representative data from the works. As expected, high shear mixer significantly accelerates crystallization kinetics and shorten the form conversion time.
4.5 DELIVERED PRODUCT: PURITY, CYSTAL FORM, SIZE AND MORPHOLOGY, AND CHEMICAL AND PHYSICAL STABILITY
Crystallization processes using either added or nucleated seed can be designed to manufacture product with the desired product attributes, including final product purity, crystal form, particle size and morphology, purity, and chemical and physical stability. The following steps must be taken to achieve this goal:
- Seed crystal forms, size, and amount including, including in situ wet seed, must be controlled and reproducible.
- Supersaturation and mixing environments must be designed to minimize or eliminate unexpected nucleation beyond that required for seed. A seed age step must be added if needed.
The seed impact is highlighted in various examples in the subsequent chapters, for example kinetic resolution of optical isomers, particle size control, and chemical stability, etc. In general, the better the seed (i.e. less defects, higher amount, and more uniformly dispersed), the better the final product.
Supersaturation will affect the kinetics, in particular the ratio of nucleation/crystal growth. A higher supersaturation ratio will generally lead to higher ratio of nucleation/crystal growth. The supersaturation impact is highlighted in various examples in earlier and later chapters of the book, for example rejection of impurity and particle size distribution, etc. In general, the less the ratio of nucleation/crystal growth, the better the final product.
It should be pointed out that if a higher degree of nucleation is created by a higher level of mixing intensity as employed in the in situ seed generation approach, it does not necessarily affect the product purity. Because a high intensity mixing is employed to facilitate the nucleation for seed generation, instead of relying entirely on supersaturation. More discussion will be provided in the subsequent Chapter 5—Mixing.
The ultimate particle size distribution can be calculated by simple geometry. A simple calculation is shown in Table 4.3 for growth on 5 micron cubes at different seed/nucleate levels, for three‐, two‐, and one‐dimensional growth. Depending on the relative growth rates of the faces of a given crystalline product, it can be considered to grow in a one‐, two‐, or three‐dimensional form. Pharmaceutical products from these respective growth types are shown in Figure 4.29 and Chapter 2.
As noted in the note at the bottom of the table, some resultant particles cannot be expected to survive under normal conditions of mixing or fluid dynamic conditions, because in real industrial crystallization processes, nucleation and crystal growth inevitably occur simultaneously.
4.6 DESIGN OF EXPERIMENT (DOE)—MODEL‐BASED APPROACH
To better design the crystallization process to meet the desired product quality, integrating the crystallization kinetics modeling with PAT technology has been proven helpful (Togkalidou et al. 2004; Fujiwara et al. 2005; Woo et al. 2006; Zhou et al. 2006, Tung 2013) in consideration the followings:
- Statistical 2x factorial DOE is resource‐extensive, where X factor includes seed size, amount, supersaturation upon seeding, cooling profile, anti‐solvent, reactant charging profiles, etc.
Table 4.3 Effect of extent of seed or initial nucleation on final crystal particle size.
Product particle dimensions Seed or nuclei → Length (5 μm) Width (5 μm) Thickness (5 μm) Product: A. Cubic particles (three‐dimensional growth) Seed level 0.5% 29 μm 29 μm 29 μm 1% 23 μm 23 μm 23 μm 5% 14 μm 14 μm 14 μm 10% 11 μm 11 μm 11 μm Product: B. Flat plates (two‐dimensional growth) a 0.5% 71 μm 71 μm 5 μm 1% 50 μm 50 μm 5 μm 5% 22 μm 22 μm 5 μm 10% 16 μm 16 μm 5 μm Product: C. Needles (one‐dimensional growth) a 0.5% 1000 μm 5 μm 5 μm 1% 500 μm 5 μm 5 μm 5% 100 μm 5 μm 5 μm 10% 50 μm 5 μm 5 μm a Very thin particles are unlikely to survive attrition in the tank.
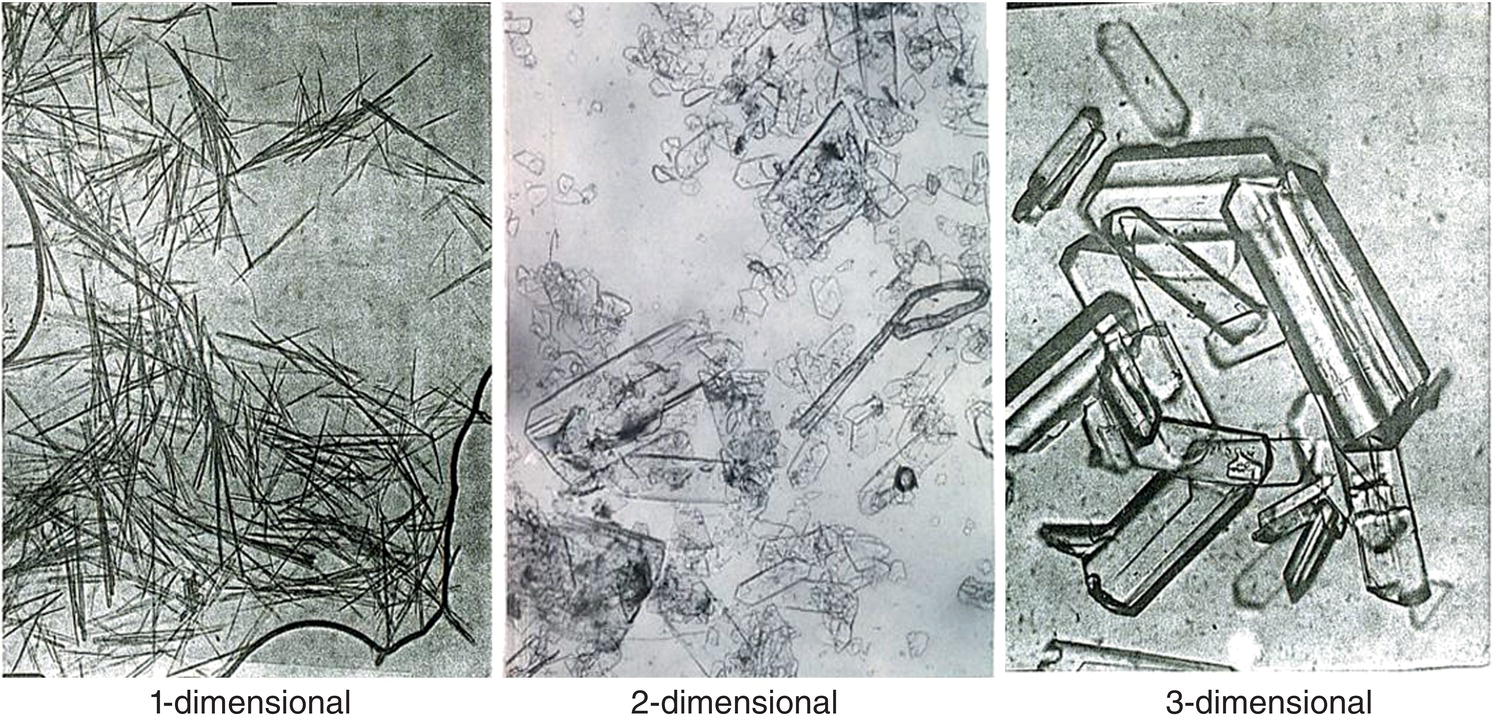
Figure 4.29 Typical crystal shapes.
- Crystallization kinetics are compound‐specific, process recipes cannot be transferred directly across the compounds.
- In silico tool provides an excellent QbD tool for optimum process design with minimum number of experiments and improvement of understanding.
A basic procedure for the Modeled‐Based Experimental Design (MBED) is outlined below:
- Estimate crystallization and nucleation kinetic parameters by fitting existing experimental data, including particle size distribution and solution concentration profiles, during the crystallization via population balance as outlined at the beginning of this chapter.
- Design seed (amount, size, or surface area) and crystallization paths (cooling, anti‐solvent/reactant addition profiles, etc.) to minimize uncertainty in parameters. The choice of seed and the crystallization path may be driven toward a growth‐dominant, nucleation‐dominant, or a hybrid process, depending on uncertainties in the kinetic parameters.
- Conduct additional experiments and confirm results with prediction.
- Optimize seed and the crystallization path to meet design targets.
As demonstrated (Togkalidou et al. 2004), in using this methodology only three experiments were sufficient to fully optimize a cooling crystallization process with a high confidence level of kinetic parameters. In the work, the uncertainty of crystal growth exponential factor g is reduced from ±30% (first experiment) to ±11% (second experiment). Similarly, the uncertainty of nucleation exponential factor b is reduced from ±50.4% (first experiment) to ±12.4% (second experiment). In the third experiment where the cooling profile and seed are optimized under specified process constraints.
As shown in Figure 4.30, while all three batches have the same starting and ending temperature and total cooling time, the batch is rapidly cooled initially, following by aging and slow cooling for the optimized one (experiment 3). In comparison, batch is slowly cooled initially (experiment 1) and rapidly cooled (experiment 2). Also with increase of seed charge from 3 to 6%, the results of the ratio of mass grown on the nucleated particles over mass grown on the seed is reduced from 61% (experiment 1) or 94% (experiment 2) and 21% (experiment 3). This is a significant impact on the final product, not to mention the saving of resources.
The same methodology can be applied to explore other crystallization variables, such as impact on solvent on crystallization kinetics. For another compound of interest, the in silico approach finds that isoamyl alcohol/water 95/5 system has a higher degree of crystal growth over nucleation over isopropyl alcohol/water 4/1 system, but with a slower overall kinetic, as shown in the following Table 4.4. Needless to say, this knowledge greatly enhances the understanding of crystallization behavior in different solvents and facilitate a rationale selection of solvents with minimum resources.
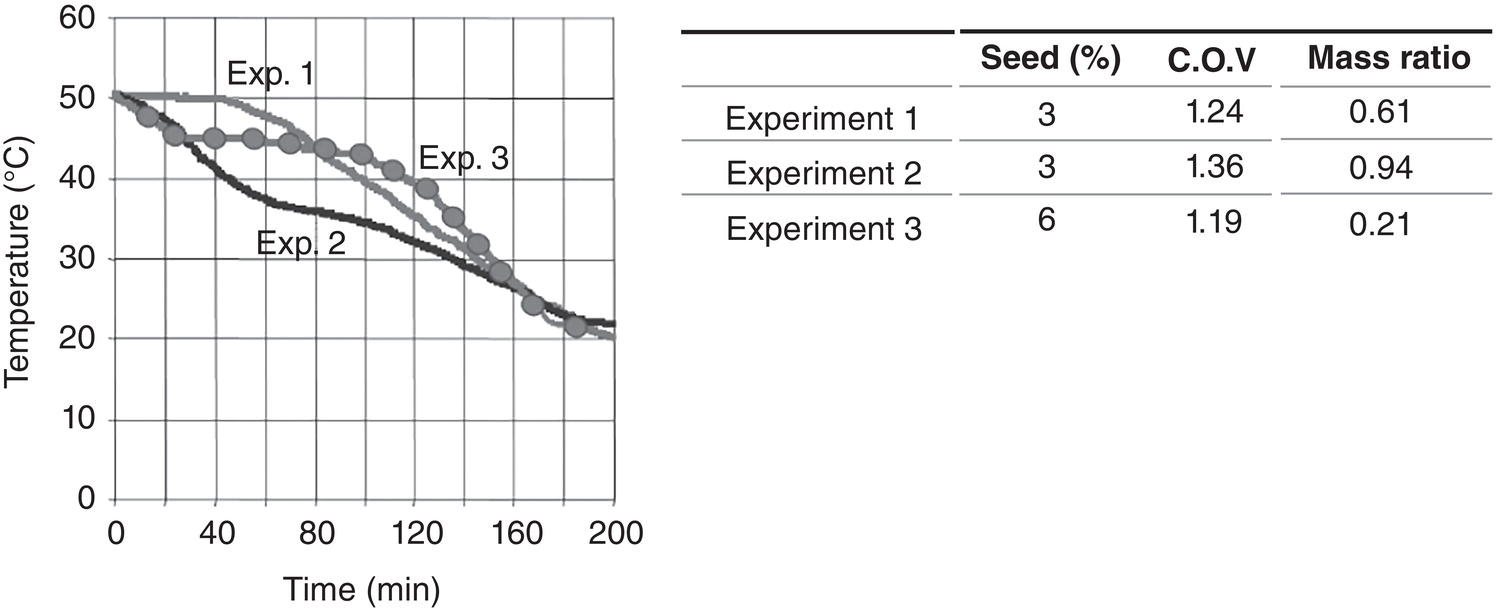
Figure 4.30 Cooling profiles and mass ratio of three experiments.
Source: Togkalidou et al. (2004) with permission American Chemical Society.
Table 4.4 Nucleation and crystal growth rate in different solvent systems.
| Temp, °C | Kb, #/(ml·min) | Kg, μm/min | B | g |
|---|---|---|---|---|
| Solvent Mixture: isoamyl Alcohol/water 95/5 | ||||
| 40 | 1.42E + 04 | 2.78E + 01 | 4 | 2 |
| 60 | 1.80E + 04 | 1.12E + 02 | 4 | 2 |
| Solvent Mixture: isopropy alcohol/water 4/1 | ||||
| 25 | 6.86E + 09 | 6.70E + 02 | 4 | 2 |
| 45 | 3.98E + 10 | 5.44E + 03 | 4 | 2 |
| 65 | 2.01E + 12 | 7.60E + 04 | 4 | 2 |
The in silico approach can explore various scenario of process option for optimization. Figure 4.31 highlights one case where it explores the impact of seed on crystallization behavior.
As shown in Figure 4.31, under 25% seed loading, using a seed size of 2 μm, approximate 80% of remaining batch grows on the seed. In other words, approximate 20% of remaining batch are grown on the nuclei formed during the crystallization. As the seed size increases, the percentage of mass grown on the seed decreases, and the percentage of mass grown on nuclei formed during the crystallization process increases. Using a seed size of 50 μm, less than ~25% of the remaining batch grown on the initial seed and ~75% of the batch on the nuclei formed during the crystallization process. This clearly demonstrates the impact of seed size to achieve growth‐dominant crystallization process.
Externally adding 25% seed at a size of 2 μm is really not a practical process option. However, in situ wet seed generation approach, which can generate fine particles and a high level of seed amount for crystallization, would be a good technique to overcome this challenge. As a matter of fact, per author’s perspective, in situ wet seed generation can be considered to be the “best practice” for seeding, as illustrated through this case.
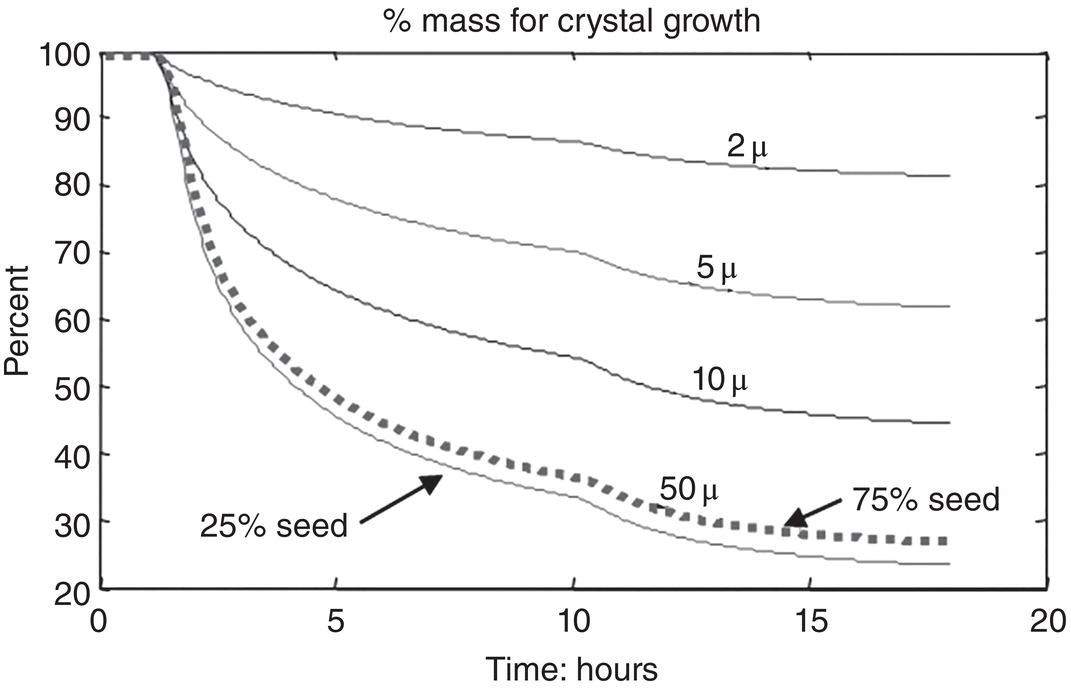
Figure 4.31 In silico screening of seed impact on crystallization.
The limitations of MBED methodology reside primarily in the validity of the population balance equation and the accuracy of experimental data of particle size distribution and solution concentration. The population balance equation may not be completely accurate to describe all the observed crystallization behaviors such as particle aggregation or breakage. The measured experimental particle size data by the in‐line particle size analyzer probe may not be representative, due to the hydrodynamic flow pattern in the vicinity of the probe during the crystallization.
Despite these limitations, MBED methodology still provides more valuable quantitative information, beyond qualitative trending of particle size distribution. To the author's knowledge, MBED methodology has been successfully implemented in practice. The exact experimental procedures and numerical algorithms for parameter estimation and optimization can vary from user to user and from company to company. The key to the success of crystallization are seeding and controlling the supersaturation to maximum crystal growth.
4.7 MODEL‐FREE FEEDBACK CONTROL
Another approach to control the nucleation or crystal growth during crystallization is via feedback control of supersaturation and/or nucleation and crystal growth. To achieve this, it would require in‐line PAT tools to collect the required batch information real‐time, such as particle size analyzer for particle size distribution or FT‐IR or UV–Vis spectrometer for solution concentration. The real‐time information is fed back into the controller which has a set of controlled variables, such as supersaturation or percentage of fines, etc. of the batch. The controller will then compute the required changes of manipulated variables, such as temperature or anti‐solvent amount, etc. to satisfy the criteria of controlled variables.
For model‐free approach, there is no modeling needs for the nucleation and crystal growth kinetics. Only the equilibrium solubility curve as a function of temperature and/or solvent composition is needed. Figure 4.32 shows one case of cooling crystallization with supersaturation control. As shown, utilizing this approach, controlling the supersaturation at different levels during cooling can effectively affect the degree of agglomeration.
Feasibility of feedback control will depend directly on the quality of the data collected during crystallization. In the laboratory, it is more straightforward for exploration and demonstration of feedback control on a case‐by‐case situation. In actual commercial implementation, this will be a non‐trivial task because real‐time control will impact the real‐time product quality. Additional measures to ensure the robustness of real‐time measurement for feedback control, for example regular maintenance for prevention of probe fouling or redundant measurement would be highly desirable. Due to these constraints, during commercial manufacturing, off‐line samplings appear to be a more doable option for monitoring the progress of crystallization.
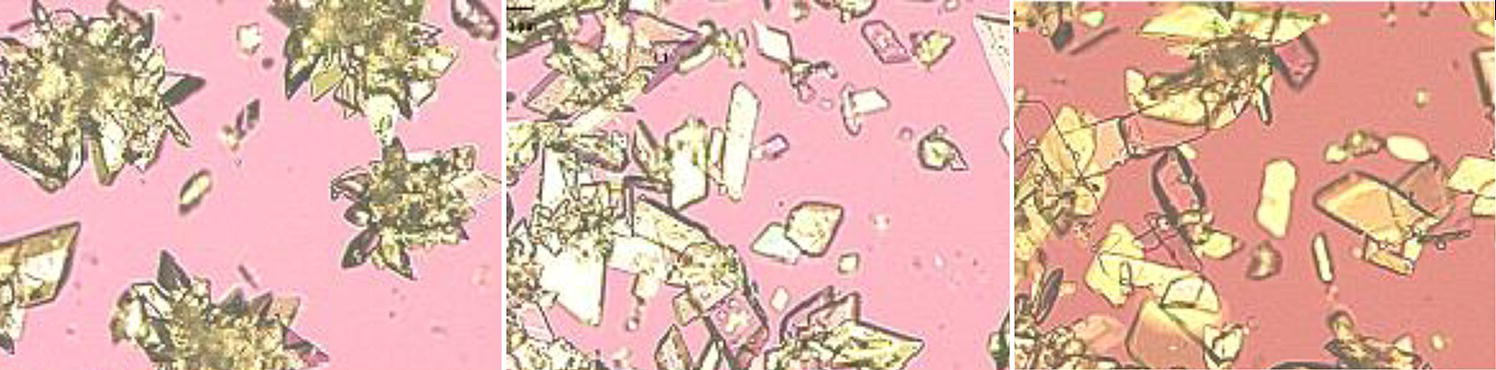
Figure 4.32 Microscopic photos of crystals under different supersaturation—29 mg/ml (left), 15 mg/ml (middle), and 9 mg/ml (right).
A more comprehensive discussion on the monitoring and control of pharmaceutical crystallization can be found in Nagy et al. (2007) and Myerson et al. (2019).