
Chapter 20
Management, Monitoring, and Optimization
The Following CompTIA Network+ Exam Objectives Are Covered in This Chapter:
- 4.4 Given a scenario, use the appropriate network monitoring resource to analyze traffic.
- SNMP
- SNMPv2
- SNMPv3
- Syslog
- System logs
- History logs
- General logs
- Traffic analysis
- Network sniffer
- 4.5 Describe the purpose of configuration management documentation.
- Wire schemes
- Network maps
- Documentation
- Cable management
- Asset management
- Baselines
- Change management
- 4.6 Explain different methods and rationales for network performance optimization.
- Methods:
- QoS
- Traffic shaping
- Load balancing
- High availability
- Caching engines
- Fault tolerance
- CARP
- Reasons:
- Latency sensitivity
- High bandwidth applications (VoIP, video applications, unified communications)
- Uptime
- 1.9 Identify virtual network components.
- Virtual switches
- Virtual desktops
- Virtual servers
- Virtual PBX
- Onsite vs. offsite
- Network as a Service (NaaS)
If you didn’t just skip to the end of this book, you’ve trekked through enough material to know that without a doubt, the task of designing, implementing, and maintaining a state-of-the-art network doesn’t happen magically. Ending up with a great network requires some really solid planning before you buy even one device for it. And planning includes thoroughly analyzing your design for potential flaws and optimizing configurations everywhere you can to maximize the network’s future throughput and performance. If you blow it in this phase, trust me—you’ll pay dearly later in bottom-line costs and countless hours consumed troubleshooting and putting out the fires of faulty design.
Start planning by creating an outline that precisely delimits all goals and business requirements for the network, and refer back to it often to ensure that you don’t deliver a network that falls short of your client’s present needs or fails to offer the scalability to grow with those needs. Drawing out your design and jotting down all the relevant information really helps in spotting weaknesses and faults. If you have a team, make sure everyone on it gets to examine the design and evaluate it, and keep that network plan up throughout the installation phase. Hang on to it after implementation has been completed as well because having it is like having the keys to the kingdom—it will enable you to efficiently troubleshoot any issues that could arise after everything is in place and up and running.
High-quality documentation should include a baseline for network performance because you and your client need to know what “normal” looks like in order to detect problems before they develop into disasters. Don’t forget to verify that the network conforms to all internal and external regulations and that you’ve developed and itemized solid management procedures and security policies for future network administrators to refer to and follow.
I’ll begin this chapter by going over the fundamentals of things like plans, diagrams, baselines, rules, and regulations and then move on to cover critical hardware and software utilities you should have in your problem resolution arsenal, like packet sniffers, throughput testers, connectivity packages, and even different types of event logs on your servers. And because even the best designs usually need a little boost after they’ve been up and running for a while, I’ll wrap things up by telling you about some cool ways you can tweak things to really jack up a network’s performance, optimize its data throughput, and, well, keep it all humming along as efficiently and smoothly as possible.
To find up-to-the-minute updates for this chapter, please see www.lammle.com/forum or the book’s web site at www.sybex.com/go/netplus2e.
Managing Network Documentation
I’ll admit it—creating network documentation is one of my least favorite tasks in network administration. It just isn’t as exciting to me as learning about the coolest new technology or tackling and solving a challenging problem. Part of it may be that I figure I know my networks well enough—after all, I installed and configured them, so if something comes up, it should be easy to figure it out and fix it, right? And most of the time I can do that, but as networks get bigger and more complex, it gets harder and harder to remember it all. Plus, it’s integral part of the service I provide for my clients to have seriously solid documentation in hand to refer to after I’ve left the scene and turned their network over to them. So while I’ll admit that creating documentation isn’t something I get excited about, I know from experience that having it around is critical when problems come up—for myself and for my clients’ technicians and administrators, who may not have been part of the installation process and simply aren’t familiar with the system.
Using SNMP
In Chapter 6, “Introduction to the Internet Protocol,” I introduced you to Simple Network Management Protocol (SNMP), which is used to gather information from and send settings to devices that are SNMP compatible. (Don’t forget to review the differences between version 1, 2, and 3 that we discussed there!) Remember, I told you it gathers data by polling the devices on the network from a management station at fixed or random intervals, requiring them to disclose certain information. Consequently, SNMP can help simplify the process of gathering information of your entire internetwork.
SNMP uses UDP to transfer messages back and forth between the management system and the agents running on the managed devices. Inside the UDP packets (called datagrams) are commands from the management system to the agent. These commands can be used to either get information from the device about its state (SNMP GetRequest) or to make a change in the device’s configuration (SetRequest). If a GetRequest command has been sent, the device will respond with an SNMP response. If there is an item of information of particular interest to an administrator about the device, the administrator can set what is called a trap on the device.
So, no whining! Begrudgingly or not, we’re going to create some sweet documentation. Because you probably don’t want to redo it, it’s a really good idea to keep it safe in at least three forms:
- An electronic copy that you can easily modify after configuration changes
- A hard copy in a binder of some sort, stored in an easily accessible location
- A copy on an external drive to keep in a really safe place (even off site) in case something happens to the other two or the building or part of it burns to the ground
Why the hard copy, you ask? Well, what if the computer storing the electronic copy crashes and burns just when a major crisis develops? Good thing you have the paper on hand! Plus, sometimes you’ll be troubleshooting on the run—maybe literally, as in running down the hall to the disaster’s origin. Having that binder containing key configuration information on board could save you a lot of time and trouble; plus, it’s also handy for making notes to yourself as you troubleshoot. And depending on the size of the intranet and the amount of people staffing the IT department, you may even need to have several hard copies. Just always make sure they’re checked out only by staff who are cleared to have them, and that they’re all returned to a secure location at the end of each shift. You definitely don’t want that information in the wrong hands.
Now that I have (I hope) got you totally convinced that you need to have documentation, let’s take a look into the different documentation types so you can learn how to assemble it. Network documentation basically falls into three categories:
- Schematics and diagrams
- Baselines
- Policies, procedures, and regulations
Schematics and Diagrams
No, reading network documentation can’t exactly compete with racing your friends on jet skis, but it’s really not that bad. It’s better than eating canned spinach, and sometimes it’s actually interesting to check out schematics and diagrams—especially when they describe innovative, elegant designs or when you’re hunting down clues needed to solve an intricate problem with an elusive solution. I can’t tell you how many times, if something isn’t working between point A and point B, a solid diagram of the network that precisely describes exactly what exists between point A and point B has totally saved the day. Other times these tools come in handy is when you need to extend your network and you want a clear picture of how the expanded version will look and work. Will the new addition cause one part of the network to become bogged down while another remains underutilized? You get the idea.
Diagrams can be simple sketches created while brainstorming or troubleshooting on the fly, or they can be highly detailed, refined illustrations created with some of the flashy software packages available today, like Microsoft Visio, SmartDraw, and a host of computer-aided design (CAD) programs. Some of the more complex varieties, especially CAD programs, are super pricey. But whatever tool you use to draw pictures about your networks, they basically fall into these three groups:
- Wiring diagrams/schematics
- Physical network diagrams
- Logical network diagrams
Wiring Schematics
Wireless is definitely the wave of the future, but for now even the most extensive wireless networks have a wired backbone they rely on to connect them to the rest of humanity.
That skeleton is made up of cabled physical media like coax, fiber, and twisted pair. Surprisingly, it is the latter—specifically, unshielded twisted pair (UTP)—that screams to be pictured in a diagram. You’ll see why in a minute. To help you follow me, let’s review what we learned in Chapter 3, “Networking Topologies, Connectors, and Wiring Standards.” Let’s start by checking out Figure 20-1 (a diagram!) that pictures the fact that UTP cables use an RJ-45 connector (RJ stands for registered jack).
Figure 20-1: RJ-45 connector

What we see here is that pin 1 is on the left and pin 8 is on the right, so clearly, within your UTP cable, you need to make sure the right wires get to the right pins. No worries if you got your cables premade from the store, but if you make them yourself because it saves money and allows you to customize cable lengths (wise), this is really important. Table 20-1 matches the colors for the wire associated with each pin, based on the Electronic Industries Association and the Telecommunications Industry Alliance (EIA/TIA) 568B wiring standard.
Table 20-1: Standard EIA/TIA 568B wiring
| Pin | Color |
| 1 | White/Orange |
| 2 | Orange |
| 3 | White/Green |
| 4 | Blue |
| 5 | White/Blue |
| 6 | Green |
| 7 | White/Brown |
| 8 | Brown |
Standard drop cables or patch cables have the pins in the same order on both connectors. If you’re connecting a computer to another computer directly, you should already know that you need a crossover cable that has one connector with flipped wires—specifically, pins 1 and 3 and pins 2 and 6 get switched to ensure that the send port from one computer’s Network Interface Card (NIC) gets attached to the receive port on the other computer’s NIC. Crossover cables were also used to connect older routers, switches, and hubs through their uplink ports. Figure 20-2 shows you what this would look like.
Figure 20-2: Two ends of a crossover cable

The crossover cable shown in Figure 20-2 is for connections up to 100BaseTX. If you are using 1000BaseT4, all four pairs of wires get crossed at the opposite end, meaning pins 4 and 7 and pins 5 and 8 get crossed as well. The Automatic MDI/MDI+ Configuration standard (an optional feature of the 1000BaseT standard) makes the need for crossover cables between gigabit-capable interfaces a thing of the past.
This is where having a diagram is as good as gold. Let’s say you’re troubleshooting a network and discover connectivity problems between two hosts. Because you’ve got the map, you know the cable running between them just happens to be a brand-new custom-made one, so you go there immediately knowing that cable probably wasn’t made well and is causing the snag.
Another reason it’s so important to diagram all things wiring is that all wires have to plug in somewhere, and it’s really good to know where that is. Whether it’s into a hub, a switch, a router, a workstation, or the wall, you positively need to know the who, what, where, when, and how of the way the wiring is attached.
After adding a new cable segment on your network, you need to update the wiring schematics.
For medium to large networks, devices like hubs, switches, and routers are rack-mounted and would look something like the switches in Figure 20-3.
Figure 20-3: Rack-mounted switches

Knowing someone or something’s name is important because it helps us differentiate between people and things—especially when communicating with each other. If you want to be specific, you can’t just say, “You know that router in the rack?” This is why coming up with a good naming system for all the devices living in your racks will be invaluable for ensuring that your, err, wires don’t get crossed (sorry!). Figure 20-3 displays switches with labels taped on them to designate them Sales and Marketing (names not displayed in the picture), which indicates they’re located in Sales and Marketing, respectively. Last, you can see on some of the cables that they are marked X/O for crossover.
Okay, I know it probably seems like we’re edging over into obsessive-compulsive disorder territory, but stay with me here; in addition to labeling, well, everything so far, you should really label both ends of your cables too. If something happens (earthquake, tsunami, temper tantrum, even repairs) and more than one cable gets unplugged at the same time, it can get messy scrambling to reconnect them from memory—fast.
Physical Network Diagrams
A physical network diagram contains all the physical devices and connectivity paths on your network and should accurately picture how your network physically fits together in detail. Again, I know it seems like overkill, but ideally, your network diagram should list and map everything you would need to rebuild your network from scratch if you had to. This is actually what this type of diagram is designed for. However, another example of a physical network diagram is one that includes the firmware revision on all the switches and access points in your network. Besides having your physical network detailed, you need to understand the connections, types of hardware, and their firmware revisions. This document is very helpful in troubleshooting.
Avoiding Confusion
Naming your network devices is no big deal, but for some reason, coming up with systems for naming devices and numbering connections can really stress people out.
Let me ease the pain. Let’s say your network has two racks of switches, creatively named Block A and Block B. (Sounds like a prison, I know, but it’s just to keep things simple for this example. In the real world, you can come up with whatever naming system works for you.)
Anyway, I’m going to use the letters FETH for Fast Ethernet; and because each rack has six switches, I’m going to number them (surprise!) 1 through 6. Because we read from left to right, it’s intuitive to number the ports on each switch that way too.
Having a solid naming system makes thing so much more efficient—even if it’s a bit of a hassle to create. For instance, if you were the system administrator in this example and suddenly all computers connected to FETHB-3 couldn’t access any network resources, you would have a pretty good idea of where to look first, right?
If you can’t diagram everything, at least make sure all network devices are listed. As I said, physical network diagrams can run from simple, hand-drawn models to insanely complex monsters created by software packages like SmartDraw, Visio, and AutoCAD. Figure 20-4 shows a simple diagram that most of us could draw by hand.
Figure 20-4: Simple network physical diagram

For the artistically impaired, or if you just want a flashier version, Figure 20-5 exhibits a more complex physical diagram. This is an actual sample of what SmartDraw can do for you, and you can get it at www.smartdraw.com. In addition, Microsoft Visio provides many or possibly more of these same functions.
My last example, also courtesy of SmartDraw, includes diagrams of hardware racks, as revealed in Figure 20-6.
Don’t throw anything at me, but I need to bring up one last thing: Never forget to mirror any changes you make to your actual network in the network’s diagram. Think of it like an updated snapshot. If you give the authorities your college buddy’s baby picture after he goes missing, will that really help people recognize him? Not without the help of some high-tech, age-progression software, that’s for sure—and they don’t make that for networks, so it’s better to just keep things up-to-date.
Figure 20-5: Network diagram with firewalls from SmartDraw
Reproduced with permission from SmartDraw.com (www.smartdraw.com).

Figure 20-6: Hardware-rack diagram from SmartDraw
Reproduced with permission from SmartDraw.com (www.smartdraw.com).

Logical Network Diagrams
Physical diagrams depict how data physically flows from one area of your network to the next, but a logical network diagram includes things like protocols, configurations, addressing schemes, access lists, firewalls, types of applications, and so on—all things that apply logically to your network. Figure 20-7 shows what a logical network diagram could look like.
And just as you mirror any physical changes you make to the network (like adding devices or even just a cable) on your physical diagram, you map logical changes (like creating a new subnet, VLAN, or security zone) on your logical network diagram. It is important that you keep this oh-so-important document up-to-date.
Baselines
In networking, baseline can refer to the standard level of performance of a certain device or to the normal operating capacity for your whole network. For instance, a specific server’s baseline describes norms for factors like how busy its processors are, how much of the memory it uses, and how much data usually goes through the NIC at a given time.
Figure 20-7: Logical network diagram
Reproduced with permission from SmartDraw.com (www.smartdraw.com).

A network baseline delimits the amount of bandwidth available and when. For networks and networked devices, baselines include information about four key components:
- Processor
- Memory
- Hard-disk (or other storage) subsystem
- Network adapter or subsystem
After everything is up and running, it’s a good idea to establish performance baselines on all vital devices and your network in general. To do this, measure things like network usage at three different strategic times to get an accurate assessment. For instance, peak usage usually happens around 8:00 a.m. Monday through Friday, or whenever most people log in to the network in the morning. After hours or on weekends is often when usage is the lowest. Knowing these values can help you troubleshoot bottlenecks or determine why certain system resources are more limited than they should be. Knowing what your baseline is can even tell you if someone’s complaints about the network running like a slug are really valid—nice!
It’s good to know that you can use network-monitoring software to establish baselines. Even some server operating systems come with software to help with network monitoring, which can help find baselines as well.
In my experience, it’s wise to re-baseline network performance at least once a year. And always pinpoint new performance baselines after any major upgrade to your network’s infrastructure.
Policies, Procedures, and Regulations
It’s up to us, individually and corporately, to nail down exactly what solid guidelines there should be for policies and procedures for network installation and operation. Some organizations are bound by regulations that also affect how they conduct their business, and that kind of thing clearly needs to be involved in their choices. But let me take a minute to make sure you understand the difference between policies and procedures.
Policies govern how the network is configured and operated as well as how people are expected to behave on it. They’re in place to direct things like how users access resources and which employees and groups get various types of network access and/or privileges. Basically, policies give people guidelines as to what they are expected to do. Procedures are precise descriptions of the appropriate steps to follow in a given situation, such as what to do when an employee is terminated or what to do in the event of a natural disaster. They often dictate precisely how to execute policies.
Of note, one of the most important aspects of any policy or procedure is that it’s given high-level management support, because neither will be very effective if there aren’t any consequences for not following the rules.
Policies
I talked extensively about security policies in Chapter 14, “Network Threats and Mitigation,” so if you’re drawing a blank, you can go back there for details. Here’s a summary list of factors that most policies cover:
Security policies These are policies applied to users to help maintain security in the network:
- Clean-desk policies
- Network access (who, what, and how)
- Acceptable-use policy
Change management These policies ensure a consistent approach to managing changes to network configurations:
- Disposal of network equipment
- Use of recording equipment
- How passwords are managed (length and complexity required, and how often they need to be changed)
- Types of security hardware in place
- How often to do backups and take other fault-tolerant measures
- What to do with user accounts after an employee leaves the company
Procedures
These are the actions to be taken in specific situations:
- Disciplinary action to be taken if a policy is broken
- What to do during an audit
- How issues are reported to management
- What to do when someone has locked themselves out of their account
- How to properly install or remove software on servers
- What to do if files on the servers suddenly appear to be “missing” or altered
- How to respond when a network computer has a virus
- Actions to take if it appears that a hacker has broken into the network
- Actions to take if there is a physical emergency like a fire or flood
So you get the idea, right? For every policy on your network, there should be a credible related procedure that clearly dictates the steps to take in order to fulfill it. And you know that policies and procedures are as unique as the wide array of companies and organizations that create and employ them. But all this doesn’t mean you can’t borrow good ideas and plans from others and tweak them a bit to meet your requirements.

An example of a network access policy is a time of day restriction on logging into the network.
Regulations
In contrast, regulations are rules imposed on your organization by an outside agency, like a certifying board or a government entity, and they’re usually totally rigid and nonmutable. The list of possible regulations that your company could be subjected to is so exhaustively long there’s no way I can include it in this book. Different regulations exist for different types of organizations depending on if they’re corporate, nonprofit, scientific, educational, legal, governmental, and so on, and they also vary by where that organization is located.
For instance, US governmental regulations vary by county and state, federal regulations are piled on top of those, and many other countries have multiple regulatory bodies as well. The Sarbanes-Oxley Act of 2002 (Sar-Ox) is an example of a regulation system imposed on all publicly traded companies in the United States. Its main goal was to ensure corporate responsibility and sound accounting practices, and although that may not sound like it would have much of an effect on your IT department, it does, because a lot of the provisions in this act target the retention and protection of data. Believe me, something as innocent sounding as deleting old emails could get you in trouble—if any of them could’ve remotely had a material impact on the company’s financial disclosures, deleting them could actually be breaking the law. All good to know—be aware, and be careful.
I’m not going to give you a laundry list of regulations for you to memorize here, but I will tell you that IT regulations center around something known as the CIA triad:
- Confidentiality: Only authorized users have access to the data.
- Integrity: The data is accurate and complete.
- Availability: Authorized users have access to the data when access is needed.
One of the most commonly applied regulations is the ISO/IEC 27002 standard for information security, previously known as ISO 17799 and renamed in 2007. It was developed by the International Organization for Standardization (ISO) and the International Electrotechnical Commission (IEC), and it is based on British Standard (BS) 7799-1:1999.
The official title of ISO/IEC 27002 is Information technology - Security techniques - Code of practice for information security management. Although it’s beyond our scope to get into the details of this standard, know that it covers 12 main areas:
- Risk assessment
- Security policy
- Organization of information security
- Asset management
- Human-resources security
- Physical and environmental security
- Communications and operations management
- Access control
- Information systems acquisition, development, and maintenance
- Information security incident management
- Business-continuity management
- Compliance
So, what do you take with you from this? Your mission is clear. Know the regulations your company is expected to comply with, and make sure your IT policies and procedures are totally in line with any regulations so it’s easy for you to comply with them. No sense getting hauled off to jail because you didn’t archive an email, right?
Monitoring the Network and Optimizing Its Performance
We’ve talked about how important creating a good plan for your network design is to its ultimate success, but I still have to tell you that no matter how much time and energy you put into your plan, it’s not going to be perfect. To be real, you’ll still probably go through a challenge, or five. Not to discourage you—working thoroughly through the planning stage definitely pays off big-time; it’s just not possible to foresee everything. Plus, things can always get better, right? There will always be ways to improve and optimize your network’s performance.
And those two things are exactly what we’re going to focus on next. First, I’ll show you some cool ways to monitor your network and nail its problem areas through using a variety of logs on your servers. After that, we’ll get into the skinny on how to optimize your system’s performance.
Network Monitoring and Logging
There are a lot of ways to find out what’s really going on within your network. Most administrators opt to directly keep tabs on network performance by looking at important factors like data rates and available bandwidth, using the many tools on the market designed to help with that. Another good strategy for assessing a network’s health and well-being is via the more indirect route of monitoring the logs that your server operating systems keep. These can help you spot problems on your physical network as well as services or applications that aren’t running properly and could eventually bring the network or its resources down and make your users really unhappy.
Syslog
Syslog is a standard for logging program messages. It is somewhat like SNMP in that it provides devices that would otherwise be unable to communicate with a means to notify administrators of problems or performance. These messages are usually logged to a Syslog server. It is supported by a wide variety of devices (such as printers and routers) and can integrate log data from many different types of systems into a central repository.
Network Monitoring
Some key network-monitoring tools and diagnostic utilities around today are software additions that run on an existing server operating system like Windows Server 2008 or Unix. Others are stand-alone hardware devices that you plug into your network, but both are basically the packet sniffers we talked about back in Chapter 14. Although it’s true that hackers can and do use sniffers to capture network traffic and gather data for an attack, we make good use of them too. And strange but true, being a bit of a hacker yourself can make you a much better sys admin—knowing your enemies and their methods can help you find the same holes they would use for evil, and you can use that knowledge to plug security holes and even optimize your network’s performance.
Packet sniffers allow you to examine network traffic down to details of individual packets. You can put the packet’s header under the microscope: It contains vital information about the protocol being used to encapsulate it, plus the source and destination IP addresses. This is super-valuable information—if I’m seeing the speed of traffic on a specific segment grind to a crawl, one of first the things I’ll look for is only one IP address that’s spewing tons of data. If so, it could mean that I’ve got a failing network adapter because a common symptom of a dying NIC is to become extremely “chatty” by sending out broadcast packets and clogging things to the point that legitimate traffic can’t get through. It’s like getting a deluge of junk mail and being forced to read every last bit of it; a broadcast packet is technically addressed to everyone, meaning that all the other NICs on the segment have to stop and read their junk—not so good.
Good news—routers are, by default, configured to prevent broadcasts from going from one segment to another. Most switches sold today are also able to prevent broadcasts from spreading to multiple network segments, but not by default.
When you hear people refer to things like load testing, connectivity testing, and throughput testing, they’re really talking about network monitoring. You’ll also hear network monitors referred to as protocol analyzers. Microsoft has a graphical utility called Network Monitor that can be used to capture network traffic. The current version is 3.4, and it’s supported by Windows Vista, Windows 7, Server 2003, and Server 2008. You can download it from Microsoft’s website, but for it to work, your network adapter must be able to work in promiscuous mode (yes, you read that right!). Several third parties specialize in producing network monitors, such as, for example, Fluke Networks, which makes some cool tools like the OptiView Network Analyzer.
Server Logs
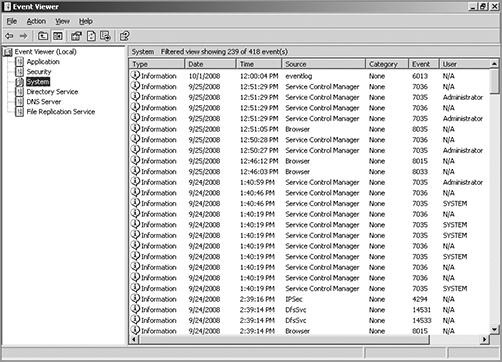
Windows Server 2003 and 2008 (and most other Windows operating systems) come with a tool called Event Viewer that provides you with several logs containing vital information about events happening on your computer. Other server operating systems have similar logs, and many connectivity devices like routers and switches also have graphical logs that gather statistics on what’s happening to them. These logs can go by various names, like history logs, general logs, or server logs. Figure 20-8 shows an Event Viewer system log display from a Windows Server 2003 machine.
On Windows servers, a minimum of three separate logs hold different types of information:
Application Contains events triggered by applications or programs determined by their programmers. Example applications include LiveUpdate, the Microsoft Office suite, and SQL and Exchange servers.
Security Contains security events like valid or invalid logon attempts and potential security problems. By default, it’s not enabled, so you’ve got to set it up manually.
System Contains events generated by Windows system components, including drivers and services that started or failed to start.
The basic “Big Three” can give us lots of juicy information about who’s logging on, who’s accessing the computer, and which services are running properly (or not). If you want to find out whether your Dynamic Host Configuration Protocol (DHCP) server started up its DHCP service properly, just check out its system log. Because the computer depicted in Figure 20-8 is configured as a domain controller, its Event Viewer serves up three more logs: Directory Service, DNS Server, and File Replication Service, for a total of six.
Figure 20-8: Windows Event Viewer system log
Windows 2000 Server and Windows Server 2003 came with System Monitor—another graphical tool used to create network baselines, provide performance logs, and identify bottlenecks. Windows Server 2008 R2 offers an optional new monitoring and optimization tool called System Center Operations Manager 2010.
Reasons to Optimize Your Network’s Performance
So why do we have networks, anyway? I don’t mean this in a historical sense; I mean pragmatically. The reason they’ve become such precious resources is that as our world has become smaller and more connected, we need a way to keep in touch like never before. Networks make accessing resources easy for people who can’t be in the same location as the resources they need—including other people.
In essence, networks of all types are really complex tools we use to facilitate communication from afar and to allow lots of us to access the resources we need to keep up with the demands imposed on us in today’s lightning paced world. And use them we do—a lot. And when you have many, many people trying to access one resource like a valuable file server or a shared database, our systems can get as bogged down and clogged as a freeway at rush hour. Just as road rage can result from driving on one of those not-so-expressways, frustrated people can direct some serious hostility at you if the same thing happens when they’re trying to get somewhere using a network that’s crawling along at snail speed.
This is why optimizing performance is in everyone’s best interest—it keeps you and you network’s users happily humming along. Optimization includes things like splitting up network segments, stopping unnecessary services on servers, offloading one server’s work onto another, and upgrading outmoded hardware devices to newer, faster models. I’ll get to exactly how to make that happen coming up soon, but in this next section, I’m going to talk about the theories behind performance optimization and even more about the reasons why you want to make sure performance is at its best.
In a perfect world, there would be unlimited bandwidth, but in reality, you’re more likely to find Bigfoot. So, it’s helpful to have some great strategies up your sleeve.
If you look at what computers are used for today, there’s a huge difference between the files we transfer now versus those transferred even three to five years ago. Now we do things like watch movies online without them stalling, and we can send humongous email attachments. Video teleconferencing is more common than Starbucks locations—well, almost. The point is that the files we transfer today are really huge compared to what we sent back and forth just a few years ago. And although bandwidth has increased to allow us to do what we do, there are still limitations that cause network performance to suffer miserably. Let’s start with a few reasons why you need to carefully manage whatever amount of precious bandwidth you’ve got.
Latency Sensitivity
Most of us have clicked to open an application or clicked a web link only to have the computer just sit there staring back at us, helplessly hanging. That sort of lag comes when the resources needed to open the program or take us to the next page are not fully available. That kind of lag on a network is called latency—the time between when data is requested and the moment it actually gets delivered. The more latency, the longer the delay and the longer you have to stare blankly back at your computer screen, hoping something happens soon.
Latency affects some programs more than others. If you are sending an email, it may be annoying to have to wait a few seconds for the email server to respond, but that type of delay isn’t likely to cause physical harm to you or a loved one. Applications that are adversely affected by latency are said to have high latency sensitivity. A common example of this is online gaming. Although it may not mean actual life or death, playing certain online games with significant delays can mean the untimely demise of your character—and you won’t even know it. Worse, it can affect the entire experience for those playing with you, which can get you booted from some game servers. On a much more serious level, applications like remote surgery also have high latency sensitivity.
High-Bandwidth Applications
Many of the applications we now use over the network would have been totally unserviceable in the past because of the high amount of bandwidth they consume. And even though technology is constantly improving to give us more bandwidth, developers are in hot pursuit, developing new applications that gobble up that bandwidth as soon as it becomes—even in advance of it becoming—available. A couple of good examples of high-bandwidth applications are VoIP and video streaming:
VoIP Voice over Internet Protocol (VoIP) describes several technologies that work to deliver voice communications over the Internet or other data networks. In many cases, VoIP includes not only voice but video transmissions as well. VoIP allows us to send voice, video, and data all over the same connection to another location. Its most common application is video teleconferencing.
Many companies are investing in VoIP systems to reduce travel costs. Ponying up for pricey plane tickets, lodging, and rental cars adds up fast, so investing in a good VoIP system that allows the company to have virtual conferences with people in another state or country pays for itself in no time.
But sadly, VoIP installations can be stressed heavily by things like really low bandwidth, latency issues, packet loss, jitter, security flaws, and reliability concerns. And in some cases, routing VoIP through firewalls and routers using address translation can prove pretty problematic as well.
Video applications Watching real-time video on the Internet today is great if you have a decent high-speed connection. You can watch the news, sports, movies, and pretty much anything else that you watch on television. Although viewing digital media online is so common that anyone born after the year 2000 won’t be able to remember a time when you needed to watch videos on anything other than a computer, again, this requires lots of bandwidth, and excessive use can cause traffic problems even on robust networks.
Uptime
Uptime is the amount of time the system is up and accessible to your end users, so the more uptime you have, the better. And depending on how critical the nature of your business is, you may need to provide four-nine or five-nine uptime on your network—that’s a lot. Why is this a lot? Because you write out four-nine as 99.99%, or better, you write out five-nine as 99.999%! Now that is some serious uptime!
How to Optimize Performance
You now know that bandwidth is to networking as water is to life, and you’re one of the lucky few if your network actually has an excess of it. Cursed is the downtrodden administrator who can’t seem to find enough, and more fall into this category than the former. At times, your very sanity may hinge upon ensuring that your users have enough available bandwidth to get their jobs done on your network, and even if you’ve got a 1Gbps connection, it doesn’t mean all your users have that much bandwidth at their fingertips. What it really means is that they get a piece of it, and they share the rest with other users and network processes. Because it’s your job to make sure as much of that 1Gbps as possible is there to use when needed, I’m going to discuss some really cool ways to make that happen for you.
Quality of Service
Quality of service (QoS) refers to the way the resources are controlled so that the quality of services is maintained. It’s basically the ability to provide a different priority to one or more types of traffic over other levels for different applications, data flows, or users so that they can be guaranteed a certain performance level.
QoS methods focus on one of five problems that can affect data as it traverses network cable:
Delay Data can run into congested lines or take a less-than-ideal route to the destination, and delays like these can make some applications, such as VoIP, fail. This is the best reason to implement QoS when real-tine applications are in use in the network—to prioritize delay-sensitive traffic.
Dropped packets Some routers will drop packets if they receive a packet while their buffers are full. If the receiving application is waiting for the packets but doesn’t get them, it will usually request that the packets be retransmitted—another common cause of a service(s) delay.
Error Packets can be corrupted in transit and arrive at the destination in an unacceptable format, again requiring retransmission and resulting in delays.
Jitter Not every packet takes the same route to the destination, so some will be more delayed than others if they travel through a slower or busier network connection. The variation in packet delay is called jitter, and this can have a nastily negative impact on programs that communicate in real time.
Out-of-Order delivery Out-of-order delivery is also a result of packets taking different paths through the network to their destinations. The application at the receiving end needs to put them back together in the right order for the message to be completed, so if there are significant delays or the packets are reassembled out of order, users will probably notice degradation of an application’s quality.
QoS can ensure that applications with a required bit rate receive the necessary bandwidth to work properly. Clearly, on networks with excess bandwidth, this is not a factor, but the more limited your bandwidth is, the more important a concept like this becomes.
Applications that generally require some level of QoS include online gaming, VoIP, streaming multimedia, and safety-critical applications like remote surgery. There are eight levels of QoS priorities. The lowest level, 0, is called “best effort” but doesn’t really mean that—it actually means something more like “your data will get there when it gets there.” The highest level, 5, is used for things like remote surgery when data needs to get there in real time or else! (Levels 6 and 7 are reserved for network control traffic.) Table 20-2 displays the eight QoS levels.
Table 20-2: Eight levels of QoS
| Level | Description |
| 0 | Best effort |
| 1 | Background |
| 2 | Standard (spare) |
| 3 | Excellent load (business-critical applications) |
| 4 | Controlled load (streaming media) |
| 5 | Voice and video (interactive voice and video, less than 100ms latency and jitter) |
| 6 | Layer 3 Network Control Reserved Traffic (less than 10ms latency and jitter) |
| 7 | Layer 2 Network Control Reserved Traffic (lowest latency and jitter) |
QoS levels are established per call, per session, or in advance of the session by an agreement known as a service level agreement (SLA).
Traffic Shaping
Traffic shaping, or packet shaping, is another form of bandwidth optimization. It works by delaying packets that meet a certain criteria to guarantee usable bandwidth for other applications. Traffic shaping is basically traffic triage—you’re really just delaying attention to some traffic so other traffic gets A-listed through. Traffic shaping uses bandwidth throttling to ensure that certain data streams don’t send too much data in a specified period of time as well as rate limiting to control the rate at which traffic is sent.
Most often, traffic shaping is applied to devices at the edge of the network to control the traffic entering the network, but it can also be deployed on devices within an internal network. The devices that control it have what’s called a traffic contract that determines which packets are allowed on the network and when. You can think of this kind of like the stoplights on busy freeway on-ramps, where only so much traffic is allowed onto the road at one time, based on predefined rules. Even so, some traffic (like carpools and emergency vehicles) is allowed on the road immediately. Delayed packets are stored in the managing device’s first-in, first-out (FIFO) buffer until they’re allowed to proceed per the conditions in the contract. If you’re the first car at the light, this could happen immediately. If not, you get to go after waiting briefly until the traffic in front of you is released.
Load Balancing
Load balancing refers to a technique used to spread work out to multiple computers, network links, or other devices.
Using load balancing, you can provide an active/passive server cluster in which only one server is active and handling requests. For example, your favorite Internet site might actually consist of 1 of 20 servers that all appear to be the same exact site because that site’s owner wants to ensure that its users always experience quick access. You can accomplish this on a network by installing multiple, redundant links to ensure that network traffic is spread across several paths and to maximize the bandwidth on each link.
Think of this as like having two or more different freeways that will both get you to your destination equally well—if one is really busy, just take the other one.
High Availability
High availability is a system-design protocol that guarantees a certain amount of operational uptime during a given period of time. The design attempts to minimize unplanned downtime—the time users are unable to access resources. In almost all cases high availability is provided through the implementation of duplicate equipment (multiple servers, multiple NIC etc.). Organizations that serve critical functions obviously need this; after all, you really don’t want to blaze your way to a hospital ER only to find that they can’t treat you because their network is down!
There’s a difference between planned downtime and unplanned downtime. Planned downtime is good—it’s occasionally scheduled for system maintenance and routine upgrades. Unplanned downtime is bad: It’s a lack of access due to system failure, which is exactly the issue high-availability resolves.
One of the highest standards in uptime is the ability to provide five-nine availability, which I spoke of earlier. This actually means the network is accessible 99.999% of the time—way impressive! Think about this. In one non-leap year, there are 31,536,000 seconds. If you are available 99.999% of the time, it means you can be down only .001% of the time, or a total of 315.36 seconds, or 5 minutes and 15.36 seconds per year—wow!
There’s a difference between uptime and availability. Your servers may be up but not accessible if a cable gets cut or something, and that outage would definitely count against your availability time.
Caching Engines
A cache is a collection of data that duplicates key pieces of original data. Computers use caches all the time to temporarily store information for faster access, and processors have both internal and external caches available to them, which speeds up their response times.
A caching engine is basically a database on a server that stores information people need to access fast. The most popular implementation of this is with web servers and proxy servers, but caching engines are also used on internal networks to speed up access to things like database services.
Fault Tolerance
Fault tolerance means that even if one component fails, you won’t lose access to the resource it provides. To implement fault tolerance, you need to employ multiple devices or connections that all provide a way to access the same resource(s).
A familiar form of fault tolerance is configuring an additional hard drive to be a mirror image of another so that if either one fails, there’s still a copy of the data available to you. In networking, fault tolerance means that you have multiple paths from one point to another. What’s really cool is that fault-tolerant connections can be configured to be available either on a standby basis only or all the time if you intend to use them used as part of a load-balancing system.
Common Address Redundancy Protocol
Common Address Redundancy Protocol (CARP) provides IP-based redundancy, allowing a group of hosts on the same network segment (referred to as a redundancy group) to share an IP address. One host is designated the master and the rest as backups. The master host responds to any traffic or ARP requests directed toward it. Each host may belong to more than one redundancy group at a time.
One of its most common uses is to provide redundancy for devices such as firewalls or routers. The virtual IP address (this is another name for the shared group IP address) will be shared by a group of routers or firewalls.
The client machines use the virtual IP address as their default gateway. In the event that the master router suffers a failure or is taken offline, the IP will move to one of the backup routers and service will continue. Other protocols that use similar principles are Virtual Router Redundancy Protocol and the Hot Standby Router Protocol.
Virtual Networking
Over the last few years, one of the most significant developments helping to increase the efficient use of computing resources—leading to an increase in network performance without an increase in spending on hardware—has been the widespread adoption of virtualization technology. You can’t read an industry publication without coming across the term cloud computing within 45 seconds!
The concept of virtualization is quite simple. Instead of dedicating a physical piece of hardware to every server, run multiple instances of the server operating system, each in its own “virtual environment” on the same physical piece of equipment. This saves power, maximizes the use of memory and CPU resources, and can even help to “hide” the physical location of each virtual server.
Virtual computing solutions come from a number of vendors. The following are some of the more popular currently:
- VMware vSphere
- Microsoft Hyper-V
- Citrix XenServer
All of these solutions work on the same basic concept but each has its own unique features, and of course all claim to be the best solution. In the following sections, I will discuss the building blocks of virtualization rather than the specific implementation from any single vendor.
Onsite vs. Offsite
Often you hear the terms public cloud and private cloud. Clouds can be thought of as virtual computing environments where virtual servers and desktops live and can be accessed by users. A private cloud is one in which this environment is provided to the enterprise by a third party for a fee. This is a good solution for a company that has neither the expertise nor the resources to manage their own cloud yet would like to take advantage of the benefits that cloud computing offers:
- Increased performance
- Increased fault tolerance
- Constant availability
- Access from anywhere
These types of clouds might be considered offsite or public. On the other hand, for the organization that has the expertise and resources, a private or onsite solution might be better and might be more secure. This approach will enjoy the same benefits as a public cloud and may offer more precise control and more options to the organization.
Virtual Networking Components
Virtualization can be deployed in several different ways to deliver cost-effective solutions to different problems. Each of the following components can have its place in the solution:
Virtual servers Virtual servers can perform all the same functions as physical servers but can enjoy some significant advantages. By clustering a virtual server with other virtual servers located on different hosts, you can achieve fault tolerance in the case of a host failure. Increased performance can also be derived from this approach.
The virtualization software can allow you to allocate CPU and memory resources to the virtual machines (VMs) dynamically as needed to ensure that the maximum amount of computing power is available to any single VM at any moment while not wasting any of that power on an idle VM. In fact, in situations where VMs have been clustered, they may even be suspended or powered down in times of low demand in the cluster.
Virtual switches Virtual switches are software versions of a Layer 2 switch that can be used to create virtual networks. They can be used for the same purposes as physical switches. VLANs can be created, virtual servers can be connected to the switches, and the virtual network can be managed all while residing on the same physical box. These switches can also span multiple hosts (the physical machines that house multiple virtual servers, desktops, and switches are called hosts).
Distributed virtual switches are hose switches that span multiple hosts, and they are what link the VMs that are located on different hosts yet members of the same cluster together.
Figure 20-9 shows the relationship between a physical server and the virtual servers and virtual switches that it hosts. The virtual servers called virtual machines (VMs) have virtual network cards (vNICs) that connect to the virtual switch. Keep in mind that all three of these components are software running on the same physical server. Then the virtual switch makes a software connection to the physical NIC on the physical host, which makes a physical connection to the physical switch in the network.
It is interesting to note and important to be aware that the IP address of the physical NIC in Figure 20-9 will actually be transmitting packets from multiple MAC addresses since each of the virtual servers will have a unique virtual MAC address.
Figure 20-9: Virtualization

Virtual desktops Using operating system images for desktop computers is not a new concept. Delivering these desktop images to users from a virtual environment when they start their computer is. This allows for the user desktop to require less computing power, especially if the applications are also delivered virtually and those applications are ruining in a VM in the cloud rather than in the local desktop eating up local resources. Another benefit of using virtual desktops is the ability to maintain a consistent user environment (same desktop, applications etc.) when can enhance user support.
Thin computing takes this a step further. In this case, all of the computing is taking place on the server. A thin client is simply displaying the output from the operating system running in the cloud and the keyboard is used to interact with that operating system in the cloud. Does this sound like dumb terminals with a GUI to anyone yet? Back to the future indeed! The thin client needs very little processing power for this job.
Virtual PBX Virtual PBX is an example of what is called software as a service (SaaS). A hosting company manages the entire phone system for the company, freeing the organization from the need to purchase and manage the physical equipment that would be required otherwise to provide the same level of service. To the outside world, the company appears to have a professional phone system while everything is actually being routed through the hosting company’s system.
Network as a Service (NaaS) Now that you know what SaaS is you can probably guess what NaaS is. You guessed it: a network hosted and managed by a third party on behalf of the company. For many enterprises, it makes more sense to outsource the management of the network to a third party when it is not cost effective to maintain a networking staff.
An example of this is the Cisco OpenStack cloud operating system, which is an open-source platform that provides computers and storage.
In this chapter, I talked a lot about the documentation aspects of network administration. I started off discussing physical diagrams and schematics and moved on to the logical form as well as configuration-management documentation. You learned about the importance of these diagrams as well as the simple to complex forms they can take and the tools used to create them—from pencil and paper to high-tech AutoCAD schematics. You also found out a great deal about creating performance baselines. After that, I delved deep into a discussion of network policies and procedures and how regulations can affect how you manage your network.
Next, you learned about network monitoring and optimization and how monitoring your network can help you find issues before they develop into major problems. You learned that server operating systems and intelligent network devices have built-in graphical monitoring tools to help you troubleshoot your network. Also covered was how to check logs on servers or network devices to find out what’s been happening on them, such as who has logged in or how much traffic has passed through them.
We got into performance optimization and the many theories and strategies you can apply to optimize performance on your network. All of them deal with controlling the traffic in some way and include methods like QoS, traffic shaping, load balancing, high availability, and the use of caching servers. We discussed how Common Address Redundancy Protocol (CARP) can be used to increase availability of gateways and firewalls. You also learned how important it is to ensure that you have plenty of bandwidth available for any applications that vitally need it, like critical service operations, VoIP, and real-time multimedia streaming.
Finally we discussed cloud computing, or virtualization. We looked at its benefits, including increased performance and fault tolerance, increased availability, and the ability to access cloud services from anywhere. You also learned about some of its major components, such as virtual servers, virtual switches, virtual desktops, and an example of software as a service (SaaS), virtual PBX.
Understand the difference between a physical network diagram and a logical network diagram. A physical diagram shows all of the physical connections and devices and in many cases the cables or connections between the devices. It’s a very detail-oriented view of the hardware on your network. A logical network diagram takes a higher-level view, such as your subnets and which protocols those subnets use to communicate with each other.
Understand the difference between policies, procedures, and regulations. A policy is created to give users guidance as to what is acceptable behavior on the network. Policies also help resolve problems before they begin by specifying who has access to what resources and how configurations should be managed. Procedures are steps to be taken when an event occurs on the network, such as what to do when a user is fired or how to respond to a natural disaster. Regulations are imposed on your organization; you are required to follow them, and if you don’t, you may be subject to punitive actions.
Know how your servers and network devices can help you monitor your network. Most servers and network devices have monitoring tools built in that are capable of tracking data and events on your network. These include graphical tools as well as log files.
Understand several theories of performance optimization. There are several ways to manage traffic on your network to speed up access and in some cases guarantee available bandwidth to applications. These include QoS, traffic shaping, load balancing, high availability, and using caching servers.
Know some examples of bandwidth-intensive applications. Two examples of high-bandwidth applications are Voice over IP (VoIP) and real-time video streaming.
Describe the major building blocks of virtualization. Understand how virtual servers, virtual switches, and virtual desktops are used to supply the infrastructure to deliver cloud services. Differentiate onsite or private clouds from offsite or public cloud services. Identify services that can be provided such as network as a service (NaaS) and software as a service (SaaS).
In this section, write the answers to the following management questions:
1. In which type of network diagram do you typically list the IP addresses of your servers and router ports?
2. Which network-performance optimization technique uses a contract to determine which data can get on to the network?
3. The lowest level of QoS is called ___________________.
4. The variation in packet delay on a network is called ___________________.
5. Spreading network traffic across multiple connections is called ___________________.
6. A standard of normal network performance is called ___________________.
7. If you need to connect two PCs directly together using their network adapters, what type of cable do you need?
8. What is another name for using virtualization to provide services?
9. List at least three major components of virtualization.
10. The steps you should take when, for example, a network user is fired, are called ___________________.
You can find the answers in Appendix B.
You can find the answers in Appendix A.
1. UTP cables use which type of connector?
A. RJ-11
B. RJ-25
C. RJ-45
D. BCN
2. Which type of cable will have the pins in the same order on both connectors?
A. Crossover cable
B. Straight-through cable
C. Console cable
D. Telephone cable
3. Which pins are switched in a crossover cable?
A. 1 and 2, 3 and 4
B. 1 and 3, 2 and 6
C. 2 and 4, 5 and 7
D. 1 and 4, 5 and 8
4. UTP cable has specific colors for the wire associated with each pin. Based on the TIA/EIA 568B wiring standard, what is the correct color order, starting with pin 1?
A. White/Orange, Orange, Blue, White/Green, White/Blue, Green, White/Brown, Brown
B. Orange, White/Orange, White/Green, Blue, White/Blue, White/Brown, Brown, Green
C. White/Orange, Orange, White/Green, Blue, White/Blue, Green, White/Brown, Brown
D. White/Green, Green, White/Orange, Blue, White/Blue, Orange, White/Brown, Brown
5. A baseline contains information about which resources on a network component? (Choose all that apply.)
A. Hard disk
B. Memory
C. Processor
D. Network adapter
6. Which of the following govern how the network is configured and operated as well as how people are expected to behave on the network?
A. Baselines
B. Laws
C. Policies
D. Procedures
7. You have upgraded the firmware on your switches and access points. What documentation do you need to update?
A. Baselines and configuration documentation
B. Physical network diagram
C. Logical network diagram
D. Wiring schematics
8. A user reports slowness on a network. The network administrator can begin to monitor the system by using what to look into the problem?
A. IPS
B. Load balancing
C. Packet sniffing
D. Regulations
9. Load testing, connectivity testing, and throughput testing are all examples of what?
A. Load balancing
B. Network monitoring
C. Packet sniffer
D. Traffic shaping
10. Which type of Windows server log will give information about specific programs?
A. Application
B. Security
C. System
D. None of the above
11. Which type of Windows server log will give you information about drivers and services?
A. Application
B. Security
C. System
D. None of the above
12. What can provide different priority levels to different applications, data flows, or users to help guarantee performance levels?
A. 1Gbps connection
B. Bandwidth
C. Uptime
D. Quality of service
13. Which of the following provides increased availability to firewalls and gateways?
A. DHCP
B. CARP
C. SaaS
D. NaaS
14. You have added a new cable segment to your network. You need to make sure you document this for troubleshooting purposes. What should you update?
A. The disaster recovery plan
B. The wiring schematics
C. The router connections document
D. The baseline document
15. What is the basic purpose of QoS? (Choose two.)
A. Block access to certain websites
B. Make your entire network run faster
C. Provide priority of one of more types of traffic over others
D. Block access to web resources for just certain users or groups
E. Prioritize delay-sensitive traffic
16. Which network-performance optimization technique can delay packets that meet certain criteria to guarantee usable bandwidth for other applications?
A. Traffic shaping
B. Jitter
C. Logical
D. Load balancing
17. Which of the following is neither a virtualization component nor a service made available through virtualization?
A. Virtual servers
B. SaaS
C. CARP
D. Virtual switches
18. Which of the following are reasons to optimize network performance? (Choose all that apply.)
A. Maximizing uptime
B. Minimizing latency
C. Using VoIP
D. Using video applications
E. B and D
F. All of the above
19. What term describes technologies that can deliver voice communications over the Internet?
A. Jitter
B. Uptime
C. Voice over Internet Protocol
D. None of the above
20. To optimize performance on your network, which of the following control traffic in some way?
A. QoS
B. Traffic shaping
C. Load balancing
D. Caching services
E. All of the above