
7
Tools for Monitoring and Assessing
Cloud monitoring is one of the keys to ensuring that cloud services and resources remain secure and cost-effective. AWS, Azure, and Google Cloud Platform (GCP) offer native solutions that an IT auditor can leverage to monitor and assess cloud environments. Cloud monitoring is a method of reviewing, observing, and managing the health and security of a cloud. Cloud monitoring is performed with the aim of detecting cyber threats, data breaches, and anomalous behavior. Using monitoring tools, organizations can proactively monitor their cloud environments to identify security events before they become security incidents.
We will cover the following topics in this chapter:
- Basic cloud auditing tools within AWS
- Basic cloud auditing tools within Azure
- Basic cloud auditing tools within GCP
In Chapter 6, Tips and Techniques for Advanced Auditing, we went over tools that an IT auditor can leverage to perform monitoring specifically for resources. This includes AWS Config for AWS, Microsoft Defender Cloud for Azure, and Google Cloud Asset Inventory for GCP. In this chapter, we’ll cover the standard tools for holistic monitoring of the performance, availability, and security of infrastructure and applications for AWS, Azure, and GCP environments. We will start by looking at the tools offered by AWS.
Basic cloud auditing tools within AWS
In the sections that follow, as a prerequisite, you may require a minimum level of view or read access to obtain the test evidence independently. Depending upon your specific organization’s configuration and any additional customizations, you may require additional access rights or group memberships to directly access specific content, or you may be required to work with an administrative point of contact for your organization as you observe them pulling control evidence. For reference, any screenshots in the following sections are based on a user with administrative privileges to the cloud environment. In addition, some of the tools may need to be enabled by the cloud customer, if they have not yet been.
We will begin with the basic cloud auditing tools within the AWS platform.
Amazon CloudWatch
The first tool an IT auditor can leverage in AWS is Amazon CloudWatch. Amazon CloudWatch is an AWS native monitoring and management service, which is designed for the purpose of maintaining the services and resources that are used. Amazon CloudWatch can be used to collect and track metrics, monitor log files, and set alarms, among many other functions. To navigate to Amazon Cloudwatch, you can simply search for it on the AWS console, as seen in Figure 7.1:

Figure 7.1 – Searching for Amazon CloudWatch
Once you launch Amazon CloudWatch, you have several options you can configure. These vary from creating alarms to custom dashboards, monitoring logs and creating events, and so on, as seen in Figure 7.2:

Figure 7.2 – Features
One useful feature for the IT auditor in Amazon CloudWatch is Events. In the Events tab, you can create a CloudWatch event that triggers an event. To create a rule, you need to navigate to Events, and click on the Rules tab, which will take you to EventBridge (formerly known as AWS CloudWatch Events), as seen in Figure 7.3:

Figure 7.3 – EventBridge main page
An event indicates a change in the AWS environment. An IT auditor can create an event that is triggered when a certain state changes. I will provide examples of two rules an IT auditor can create. For detailed instructions on creating a rule that triggers an event from an AWS resource, go to https://docs.aws.amazon.com/eventbridge/latest/userguide/eb-get-started.html.
To create a rule, you have to define the rule detail, as seen in Figure 7.4:

Figure 7.4 – Define rule detail
Next, we have to define the AWS event. We will also need to define an output to where events will be sent to. In our first example, we will select an event that triggers when an AWS Elastic Compute Cloud (EC2) instance state changes. Abnormal changes to EC2 instances may indicate malicious activity.

Figure 7.5 – Event source
In our second example, we will select an event that triggers when an AWS Simple Storage Service (S3) object Access Control List (ACL) is updated. We could use this rule to monitor objects whose access changes in S3 buckets. An IT auditor could use this rule to look for misconfigured S3 buckets allowing public access. This is one of the most common security misconfiguration risks within AWS.

Figure 7.6 – Object ACL Updated
Another useful feature in Amazon CloudWatch is Alarms. The Alarms feature allows you to watch Amazon CloudWatch metrics and to receive notifications when the metrics fall outside of the thresholds defined. To create an alarm, go to the Alarms tab, as seen in Figure 7.7:

Figure 7.7 – The Alarms tab
You can create alarms using thousands of predefined metrics, as seen in Figure 7.8:
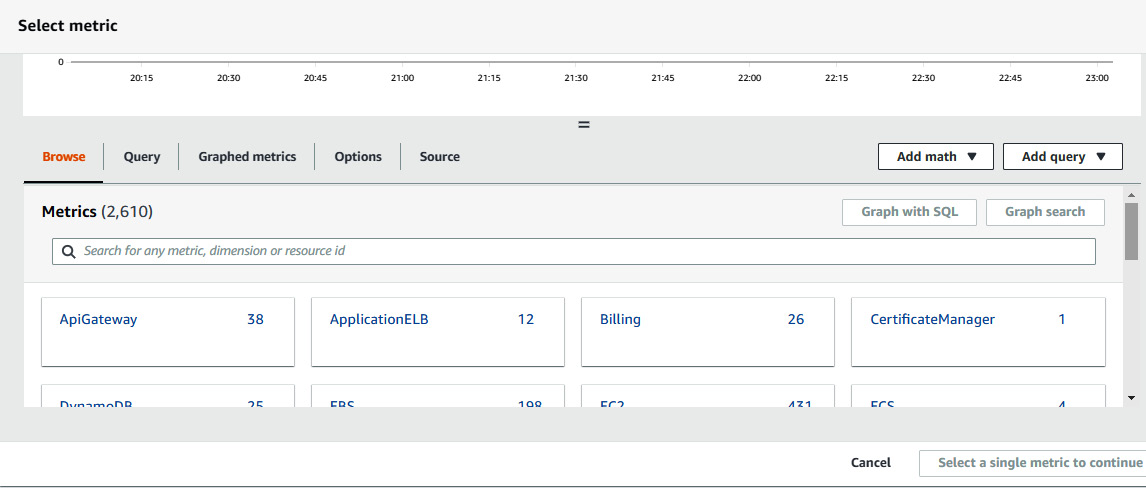
Figure 7.8 – Metrics
Once you create your alarms, you will get a dashboard like the one seen in Figure 7.9:

Figure 7.9 – Dashboards
In our example, we have received two alarms for metrics outside their thresholds, as seen in Figure 7.10:

Figure 7.10 – Example alarms
This can give you an idea of the flexibility of the Alarms functionality in Amazon CloudWatch.
Next, we will look at another AWS tool called Amazon Inspector.
Amazon Inspector
Another tool an IT auditor can leverage in AWS is Amazon Inspector. Amazon Inspector is an automated vulnerability management service that continually scans AWS resources for software vulnerabilities and inadvertent network exposure.
Amazon Inspector collects events from various vulnerability intelligence sources, including Common Vulnerabilities and Exposures (CVE), the National Vulnerability Database (NVD), and MITRE. To get to Amazon Inspector, you can search for it on a browser or the AWS console, as seen in Figure 7.11:

Figure 7.11 – Amazon Inspector
You need to enable Amazon Inspector to facilitate the discovery of data, as seen in Figure 7.12:
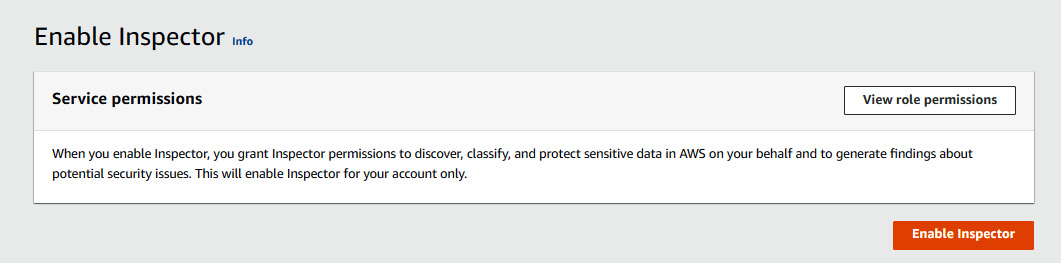
Figure 7.12 – Enabling Amazon Inspector
Navigate to the Dashboard tab on Amazon Inspector and you will find information such as Critical findings and Risk based remediations:

Figure 7.13 – The Amazon Inspector dashboard
One useful tab in Inspector is Findings. In our example, there are two findings noted: ports 22 and 3389 are reachable from an internet gateway. Ports 22 and 3389 are Secure Shell (SSH) and Remote Desktop (RDP), respectively. If you can recall from Chapter 4, Network, Infrastructure, and Security Controls, we noted that Azure CIS Benchmarks recommends that clouds should not allow unrestricted access to remote server administration ports, such as SSH to port 22 and RDP to port 3389. Exposing SSH and RDP to the internet can increase opportunities for malicious activities, such as brute-force attacks.

Figure 7.14 – The Amazon Inspector findings
In addition, Amazon Inspector has integration with Amazon EventBridge and AWS Security Hub. You can see this integration with AWS Security Hub in Figure 7.15:

Figure 7.15 – Integration with AWS Security Hub
Next, we will look at tools in the Azure cloud environment.
Azure
Now, we will review cloud auditing tools that can be leveraged in the Azure cloud platform.
Azure Monitor
One tool an IT auditor can leverage in the Azure environment is Azure Monitor. As per the Azure documentation, Azure Monitor “helps you maximize performance and availability of your applications and proactively identify problems in seconds.”
To launch Azure Monitor, you can easily search for it in a browser or on the Azure console, as seen in Figure 7.16:

Figure 7.16 – Azure Monitor
Overview presents the different options that an IT auditor can utilize from Application Insights, Container Insights, VM Insights, and Network Insights, as seen in Figure 7.17:

Figure 7.17 – Azure Monitor Overview
A useful feature of Azure Monitor is Activity Log, which displays the last transactions executed in the Azure cloud and who initiated the transaction, as seen in Figure 7.18:

Figure 7.18 – Azure Monitor Activity log
This can be useful to an IT auditor who needs to document who performed a certain transaction.
Another feature that can be useful to an IT auditor is Alerts. You can set up alerts for various conditions. In this example, we are setting up alerts for All Administrative operations over the last week, as seen in Figure 7.19. This type of rule can be useful to an IT auditor when monitoring administrative operations and ensuring they are authorized.

Figure 7.19 – Creating an alert rule
Next, we will look at another Azure tool, referred to as Azure Network Watcher.
Azure Network Watcher
Another tool an IT auditor can leverage is Azure Network Watcher. Azure Network Watcher is designed to monitor and repair the network health of infrastructure as a service (IaaS) products, which include virtual machines, virtual networks, application gateways, load balancers, and so on. To launch Azure Network Watcher, you can easily search for it in a browser or on the Azure console, as seen in Figure 7.20:

Figure 7.20 – Azure Network Watcher
One feature of interest to an IT auditor is the Effective security rules tab. For our example, let us navigate to the Effective security rules tab as shown in Figure 7.21:

Figure 7.21 – Effective security rules
We will then click on the packttest2-nsg rule to expand it and review the individual rules, as seen in Figure 7.22. As we can see, we have two exclamation marks on two inbound rules that would be of extreme interest to an IT auditor. Examining these rules closely, we will find that SSH and RDP access is not restricted inbound from the internet. If you can recall from Chapter 4, Network, Infrastructure, and Security Controls, we noted that the Azure CIS Benchmarks recommend that any Network Security Groups (NSG) should not allow unrestricted inbound access to remote server administration ports, such as SSH to port 22 and RDP to port 3389. This is because attackers can use various brute-force techniques to gain access to Azure Virtual Machines using remote server administration ports, such as 22 and 3389.

Figure 7.22 – packttest2-nsg
Next, we will look at tools in GCP.
GCP
Lastly, we will look at cloud auditing tools that can be leveraged within GCP.
Google Cloud Monitoring
IT auditors can leverage Google Cloud Monitoring to gain real-time visibility into GCP. We can get to Cloud Monitoring by simply searching for it on the Google Cloud console, as shown in Figure 7.23:

Figure 7.23 – Google Cloud Monitoring Overview
A useful feature for an IT auditor is Dashboards. This provides us with dashboards for Disks, Firewalls, Infrastructure Summary, and VM Instances:

Figure 7.24 – Dashboards Overview
One valuable dashboard to review is Firewalls. Let us go to the Firewalls dashboard, as seen in Figure 7.25:

Figure 7.25 – The Firewalls dashboard
If we dig deeper, we note that there is an ingress/inbound rule that allows traffic from the internet (0.0.0.0/0). This particular rule should pique an IT auditor’s interest as port 22 (SSH) is a network protocol that has system administrator capabilities.

Figure 7.26 – Security Rules
Another useful feature of Google Cloud Monitoring is Alerting. The Alerting feature can allow you to trigger an alert based on a predefined metric. The Alerting dashboard can be seen in Figure 7.27:

Figure 7.27 – Alerts
As an example, we can add a metric such as Audited Resource, as seen in Figure 7.28:
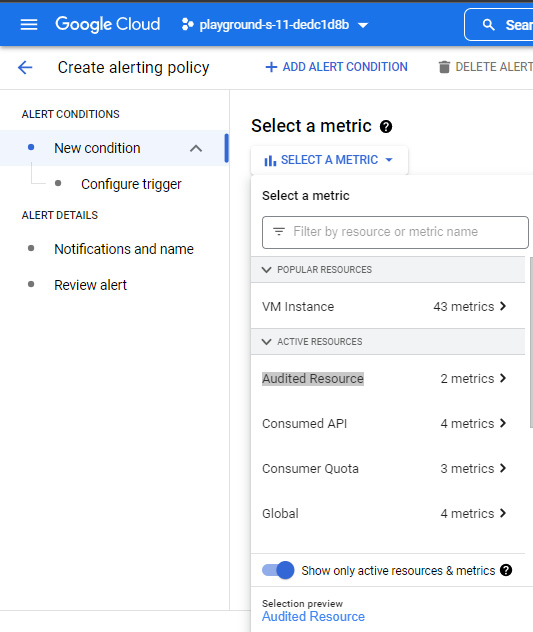
Figure 7.28 – Selecting a metric
Next, we will look at another tool in GCP referred to as Network Intelligence Center.
Network Intelligence Center
Another tool an IT auditor can leverage for visibility in GCP is Network Intelligence Center. As per Google’s documentation, “Network Intelligence Center provides a single console for Google Cloud network observability, monitoring, and troubleshooting.”
Network Intelligence Center has five modules:
- Network Topology
- Connectivity Tests
- Performance Dashboard
- Firewall Insights
- Network Analyzer
Firewall Insights and Network Analyzer provide very valuable information for an IT auditor. You can get to Network Intelligence by searching for it on the Google console, as seen in Figure 7.29:

Figure 7.29 – Network Intelligence
Let us start with Firewall Insights. As per Google’s documentation, “Firewall Insights helps in optimizing firewall rules. Firewall Insights provides data about how firewall rules are being used, exposes misconfigurations, and identifies rules that could be made stricter.” When you launch Firewall Insights, you will see a dashboard with different categories of rules, as seen in Figure 7.30:

Figure 7.30 – Firewall Insights
Let us click on the Allow rules with overly permissive IP address or port ranges tab. In our example, the IT auditor should note there are default rules present, including allowing inbound network traffic to SSH and RDP. In Chapter 4, Network, Infrastructure, and Security Controls, we stated that default firewall rules are over-permissive and insecure; therefore, the IT auditor needs to examine these default rules closely to ensure they match the organization’s risk posture. The default rules can be seen in Figure 7.31:

Figure 7.31 – VPC firewalls rules
Another module the IT auditor should leverage is Network Analyzer. As per Google’s documentation, “Network Analyzer automatically monitors your VPC network configurations and detects misconfigurations and suboptimal configurations.” Network Analyzer can provide very useful information to an IT auditor, such as VPC Network and Network Services, as seen in Figure 7.32:

Figure 7.32 – Network Analyzer
Summary
In this chapter, we looked at the tools for monitoring the performance, availability, and security of infrastructure and applications for AWS, Azure, and GCP environments. We covered standard tools and options that exist within each cloud environment, and how an IT auditor can leverage them to monitor and assess the respective clouds.
In our next chapter, we will perform a walk-through demonstrating how to assess identity and access management (IAM) controls.