Chapter 10. Network Infrastructure Device Telemetry and Analysis
This chapter covers the following topics:
• Syslog in Large-Scale Environments
• Next-Generation Firewall and Next-Generation IPS Logs
This chapter covers different network and host security telemetry solutions. Network telemetry and logs from network infrastructure devices such as firewalls, routers, and switches can prove useful when you’re proactively detecting or responding to a security incident. Logs from user endpoints can help you not only for attribution if they are part of a malicious activity but also for victim identification.
“Do I Know This Already?” Quiz
The “Do I Know This Already?” quiz allows you to assess whether you should read this entire chapter thoroughly or jump to the “Exam Preparation Tasks” section. If you are in doubt about your answers to these questions or your own assessment of your knowledge of the topics, read the entire chapter. Table 10-1 lists the major headings in this chapter and their corresponding “Do I Know This Already?” quiz questions. You can find the answers in Appendix A, “Answers to the ‘Do I Know This Already?’ Quizzes and Review Questions.”
Table 10-1 “Do I Know This Already?” Foundation Topics Section-to-Question Mapping

1. Why should you enable Network Time Protocol (NTP) when you collect logs from network devices?
a. Doing so ensures that network and server logs are collected faster.
b. Syslog data is useless if it shows the wrong date and time. Using NTP ensures that the correct time is set and that all devices within the network are synchronized.
c. When you use NTP, network devices can record the time for certificate management.
d. NTP is not supported when you are collecting logs from network infrastructure devices.
2. Which of the following statements about syslog is true?
a. Logging to a syslog server is recommended because the storage size of a syslog server does not depend on the router’s resources and is limited only by the amount of disk space available on the external syslog server.
b. Messages in each syslog severity level not only display the events for that level but also show the messages from the lower severity levels.
c. Syslog level 7 should be enabled only when troubleshooting network or system problems.
d. All of these answers are correct.
3. Cisco ASA supports which of the following types of logging? (Select all that apply.)
a. Console logging
b. Terminal logging
c. Email logging
d. All of these answers are correct.
4. You were hired to deploy an open-source solution for syslog collection and analysis. Which of the following could be an option?
a. Cisco Firepower Management Center (FMC)
b. Cisco ThousandEyes
c. Splunk
d. Elasticsearch, Logstash, and Kibana (ELK) stack
5. What are some of the characteristics of next-generation firewall and next-generation IPS logging capabilities? (Select all that apply.)
a. With next-generation firewalls, you can only monitor malware activity and not access control policies.
b. Access control policies allow you to specify, inspect, and log the traffic that can traverse your network. An access control policy determines how the system handles traffic on your network.
c. Next-generation firewalls and next-generation IPSs help you identify and mitigate the effects of malware. The FMC file control, network file trajectory, and advanced malware protection (AMP) can detect, track, capture, analyze, log, and optionally block the transmission of files, including malware files and nested files inside archive files.
d. AMP is supported by Cisco next-generation firewalls, but not by IPS devices.
6. Chelin is an analyst in a security operations center (SOC) investigating an incident where large amounts of IP traffic (data) is leaving the organization late at night to suspicious hosts on the Internet. What technology could help Chelin obtain network metadata in an effective manner to detect such suspicious activity?
a. IPS
b. NetFlow
c. Full packet capture
d. None of these answers are correct.
7. Refer to the following exhibit:
SrcIf   SrcIPaddress    DstIf  DstIPaddress  Pr SrcP DstP  Pkts
Gi0/0   192.168.88.123  Gi1/1  172.18.10.2   06 0014 01BB    44
Gi0/0   192.168.88.123  Gi1/1  172.18.11.8   06 0015 01BB    67
Which of the following describes the data shown in the exhibit?
a. Next-generation IPS logs showing traffic from 192.168.88.123 to 172.18.10.2 over TCP ports 14 and 15
b. NetFlow records showing traffic from 192.168.88.123 to 172.18.10.2 over TCP port 443
c. NetFlow records showing traffic from 192.168.88.123 to 172.18.10.2 over UDP port 443
d. Next-generation firewall logs showing traffic from 192.168.88.123 to 172.18.10.2 over UDP port 443
8. Which of the following is true regarding full packet capture?
a. Full packet capture demands great system resources and engineering efforts, not only to collect the data and store it but also to be able to analyze it. That is why, in many cases, it is better to obtain network metadata by using NetFlow.
b. Full packet captures can be discarded within seconds of being collected because they are not needed for forensic activities.
c. NetFlow and full packet captures serve the same purpose.
d. Most sniffers do not support collecting broadcast and multicast traffic.
9. Refer to the following exhibit:
981 0.088139613   10.6.6.104 ? 10.6.6.3 TCP 58 51822 ? 85 [SYN] Seq=0 Win=1024 Len=0 MSS=1460
982 0.088142414   10.6.6.3 ? 10.6.6.104 TCP 54 85 ? 51822 [RST, ACK] Seq=1 Ack=1 Win=0 Len=0
983 0.088149799   10.6.6.104 ? 10.6.6.3 TCP 58 51822 ? 2121 [SYN] Seq=0 Win=1024 Len=0 MSS=1460
984 0.088152316   10.6.6.3 ? 10.6.6.104 TCP 54 2121 ? 51822 [RST, ACK] Seq=1 Ack=1 Win=0 Len=0
985 0.088150251   10.6.6.104 ? 10.6.6.3 TCP 58 51822 ? 2366 [SYN] Seq=0 Win=1024 Len=0 MSS=1460
986 0.088154484   10.6.6.3 ? 10.6.6.104 TCP 54 2366 ? 51822 [RST, ACK] Seq=1 Ack=1 Win=0 Len=0
987 0.088173645   10.6.6.104 ? 10.6.6.3 TCP 58 51822 ? 38292 [SYN] Seq=0 Win=1024 Len=0 MSS=1460
Which of the following best describes the data shown in the exhibit?
a. A network packet capture in tshark or tcpdump showing potential scanning activity from 10.6.6.3
b. A network packet capture in tshark or tcpdump showing potential scanning activity from 10.6.6.104
c. NetFlow records showing potential scanning activity from 10.6.6.104
d. NetFlow records showing potential scanning activity from 10.6.6.3
10. Which of the following are types of telemetry that can be used to perform network profiling?
a. Used and open ports
b. Throughput
c. Session duration
d. All of these answers are correct.
Foundation Topics
Network Infrastructure Logs
The network can provide deep insights and the data to determine whether a cybersecurity incident has happened. This section covers the various types of telemetry features available in the network and how to collect such data. Even a small network can generate a large amount of data. That’s why it is also important to have the proper tools to be able to analyze such data.
![]()
Logs from network devices such as firewalls, routers, and switches can prove useful when you’re proactively detecting or responding to a security incident. For example, brute-force attacks against a router, switch, or firewall can be detected by system log (syslog) messages that could reveal the suspicious activity. Log collectors often offer correlation functionality to help identify compromises by correlating syslog events.
Syslog messages from transit network devices can provide insight into and context for security events that might not be available from other sources. Syslog messages definitely help to determine the validity and extent of an incident. They can be used to understand communication relationships, timing, and, in some cases, the attacker’s motives and tools. These events should be considered complementary and used in conjunction with other forms of network monitoring already be in place.
Table 10-2 summarizes the different severity logging (syslog) levels in Cisco ASA, Cisco FTD, Cisco IOS, Cisco IOS-XE, Cisco IOS-XR, and Cisco NX-OS devices.
Table 10-2 Syslog Severity Logging Levels

Each severity level not only displays the events for that level but also shows the messages from the lower severity levels. For example, if logging is enabled for debugging (level 7), the router, switch, or firewall also logs levels 0 through 6 events.
Most Cisco infrastructure devices use syslog to manage system logs and alerts. In a Cisco router or switch, logging can be done to the device console or internal buffer, or the device can be configured to send the log messages to an external syslog server for storing. Logging to a syslog server is recommended because the storage size of a syslog server does not depend on the router’s resources and is limited only by the amount of disk space available on the external syslog server. This option is not enabled by default in Cisco devices. In Figure 10-1, a router (R1) is configured with syslog and is sending all logs to a syslog server with the IP address of 10.11.11.8 in the management network.

Figure 10-1 Syslog Server Topology
Network Time Protocol and Why It Is Important
![]()
Before you configure a Cisco device to send syslog messages to a syslog server, you need to make sure the router, switch, or firewall is configured with the right date, time, and time zone. Syslog data is useless if it shows the wrong date and time. As a best practice, you should configure all network devices to use Network Time Protocol (NTP). Using NTP ensures that the correct time is set and that all devices within the network are synchronized.
In Example 10-1, the router (R1) is configured to perform DNS resolution to the Cisco OpenDNS free DNS server 208.67.222.222 with the ip name-server command. Domain lookup is enabled with the ip domain-lookup command, and then finally the router is configured as an NTP client and synchronized with the NTP server 0.north-america.pool.ntp.org with the ntp server command.
Example 10-1 Configuring NTP in a Cisco Router
R1# configure terminal
Enter configuration commands, one per line.  End with CNTL/Z.
R1(config)# ip name-server 208.67.222.222
R1(config)# ip domain-lookup
1(config)# ntp server 0.north-america.pool.ntp.org
Tip
The pool.ntp.org project is a free and scalable virtual cluster of NTP servers deployed around the world to provide NTP services for millions of clients. You can obtain more information about these NTP servers at www.pool.ntp.org.
You can use the show ntp status command to display the status of the NTP service in the router, as demonstrated in Example 10-2.
Example 10-2 show ntp status Command Output
R1# show ntp status
Clock is synchronized, stratum 3, reference is 173.230.149.23
nominal freq is 1000.0003 Hz, actual freq is 1000.1594 Hz, precision is 2**19
ntp uptime is 131100 (1/100 of seconds), resolution is 1000
reference time is DB75E178.34FE24FB (23:55:36.207 UTC Sat Sep 3 2016)
clock offset is -1.8226 msec, root delay is 70.89 msec
root dispersion is 220.49 msec, peer dispersion is 187.53 msec
loopfilter state is ‘CTRL’ (Normal Controlled Loop), drift is -0.000159112 s/s
system poll interval is 64, last update was 6 sec ago.
You can use the show ntp associations command to display the NTP associations to active NTP servers, as demonstrated in Example 10-3.
Example 10-3 show ntp associations Command Output
R1# show ntp associations
  address         ref clock       st   when   poll reach  delay  offset   disp
*~173.230.149.23  127.67.113.92    2     11     64     1 69.829  -1.822 187.53
 * sys.peer, # selected, + candidate, - outlyer, x falseticker, ~ configured
To verify the time in the router, use the show clock details command, as demonstrated in Example 10-4.
Example 10-4 show clock details Command Output
R1# show clock detail
23:55:53.416 UTC Sat Sep 3 2022
Time source is NTP
In Example 10-4, you can see that the time source is NTP.
Configuring Syslog in a Cisco Router or Switch
Example 10-5 demonstrates how to configure syslog in a Cisco router or switch running Cisco IOS or Cisco IOS-XE software.
Example 10-5 Configuring NTP in a Cisco Router
R1# configure terminal
Enter configuration commands, one per line.  End with CNTL/Z.
R1(config)# logging host 10.11.11.8
R1(config)# logging trap warnings
R1(config)# service timestamps debug datetime msec localtime show-timezone
R1(config)# service timestamps log datetime msec localtime show-timezone
In Example 10-5, R1 is configured to send syslog messages to the syslog server with the IP address 10.11.11.8, as you saw previously in the topology shown in Figure 10-1. The logging trap command specifies the maximum severity level of the logs sent to the syslog server. The default value is informational and lower. The service timestamps command instructs the system to timestamp syslog messages; the options for the type keyword are debug and log.
You can display statistics and high-level information about the type of logging configured in a router or switch by invoking the show log command, as demonstrated in Example 10-6.
Example 10-6 Output of the show log Command
R1# show log
Syslog logging: enabled (0 messages dropped, 3 messages rate-limited, 0 flushes, 0 overruns, xml disabled, filtering disabled)
No Active Message Discriminator.
No Inactive Message Discriminator.
    Console logging: level informational, 74 messages logged, xml disabled,
                     filtering disabled
    Monitor logging: level debugging, 0 messages logged, xml disabled,
                     filtering disabled
    Buffer logging:  level debugging, 76 messages logged, xml disabled,
                    filtering disabled
    Exception Logging: size (8192 bytes)
    Count and timestamp logging messages: disabled
    Persistent logging: disabled

No active filter modules.
    Trap logging: level informational, 13 message lines logged
        Logging to 10.11.11.8  (udp port 514, audit disabled,
              link up),
              3 message lines logged,
              0 message lines rate-limited,
              0 message lines dropped-by-MD,
              xml disabled, sequence number disabled
              filtering disabled
        Logging Source-Interface:       VRF Name:

Log Buffer (8192 bytes):
*Mar  1 00:00:00.926: %ATA-6-DEV_FOUND: device 0x1F0
*Mar  1 00:00:10.148: %NVRAM-5-CONFIG_NVRAM_READ_OK: NVRAM configuration ‘flash:/nvram’ was read from disk.
*Sep  3 22:24:51.426: %CTS-6-ENV_DATA_START_STATE: Environment Data Download in start state
*Sep  3 22:24:51.689: %PA-3-PA_INIT_FAILED: Performance Agent failed to initialize (Missing Data License)
The first highlighted line in Example 10-6 shows that syslog logging is enabled. The second highlighted line shows that the router is sending syslog messages to 10.11.11.8. The default syslog port in a Cisco infrastructure device is UDP port 514. You can change the port or protocol by using the logging host command with the transport and port keywords, as shown in Example 10-7.
Example 10-7 Changing the Protocol and Port Used for Syslog
logging host 10.11.11.8 transport tcp port 55
In the topology illustrated in Figure 10-1, the syslog server is a basic Ubuntu Linux server. To enable syslog in Ubuntu, you first edit the rsyslog.conf configuration file with your favorite editor. In Example 10-8, vim is used to edit the file.
Example 10-8 Editing the rsyslog.conf File
omar@omar:~$ sudo vim /etc/rsyslog.conf
Once you are in the file, you can uncomment the two lines shown in Example 10-9 to enable syslog in the default UDP port (514).
Example 10-9 Enabling Syslog over UDP in the rsyslog.conf File
module(load=”imudp”)
input(type=”imudp” port=”514”)
Once you edit the rsyslog.conf configuration file, restart rsyslog with the sudo service rsyslog restart command. All of R1’s syslog messages can now be seen in the server under /var/log/syslog.
You can also deploy more comprehensive open-source logging solutions such as Elasticsearch, Logstash, and Kibana (ELK) stack. Figure 10-2 shows an example of logs from a Cisco switch in Kibana (the web console component of the ELK stack).

Figure 10-2 Logs from a Cisco Switch in ELK
Traditional Firewall Logs
![]()
The Cisco ASA supports the following types of logging capabilities:
• Console logging
• Terminal logging
• ASDM logging
• Email logging
• External syslog server logging
• External SNMP server logging
• Buffered logging
The followings sections detail each logging type.
Console Logging
Just like Cisco IOS and IOS-XE devices, the Cisco ASA supports console logging. Console logging enables the Cisco ASA to send syslog messages to the console serial port. This method is useful for viewing specific live events during troubleshooting.
Tip
Enable console logging with caution; the serial port is only 9600 bits per second, and the syslog messages can easily overwhelm the port. If the port is already overwhelmed, access the security appliance from an alternate method, such as SSH or Telnet, and lower the console-logging severity.
Terminal Logging
Terminal logging sends syslog messages to a remote terminal monitor such as a Telnet or SSH session. This method is also useful for viewing live events during troubleshooting. It is recommended that you define an event class for terminal logging so that your session does not get overwhelmed with the logs.
ASDM Logging
You can enable the security appliance to send logs to Cisco Adaptive Security Device Manager (ASDM). This feature is extremely beneficial if you use ASDM as the configuration and monitoring platform. You can specify the number of messages that can exist in the ASDM buffer. By default, ASDM shows 100 messages in the ASDM logging window. You can use the logging asdm-buffer-size command to increase this buffer to store up to 512 messages.
Email Logging
The Cisco ASA supports sending log messages directly to individual email addresses. This feature is extremely useful if you are interested in getting immediate notification when the security appliance generates a specific log message. When an interesting event occurs, the security appliance contacts the specified email server and sends an email message to the email recipient from a preconfigured email account.
Using email-based logging with a logging level of notifications or debugging may easily overwhelm an email server or the Cisco ASA.
Syslog Server Logging
Cisco ASA supports sending the event logs to one or multiple external syslog servers. Messages can be stored for use in anomaly detection or event correlation. The security appliance allows the use of both TCP and UDP protocols to communicate with a syslog server. You must define an external server to send the logs to it, as discussed later in the “Configuring Logging on the Cisco ASA” section.
SNMP Trap Logging
The Cisco ASA also supports sending the event logs to one or multiple external Simple Network Management Protocol (SNMP) servers. Messages are sent as SNMP traps for anomaly detection or event correlation.
Buffered Logging
The Cisco ASA allocates 4096 bytes of memory to store log messages in its buffer. This is the preferred method to troubleshoot an issue because it does not overwhelm the console or the terminal ports. If you are troubleshooting an issue that requires you to keep more messages than the buffer can store, you can increase the buffer size up to 1,048,576 bytes.
Note
The allocated memory is a circular buffer; consequently, the security appliance does not run out of memory as the older events get overwritten by newer events.
Configuring Logging on the Cisco ASA
Although you are not required to configure Cisco ASAs or any other infrastructure devices in the CyberOps Associate exam, the following examples are worthwhile for your reference. You can configure logging in the Cisco ASA via the ASDM or via the command-line interface. To enable logging of system events through ASDM, go to Configuration > Device Management > Logging > Logging Setup and check the Enable Logging checkbox. This option enables the security appliance to send logs to all the terminals and devices set up to receive the syslog messages. Example 10-10 shows the CLI commands used to enable syslog in the Cisco ASA.
Example 10-10 Enabling Syslog in the Cisco ASA via the CLI
ASA-1# configure terminal
ASA-1(config)# logging enable
ASA-1(config)# logging debug-trace
ASA-1(config)# logging host management 10.11.11.8
ASA-1(config)# logging emblem
After the logging is enabled, ensure that the messages are timestamped before they are sent. This step is extremely important because in case of a security incident, you want to use the logs generated by the security appliance to backtrace. Navigate to Configuration > Device Management > Logging, Syslog Setup and choose the Include Timestamp in Syslog option. If you prefer to use the CLI, use the logging timestamp command, as shown in Example 10-11.
Example 10-11 Enabling Syslog Timestamps in the Cisco ASA via the CLI
ASA-1(config)# logging timestamp
You can use the show logging command to display the logging configuration and statistics, as shown in Example 10-12.
Example 10-12 Output of the show logging Command in the Cisco ASA
ASA1# show logging
Syslog logging: enabled
    Facility: 20
    Timestamp logging: disabled
    Standby logging: disabled
    Debug-trace logging: enabled
    Console logging: disabled
    Monitor logging: disabled
    Buffer logging: disabled
    Trap logging: level informational, facility 20, 257 messages logged
        Logging to management 10.11.11.8
    Permit-hostdown logging: disabled
    History logging: disabled
    Device ID: disabled
    Mail logging: disabled
    ASDM logging: disabled
Syslog in Large-Scale Environments
![]()
Large organizations use more scalable and robust systems for log collection and analysis. The following are a few examples of scalable commercial and open-source log-collection and -analysis platforms:
• Splunk
• Graylog
• Elasticsearch, Logstash, and Kibana (ELK) stack
Splunk
The commercial log analysis platform Splunk is very scalable. You can customize many dashboards and analytics. Many large enterprises use Splunk as their central log collection engine. A few options are available:
• Splunk Enterprise Security (ES): A security information and event management (SIEM) solution that provides robust log search and analysis capabilities for medium to large organizations. Splunk ES includes dashboards, data models, and logic for analyzing data from Cisco IOS, IOS XE, IOS XR, and NX-OS devices using Splunk Enterprise. Splunk’s Cisco Security Suite provides a single-pane-of-glass interface that’s tailor-made for your Cisco environment. Security teams can customize a full library of saved searches, reports, and dashboards to take full advantage of security-relevant data collected across Cisco ASA firewalls, Firepower Threat Defense (FTD), Cisco Web Security Appliance (WSA), Cisco Email Security Appliance (ESA), Cisco Identity Services Engine (ISE), and Cisco next-generation IPS devices.
• Splunk Phantom Security Orchestration and Automation: A Security Orchestration, Automation, and Response (SOAR) solution that allows you to automate repetitive tasks in the security operations center.
• Splunk User Behavior Analytics: A platform that can be used to investigate user behavior and abnormalities that may be related to unknown threats. This platform can be used for threat hunting.
Graylog
Graylog is a scalable open-source analysis tool that can be used to monitor security events from firewalls, IPS devices, and other network infrastructure devices. The folks at Graylog have many different examples and prepackaged installations including, but not limited to, the following:
• Prepackaged virtual machine appliances
• Installation scripts for Chef, Puppet, Ansible, and Vagrant
• Easy-to-install Docker containers
• OpenStack images
• Images that can run in Amazon Web Services
• Microsoft Windows servers and Linux-based servers
Graylog is fairly scalable and supports a multinode setup. You can also use Graylog with load balancers. A typical deployment scenario when running Graylog in multiple servers is to route the logs to be sent to the Graylog servers through an IP load balancer. When you deploy a load balancer, you gain high availability and also scalability by just adding more Graylog servers/instances that can operate in parallel.
Graylog supports any syslog messages compliant with RFC 5424 and RFC 3164 and also supports TCP transport with both the octet counting and termination character methods. It also supports UDP as the transport, and it is the recommended way to send log messages in most architectures.
Several devices do not send RFC-compliant syslog messages. This might result in wrong or completely failing parsing. In that case, you might have to go with a combination of raw/plaintext message inputs that do not attempt to do any parsing. Graylog accepts data via inputs.
Elasticsearch, Logstash, and Kibana (ELK) Stack
The Elasticsearch ELK stack is a powerful open-source analytics platform. ELK stands for Elasticsearch, Logstash, and Kibana.
Elasticsearch is the name of a distributed search and analytics engine, but it is also the name of the company founded by the folks behind Elasticsearch and Apache Lucene. Elasticsearch is built on top of Apache Lucene, which is a high-performance search and information retrieval library written in Java. Elasticsearch is a schema-free, full-text search engine with multilanguage support. It provides support for geolocation, suggestive search, auto-completion, and search snippets.
Logstash offers centralized log aggregation of many types, such as network infrastructure device logs, server logs, and also NetFlow. Logstash is written in JRuby and runs in a Java virtual machine (JVM). It has a simple message-based architecture. Logstash has a single agent that is configured to perform different functions in combination with the other ELK components.
Figure 10-3 shows a dashboard created in Kibana (the visualization front-end tool of the ELK stack) that displays over 16 million log entries during a month’s timeframe. Visualizations like the one in Figure 10-3 enable security professionals to identify anomalies in their network. In this figure, a noticeable spike of security alerts is observed in a single day, depicting a network outbreak.

Figure 10-3 Security Alert Visualization in Kibana
Figure 10-4 shows additional details of network-based intrusion detection system (NIDS) logs. In this example, the NDIS system used is Snort. In this figure you can see several alerts of known Trojans and other malware communicating to command and control (CnC or C2) servers.

Figure 10-4 NDIS Alerts in Kibana
Figure 10-5 shows the different NISD log categories from alerts generated in the network over a given amount of time.

Figure 10-5 Visualization of Different NIDS Alerts Categories
The four major components in the Logstash ecosystem are as follows:
• The shipper: This component sends events to Logstash. Typically, remote agents will run only this component.
• The broker and indexer: These components receive and index the events.
• The search and storage: These components allow you to search and store events.
• The web interface: The web-based interface is called Kibana.
Logstash is very scalable because servers running Logstash can run one or more of these aforementioned components independently. Kibana is an analytics and visualization platform architected for Elasticsearch. It provides real-time summary and charting of streaming data, with the ability to share and embed dashboards.
Marvel and Shield are two additional components that can be integrated with ELK:
• Marvel: Provides monitoring of an Elasticsearch deployment. It uses Kibana to visualize the data. It provides a detailed explanation of things that are happening within the ELK deployment that are very useful for troubleshooting and additional analysis. You can obtain information about Marvel at www.elasticsearch.org/overview/marvel.
• Shield: Provides security features to ELK such as role-based access control, authentication, IP filtering, encryption of ELK data, and audit logging. Shield is not free, and it requires a license. You can obtain more information about Shield at www.elasticsearch.org/overview/shield.
Elasticsearch also provides integration with big data platforms such as Hadoop.
You can download each of the ELK components using the following links:
• Elasticsearch: www.elastic.co/downloads/elasticsearch
• Kibana: www.elastic.co/downloads/kibana
• Logstash: www.elastic.co/downloads/logstash
Tip
ElastiFlow is a great open-source data collection and visualization tool that uses ELK. It supports NetFlow versions 5 and 9, as well as IPFIX. You can acquire ElastiFlow from the following GitHub repository: https://github.com/robcowart/elastiflow. The easiest way to install ElastiFlow is by using Docker and docker-compose, as demonstrated at https://github.com/robcowart/elastiflow/blob/master/DOCKER.md.
Next-Generation Firewall and Next-Generation IPS Logs
![]()
Next-generation firewalls, such as the Cisco ASA with FirePOWER services and Cisco Firepower Threat Defense, and next-generation IPS devices such as the Cisco Firepower Next-Generation IPS appliances provide a more robust solution to protect against today’s threats. They provide a whole new game when analyzing security logs and events. This integrated suite of network security and traffic management products is also known as the Cisco Firepower System, and they all can be deployed either on appliances or as software solutions via virtual machines (VMs). In a typical deployment, multiple managed devices installed on network segments monitor traffic for analysis and report to a Firepower Management Center (FMC). The FMC is the heart of all reports and event analysis.
You can monitor events for traffic that does not conform to your access control policies. Access control policies allow you to specify, inspect, and log the traffic that can traverse your network. An access control policy determines how the system handles traffic on your network. The simplest access control policy directs its target devices to handle all traffic using its default action. You can set this default action to block or trust all traffic without further inspection, or to inspect traffic for intrusions and discovery data. A more complex access control policy can blacklist traffic based on IP, URL, and DNS Security Intelligence data, as well as use access control rules to exert granular control over network traffic logging and handling. These rules can be simple or complex, matching and inspecting traffic using multiple criteria; you can control traffic by security zone, network or geographical location, VLAN, port, application, requested URL, and user. Advanced access control options include decryption, preprocessing, and performance.
Each access control rule also has an action that determines whether you monitor, trust, block, or allow matching traffic. When you allow traffic, you can specify that the system first inspect it with intrusion or file policies to block any exploits, malware, or prohibited files before they reach your assets or exit your network.
Figure 10-6 shows the Cisco FMC Summary Dashboard with different network statistics about unique applications over time, top web applications and client applications seen, as well as traffic by application risk.

Figure 10-6 Network Statistics in the Cisco FMC Summary Dashboard
Figure 10-7 shows the Cisco FMC Threats tab of the Summary Dashboard, showing statistics about observed indicators of compromise (IoCs) by hosts and by users. It also shows the number of connections by security intelligence categories, as well as malware threats and intrusion events.

Figure 10-7 Cisco FMC Threat Statistics
Figure 10-8 shows the Content Explorer window of the Cisco FMC, including traffic and intrusion events from managed devices that include next-generation firewalls and next-generation IPS devices. In this figure, you can also see high-level statistics and graphs of indicators of compromise detected in the infrastructure.

Figure 10-8 Content Explorer Window of the Cisco FMC
Figure 10-9 shows the Network Information statistics of the Content Explorer window of the Cisco FMC. In this window, you can see traffic by operating system, connections by access control action, and traffic by source and destination IP addresses, as well as source user and ingress security zone.

Figure 10-9 Network Information Statistics in the Cisco FMC
The FMC Context Explorer displays detailed, interactive graphical information in context about the status of your monitored network, including data on applications, application statistics, connections, geolocation, indications of compromise, intrusion events, hosts, servers, security intelligence, users, files (including malware files), and relevant URLs.
The FMC dashboard is highly customizable and compartmentalized, and it updates in real time. In contrast, the Context Explorer is manually updated, designed to provide broader context for its data, and has a single, consistent layout designed for active user exploration.
You can use FMC in a multidomain deployment. If you have deployed the FMC in a multidomain environment, the Context Explorer displays aggregated data from all subdomains when you view it in an ancestor domain. In a leaf domain, you can view data specific to that domain only. In a multidomain deployment, you can view data for the current domain and for any descendant domains. You cannot view data from higher-level or sibling domains.
You use the dashboard to monitor real-time activity on your network and appliances according to your own specific needs. Equally, you use the Context Explorer to investigate a predefined set of recent data in granular detail and clear context: for example, if you notice that only 15 percent of hosts on your network use Linux but account for almost all YouTube traffic, you can quickly apply filters to view data only for Linux hosts, only for YouTube-associated application data, or both. Unlike the compact, narrowly focused dashboard widgets, the Context Explorer sections are designed to provide striking visual representations of system activity in a format useful to both expert and casual users of the FMC.
Note
The data displayed depends on such factors as how you license and deploy your managed devices, and whether you configure features that provide the data. You can also apply filters to constrain the data that appears in all Context Explorer sections.
You can easily create and apply custom filters to fine-tune your analysis, and you can examine data sections in more detail by simply clicking or hovering your cursor over graph areas. For example, in Figure 10-10, you can right-click one of the top attackers under the Intrusion Events > Top Attackers section and select View Host Profile.

Figure 10-10 Drilling Down into Analysis
After you select View Host Profile, the screen shown in Figure 10-11 is displayed. This screen displays detailed information about the host, indicators of compromise, operating system, and applications.

Figure 10-11 Host Profile View in Cisco FMC
Depending on the type of data you examine, additional options can appear in the context menu. Data points that are associated with specific IP addresses offer the option to view host or whois information of the IP address you select. Data points associated with specific applications offer the option to view application information on the application you select. Data points associated with a specific user offer the option to view that user’s profile page. Data points associated with an intrusion event message offer the option to view the rule documentation for that event’s associated intrusion rule, and data points associated with a specific IP address offer the option to blacklist or whitelist that address.
![]()
Next-generation firewalls and next-generation IPS systems via the FMC also support an incident lifecycle, allowing you to change an incident’s status as you progress through your response to an attack. When you close an incident, you can note any changes you have made to your security policies as a result of any lessons learned. Generally, an incident is defined as one or more intrusion events that you suspect are involved in a possible violation of your security policies. In the FMC, the term also describes the feature you can use to track your response to an incident.
Some intrusion events are more important than others to the availability, confidentiality, and integrity of your network assets. For example, the port scan detection can keep you informed of port-scanning activity on your network. Your security policy, however, may not specifically prohibit port scanning or see it as a high-priority threat, so rather than take any direct action, you may instead want to keep logs of any port scanning for later forensic study. On the other hand, if the system generates events that indicate hosts within your network have been compromised and are participating in distributed denial-of-service (DDoS) attacks, this activity is likely a clear violation of your security policy, and you should create an incident in the FMC to help you track your investigation of these events.
The FMC and next-generation firewalls and IPS systems are particularly well suited to supporting the investigation and qualification processes of the incident response process. You can create your own event classifications and then apply them in a way that best describes the vulnerabilities on your network. When traffic on your network triggers an event, that event is automatically prioritized and qualified for you with special indicators showing which attacks are directed against hosts that are known to be vulnerable. The incident-tracking feature in the FMC also includes a status indicator that you can change to show which incidents have been escalated.
All incident-handling processes should specify how an incident is communicated between the incident-handling team and both internal and external audiences. For example, you should consider what kinds of incidents require management intervention and at what level. Also, your process should outline how and when you communicate with outside organizations. You may ask yourself the following questions:
• Do I want to prosecute and contact law enforcement agencies?
• Will I inform the victim if my hosts are participating in a DDoS attack?
• Do I want to share information with external organizations such as the CERT Coordination Center (CERT/CC) and the Forum of Incident Response and Security Teams (FIRST)?
The FMC has features that you can use to gather intrusion data in standard formats such as HTML, PDF, and comma-separated values (CSV) files so that you can easily share intrusion data with other entities. For instance, CERT/CC collects standard information about security incidents on its website that you can easily extract from FMC, such as the following:
• Information about the affected machines, including
• The host name and IP
• The time zone
• The purpose or function of the host
• Information about the sources of the attack, including
• The host name and IP
• The time zone
• Whether you had any contact with an attacker
• The estimated cost of handling the incident
• A description of the incident, including
• Dates
• Methods of intrusion
• The intruder tools involved
• The software versions and patch levels
• Any intruder tool output
• The details of vulnerabilities exploited
• The source of the attack
• Any other relevant information
You can also use the comment section of an incident to record when you communicate issues and with whom. You can create custom incidents in the Cisco FMC by navigating to Analysis, Intrusions, Incidents, as shown in Figure 10-12.

Figure 10-12 Creating Custom Incidents in the Cisco FMC
The incidents screen in the Cisco FMC also allows you to change the status of the incident from New to Assigned, Escalated, Resolved, or Closed, as demonstrated in Figure 10-13.

Figure 10-13 Incident Status in the Cisco FMC
You can specify an incident type, as illustrated in Figure 10-14. You can also add a new incident type by clicking the Types link in the screen.

Figure 10-14 Specifying the Incident Type
To help you identify and mitigate the effects of malware, the Cisco FMC file control, network file trajectory, and advanced malware protection (AMP) can detect, track, capture, analyze, log, and optionally block the transmission of files, including malware files and nested files inside archive files.
Note
You can also integrate the system with your organization’s AMP for Endpoints deployment to import records of scans, malware detections, and quarantines, as well as indicators of compromise.
The FMC can log various types of file and malware events. The information available for any individual event can vary depending on how and why it was generated. Malware events represent malware detected by either AMP for Firepower or AMP for Endpoints; malware events can also record data other than threats from your AMP for Endpoints deployment, such as scans and quarantines. For instance, you can go to Analysis, Files, Malware Events to display all malware events, as shown in Figure 10-15.

Figure 10-15 FMC Malware Summary
Retrospective malware events represent files detected by AMP whose dispositions have changed. The network file trajectory feature maps how hosts transferred files, including malware files, across your network. A trajectory charts file transfer data, the disposition of the file, and if a file transfer was blocked or quarantined. You can determine which hosts may have transferred malware, which hosts are at risk, and observe file transfer trends. Figure 10-16 shows the Network File Trajectory screen for the detection name W32.Auto:314a112563.in05.Talos that was listed in Figure 10-15.
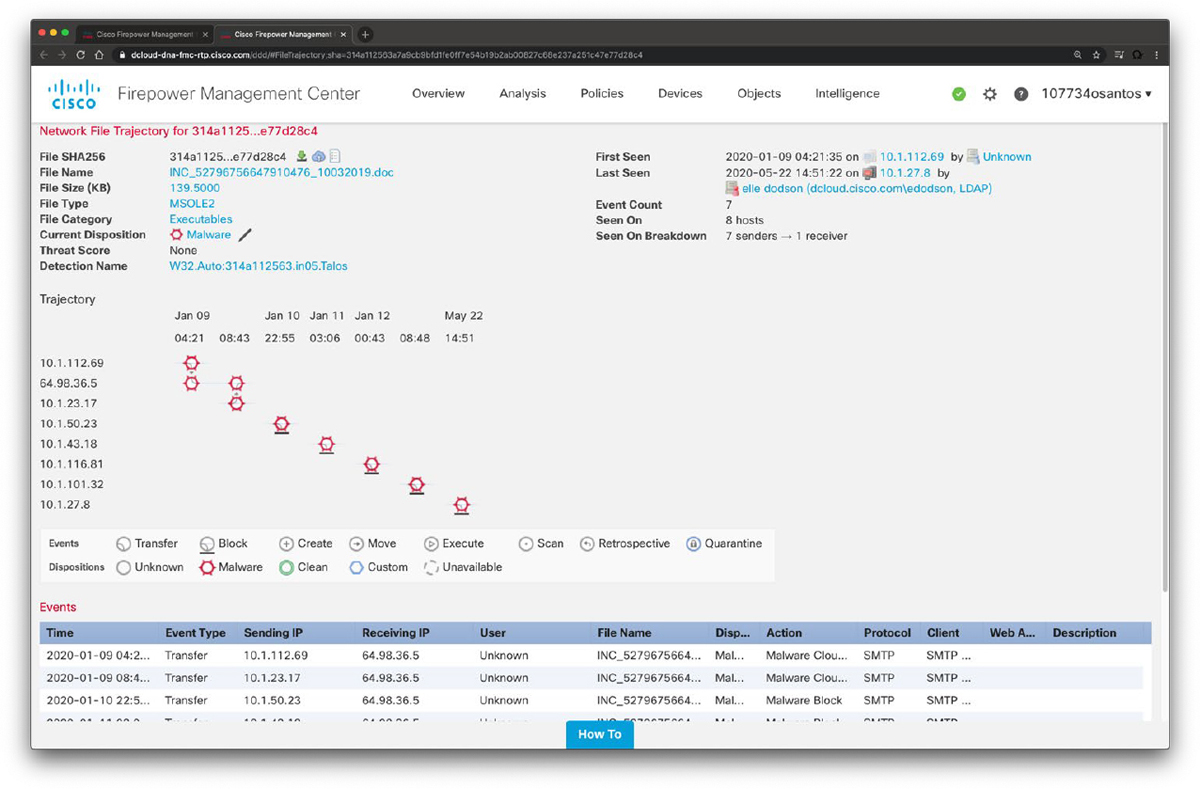
Figure 10-16 Network File Trajectory
You can track the transmission of any file with an AMP cloud-assigned disposition. The system can use information related to detecting and blocking malware from both AMP for Firepower and AMP for Endpoints to build the trajectory. The Network File Trajectory List page displays the malware most recently detected on your network, as well as the files whose trajectory maps you have most recently viewed. From these lists, you can view when each file was most recently seen on the network, the file’s SHA-256 hash value, name, type, current file disposition, contents (for archive files), and the number of events associated with the file. The page also contains a search box that lets you locate files, either based on SHA-256 hash value or filename or based on the IP address of the host that transferred or received a file. After you locate a file, you can click the File SHA256 value to view the detailed trajectory map.
You can trace a file through the network by viewing the detailed network file trajectory. There are three components to a network file trajectory:
• Summary information: The summary information about the file, including file identification information, when the file was first seen and most recently seen on the network, the number of related events and hosts associated with the file, and the file’s current disposition. From this section, if the managed device stored the file, you can download it locally, submit the file for dynamic analysis, or add the file to a file list.
• Trajectory map: Visually tracks a file from the first detection on your network to the most recent. The map shows when hosts transferred or received the file, how often they transferred the file, and when the file was blocked or quarantined. Vertical lines between data points represent file transfers between hosts. Horizontal lines connecting the data points show a host’s file activity over time.
• Related events: You can select a data point in the map and highlight a path that traces back to the first instance the host transferred that file; this path also intersects with every occurrence involving the host as either sender or receiver of the file.
The Events table lists event information for each data point in the map. Using the table and the map, you can pinpoint specific file events, hosts on the network that transferred or received this file, related events in the map, and other related events in a table constrained on selected values.
NetFlow Analysis
![]()
NetFlow is a Cisco technology that provides comprehensive visibility into all network traffic that traverses a Cisco-supported device. Cisco invented NetFlow and is the leader in IP traffic flow technology. NetFlow was initially created for billing and accounting of network traffic and to measure other IP traffic characteristics such as bandwidth utilization and application performance. NetFlow has also been used as a network-capacity planning tool and to monitor network availability. NetFlow is used by many cybersecurity professionals as a network security tool because its reporting capabilities provide nonrepudiation, anomaly detection, and investigative capabilities. As network traffic traverses a NetFlow-enabled device, the device collects traffic flow information and provides a network administrator or security professional with detailed information about such flows.
NetFlow provides detailed network telemetry that allows the administrator to do the following:
• See what is actually happening across the entire network.
• Identify DoS attacks.
• Quickly identify compromised endpoints and network infrastructure devices.
• Monitor network usage of employees, contractors, or partners.
• Obtain network telemetry during security incident response and forensics.
• Detect firewall misconfigurations and inappropriate access to corporate resources.
NetFlow supports both IP version 4 (IPv4) and IP version 6 (IPv6), and it plays a crucial role in the following:
• Network planning
• Network security
• Network troubleshooting
• Traffic engineering
Tip
Do not confuse the feature in Cisco IOS software called IP Accounting with NetFlow. IP Accounting is a great Cisco IOS tool, but it is not as robust or as well known as NetFlow.
NetFlow is often compared to a phone bill. When police want to investigate criminals, for instance, they often collect and investigate their phone records. NetFlow provides information about all network activity that can be very useful for incident response and network forensics. This information can help you discover indicators of compromise.
The following six-step methodology on security incident handling has been adopted by many organizations, including service providers, enterprises, and government organizations:
Step 1. Preparation
Step 2. Identification
Step 3. Containment
Step 4. Eradication
Step 5. Recovery
Step 6. Lessons learned
NetFlow plays a crucial role in the preparation and identification phases. Information collected in NetFlow records can be used as part of identifying, categorizing, and scoping suspected incidents as part of the identification. NetFlow data also provides great benefits for attack traceback and attribution. In addition, NetFlow provides visibility into what is getting into your network and what information is being exfiltrated out of your network.
Figure 10-17 shows an example of how a botnet is performing a DDoS attack against the corporate network, while at the same time communicating with an internal host in the call center. NetFlow in this case can be used as an anomaly-detection tool for the DDoS attack and also as a forensics tool to potentially find other IOCs of more sophisticated attacks that may be carried out incognito.

Figure 10-17 Detecting What Is Getting into Your Network
Figure 10-18 shows how a “stepping-stone” attack is carried out in the corporate network. A compromised host in the engineering department is extraditing large amounts of sensitive data to an attacker in the Internet from a server in the data center.

Figure 10-18 Detecting What Is Getting Out of Your Network
You can also use NetFlow in combination with DNS records to help you detect suspicious and malicious traffic, such as the following:
• Suspicious requests to .gov, .mil, and .edu sites when you do not even do business with any of those entities
• Large amounts of traffic leaving the organization late at night to suspicious sites
• Traffic to embargoed countries that should not have any business partners or transactions
• Suspicious virtual private network (VPN) requests and VPN traffic
• Requests and transactions to sites without any content
• Pornography sites or any other sites that violate corporate policy
• Illegal file-sharing sites
Syslog and packet captures are also often used in network forensics; however, an area where these traditional network forensics tools fall short is in coverage. For instance, it is very difficult to deploy hundreds of sniffers (packet-capture devices) in the network of large organizations. In addition, the cost will be extremely high. When a security incident or breach is detected, the incident responders need answers fast! They do not have time to go over terabytes of packet captures, and they can definitely not analyze every computer on the network to find the root cause, miscreant, and source of the breach. You can use NetFlow to obtain a high-level view of what is happening in the network, and then the incident responder can perform a deep-dive investigation with packet captures and other tools later in the investigation. Sniffers then can be deployed as needed in key locations where suspicious activity is suspected. The beauty of NetFlow is that you can deploy it anywhere you have a supported router, switch, Cisco FTD, or Cisco ASA. Cisco also sells the StealthWatch FlowSensor product, which is a physical or virtual appliance that can generate NetFlow data when legacy Cisco network infrastructure components are not capable of producing line-rate, unsampled NetFlow data.
NetFlow can fill in some of the gaps and challenges regarding the collection of packet captures everywhere in the network. It is easier to store large amounts of NetFlow data because it is only a transactional record. Therefore, administrators can keep a longer history of events that occurred on their networks. Historical records can prove very valuable when investigating a breach. Network transactions can show you where an initial infection came from, what command and control channel was initiated by the malware, what other computers on the internal network were accessed by that infected host, and whether other hosts in the network reached out to the same attacker or command and control system.
What Is a Flow in NetFlow?
A flow is a unidirectional series of packets between a given source and destination. In a flow, the same source and destination IP addresses, source and destination ports, and IP protocol are shared. This is often referred to as the 5-tuple. Figure 10-19 shows an example of a flow between a client and a server.

Figure 10-19 Basic NetFlow Example
In Figure 10-19, the client (source) establishes a connection to the server (destination). When the traffic traverses the router (configured for NetFlow), it generates a flow record. At the very minimum, the 5-tuple is used to identify the flow in the NetFlow database of flows kept on the device. This database is often called the NetFlow cache.
Table 10-3 shows the 5-tuple for the basic flow represented in Figure 10-19.
Table 10-3 NetFlow 5-Tuple

Depending on the version of NetFlow, the router can also gather additional information, such as type of service (ToS) byte, differentiated services code point (DSCP), the device’s input interface, TCP flags, byte counters, and start and end times.
Flexible NetFlow, Cisco’s next-generation NetFlow, can track a wide range of Layer 2, IPv4, and IPv6 flow information, such as the following:
• Source and destination MAC addresses
• Source and destination IPv4 or IPv6 addresses
• Source and destination ports
• ToS
• DSCP
• Packet and byte counts
• Flow timestamps
• Input and output interface numbers
• TCP flags and encapsulated protocol (TCP/UDP) and individual TCP flags
• Sections of a packet for deep packet inspection
• All fields in an IPv4 header, including IP-ID and TTL
• All fields in an IPv6 header, including Flow Label and Option Header
• Routing information, such as next-hop address, source autonomous system number (ASN), destination ASN, source prefix mask, destination prefix mask, Border Gateway Protocol (BGP) next hop, and BGP policy accounting traffic index
NetFlow protocol data units (PDUs), also referred to as flow records, are generated and sent to a NetFlow collector after the flow concludes or expires (times out).
The NetFlow Cache
There are three types of NetFlow cache:
• Normal cache: This is the default cache type in many infrastructure devices enabled with NetFlow and Flexible NetFlow. The entries in the flow cache are removed (aged out) based on the configured timeout active seconds and timeout inactive seconds settings.
• Immediate cache:
• This cache has flow accounts for a single packet.
• It is desirable for real-time traffic monitoring and DDoS detection.
• It is used when only very small flows are expected (for example, sampling).
Note
The immediate cache may result in a large amount of export data.
• Permanent cache:
• This cache is used to track a set of flows without expiring the flows from the cache.
• The entire cache is periodically exported (update timer).
• The cache is a configurable value.
• After the cache is full, new flows will not be monitored.
• This cache uses update counters rather than delta counters.
Many people often confuse a flow with a session. All traffic in a flow is unidirectional; however, when the client establishes the HTTP connection (session) to the server and accesses a web page, this represents two separate flows. The first flow is the traffic from the client to the server, and the other is the return flow from the server to the client.
NetFlow Versions
There are several versions of NetFlow. Table 10-4 lists all versions of NetFlow and provides a brief description of the features supported.
![]()
Table 10-4 NetFlow Versions

NetFlow is used as a network security tool because its reporting capabilities provide nonrepudiation, anomaly detection, and investigative capabilities. As network traffic traverses a NetFlow-enabled device, the device collects traffic flow information and provides a network administrator or security professional with detailed information about such flows.
NetFlow provides detailed network telemetry that can be used to see what is actually happening across the entire network. You can use NetFlow to identify DoS attacks, quickly identify compromised endpoints and network infrastructure devices, and monitor network usage of employees, contractors, and partners. NetFlow is also often used to obtain network telemetry during security incident response and forensics. You can also take advantage of NetFlow to detect firewall misconfigurations and inappropriate access to corporate resources.
NetFlow provides detailed network telemetry that allows you to do the following:
• See what is actually happening across your entire network
• Regain control of your network, in case of a denial-of-service attack
• Quickly identify compromised endpoints and network infrastructure devices
• Monitor network usage of employees, contractors, or partners
• Obtain network telemetry during security incident response and forensics
• Detect firewall misconfigurations and inappropriate access to corporate resources
NetFlow data can grow to tens of terabytes of data per day in large organizations, and it is expected to grow over the years to petabytes. However, many other telemetry sources can be used in conjunction with NetFlow to identify, classify, and mitigate potential threats in your network.
IPFIX
The Internet Protocol Flow Information Export (IPFIX) is a network flow standard led by the Internet Engineering Task Force (IETF). IPFIX was created to create a common, universal standard of export for flow information from routers, switches, firewalls, and other infrastructure devices. IPFIX defines how flow information should be formatted and transferred from an exporter to a collector. IPFIX is documented in RFC 7011 through RFC 7015 and RFC 5103. Cisco NetFlow Version 9 is the basis and main point of reference for IPFIX. IPFIX changes some of the terminologies of NetFlow, but in essence they are the same principles of NetFlow Version 9.
IPFIX is considered to be a push protocol. Each IPFIX-enabled device regularly sends IPFIX messages to configured collectors (receivers) without any interaction by the receiver. The sender controls most of the orchestration of the IPFIX data messages. IPFIX introduces the concept of templates, which make up these flow data messages to the receiver. IPFIX also allows the sender to use user-defined data types in its messages. IPFIX prefers the Stream Control Transmission Protocol (SCTP) as its transport layer protocol; however, it also supports the use of Transmission Control Protocol (TCP) or User Datagram Protocol (UDP) messages.
Traditional Cisco NetFlow records are usually exported via UDP messages. The IP address of the NetFlow collector and the destination UDP port must be configured on the sending device. The NetFlow standard (RFC 3954) does not specify a specific NetFlow listening port. The standard or most common UDP port used by NetFlow is UDP port 2055, but other ports such as 9555 or 9995, 9025, and 9026 can also be used. UDP port 4739 is the default port used by IPFIX.
NetFlow is supported in many different platforms, including the following:
• Numerous Cisco routers running Cisco IOS and Cisco IOS-XE Software
• Cisco ISR Generation 2 routers
• Cisco Catalyst switches
• Cisco ASR 1000 series routers
• Cisco Carrier Routing System (CRS)
• Cisco Cloud Services Router (CSR)
• Cisco Network Convergence System (NCS)
• Cisco ASA 5500-X series next-generation firewalls
• Cisco Firepower Threat Defense (FTD)
• Cisco Stealthwatch Flow Sensor
• Cisco Wireless LAN Controllers
IPFIX defines different elements that are placed into 12 groups according to their applicability:
1. Identifiers
2. Metering and exporting process configuration
3. Metering and exporting process statistics
4. IP header fields
5. Transport header fields
6. Sub-IP header fields
7. Derived packet properties
8. Min/max flow properties
9. Flow timestamps
10. Per-flow counters
11. Miscellaneous flow properties
12. Padding
IPFIX Architecture
IPFIX uses the following architecture terminology:
• Metering process (MP): Generates flow records from packets at an observation point. It timestamps, samples, and classifies flows. The MP also maintains flows in an internal data structure and passes complete flow information to an exporting process (EP).
• Exporting process (EP): Sends flow records via IPFIX from one or more MPs to one or more collecting processes (CPs).
• Collecting process (CP): Receives records via IPFIX from one or more EPs.
IPFIX Mediators
IPFIX introduces the concept of mediators. Mediators collect, transform, and re-export IPFIX streams to one or more collectors. Their main purpose is to allow federation of IPFIX messages. Mediators include an intermediate process (ImP) that allows for the following:
• For NetFlow data to be kept anonymously
• For NetFlow data to be aggregated
• Filtering of NetFlow data
• Proxying of web traffic
• IP translation
IPFIX Templates
An IPFIX template describes the structure of flow data records within a data set. Templates are identified by a template ID, which corresponds to a set ID in the set header of the data set. Templates are composed of information element (IE) and length pairs. IEs provide field type information for each template.
A standard information model covers nearly all common flow collection use cases, such as the following:
• The traditional 5-tuple (source IP address, destination IP address, source port, destination port, and IP protocol)
• Packet treatment such as IP next-hop IPv4 addresses, BGP destination ASN, and others
• Timestamps to nanosecond resolution
• IPv4, IPv6, ICMP, UDP, and TCP header fields
• Sub-IP header fields such as source MAC address and wireless local-area network (WLAN) service set identifier (SSID)
• Various counters (packet delta counts, total connection counts, top talkers, and so on)
• Flow metadata information such as ingress and egress interfaces, flow direction, and virtual routing and forwarding (VRF) information
Note
Numerous other use cases are defined at the Internet Assigned Numbers Authority (IANA) website: www.iana.org/assignments/ipfix/ipfix.xhtml.
Commercial NetFlow Analysis Tools
There are several commercial and open-source NetFlow monitoring and analysis software packages in the industry. Two of the most popular commercial products are Cisco Stealthwatch solution and Plixer Scrutinizer. Cisco acquired a company called Lancope, and the name Stealthwatch came from products in that acquisition. One of the key benefits of Cisco Stealthwatch is its capability to scale in large enterprises. It also provides integration with the Cisco Identity Services Engine (ISE) for user identity information. Cisco ISE is a security policy management and control system that you can use for access control and security compliance for wired, wireless, and virtual private network connections.
The following are the primary components of the Cisco Stealthwatch solution:
• Stealthwatch Management Console: Provides centralized management, configuration, and reporting of the other Stealthwatch components. It can be deployed in a physical server or a virtual machine. The Stealthwatch Management Console provides high-availability features (failover).
• FlowCollector: A physical or virtual appliance that collects NetFlow data from infrastructure devices.
• FlowSensor: A physical or virtual appliance that can generate NetFlow data when legacy Cisco network infrastructure components are not capable of producing line-rate, unsampled NetFlow data. Alternatively, the Cisco NetFlow Generator Appliance (NGA) can be used.
• FlowReplicator: A physical appliance used to forward NetFlow data as a single data stream to other devices.
• Stealthwatch IDentity: An appliance that provides user identity monitoring capabilities. Administrators can search on usernames to obtain a specific user network activity. Identity data can be obtained from the Stealthwatch IDentity appliance or through integration with the Cisco ISE.
![]()
Network Address Translation (NAT) can be a challenge for security monitoring. If you collect information after a network infrastructure device has “translated” the IP packets, you will only see the “translated address” in NetFlow records or packet captures. This scenario is more challenging if the infrastructure device is configured for Port Address Translation (PAT), as illustrated in Figure 10-20.

Figure 10-20 NetFlow and NAT/PAT
In Figure 10-20 a router (R1) is configured to perform PAT, and a switch (Switch A) is configured with NetFlow. All hosts in the 10.1.1.0/24 network are “translated” to a single IP address (192.168.88.1). Subsequently, when you collect NetFlow records from Switch A, traffic from all the hosts in the 10.1.1.0/24 network are shown as 192.168.88.1. Subsequently, you do not know which specific host is sending or receiving the traffic.
Cisco Stealthwatch solution supports a feature called NAT stitching. NAT stitching uses data from network devices to combine NAT information from inside a firewall (or a NAT device) with information from outside the firewall (or a NAT device) to identify which IP addresses and users are part of a specific flow.
One other major benefit of Cisco Stealthwatch is its graphical interface, which includes great visualizations of network traffic, customized summary reports, and integrated security and network intelligence for drill-down analysis. Figure 10-21 shows the Cisco Stealthwatch Security Insight Dashboard.

Figure 10-21 Security Insight Dashboard
Cisco Stealthwatch allows you to drill into all the flows inspected by the system. For example, you can search for potential data hoarding, as demonstrated in Figure 10-22.

Figure 10-22 Suspect Data Hoarding
You can also perform very detailed searches based on a large number of parameters, as demonstrated in Figure 10-23. In the following example, a security operations center analyst searches for NetFlow flow records and activity related to a given host. In Figure 10-23, the analyst searches for the host with the IP address 10.10.30.15.

Figure 10-23 Performing Advanced Searching in Stealthwatch
One you obtain the search results, you can click the host IP address and obtain detailed information about that host in the Host Report shown in Figure 10-24.

Figure 10-24 Stealthwatch Host Report
Open-Source NetFlow Analysis Tools
The number of open-source NetFlow monitoring and analysis software packages is on the rise. You can use these open-source tools to successfully identify security threats within your network. Here are a few examples of the most popular open-source NetFlow collection and analysis toolkits:
• NFdump (sometimes used with NfSen or Stager): NfSen is the graphical web-based front end for NFdump. You can download and obtain more information about NfSen at http://nfsen.sourceforge.net.
• SiLK: The SiLK analysis suite is a popular open-source command-line Swiss army knife developed by CERT. Administrators and security professionals combine these tools in various ways to perform detailed NetFlow analysis. SiLK includes numerous tools and plug-ins. You can download SiLK from https://tools.netsa.cert.org/silk.
• ELK: Elasticsearch ELK stack is a powerful open-source NetFlow analytics platform. Previously in this chapter, you learned that ELK stands for Elasticsearch, Logstash, and Kibana. You can obtain additional information about ELK from www.elastic.co.
• Elastiflow: This robust open-source framework enables you to collect and analyze NetFlow and IPFIX data based on the ELK stack. You can download Elastiflow from https://github.com/robcowart/elastiflow.
NFdump is a set of Linux-based tools that support NetFlow Versions 5, 7, and 9. You can easily install NFdump in multiple Linux distributions such as Debian and Ubuntu using sudo apt install nfdump.
Routers, firewalls, and any other NetFlow-enabled infrastructure devices can send NetFlow records to NFdump. The command to capture the NetFlow data is nfcapd. All processed NetFlow records are stored in one or more binary files. These binary files are read by NFdump and can be displayed in plaintext to standard output (stdout) or written to another file. Example 10-13 demonstrates how the nfcapd command is used to capture and store NetFlow data in a directory called netflow. The server is configured to listen to port 9996 for NetFlow communication.
Example 10-13 Using the nfcapd Command
omar@server1:~$ nfcapd -w -D -l netflow -p 9996
omar@server1:~$ cd netflow
omar@server1:~/netflow$ ls -l
total 544
-rw-r--r-- 1 omar omar  20772 Sep 18 00:45 nfcapd.202009180040
-rw-r--r-- 1 omar omar  94916 Sep 18 00:50 nfcapd.202009180045
-rw-r--r-- 1 omar omar  84108 Sep 18 00:55 nfcapd.202009180050
-rw-r--r-- 1 omar omar  78564 Sep 18 01:00 nfcapd.202009180055
-rw-r--r-- 1 omar omar 106732 Sep 18 01:05 nfcapd.202009180100
-rw-r--r-- 1 omar omar  73692 Sep 18 01:10 nfcapd.202009180105
-rw-r--r-- 1 omar omar  76996 Sep 18 01:15 nfcapd.202009180110
-rw-r--r-- 1 omar omar    276 Sep 18 01:15 nfcapd.current
Flows are read either from a single file or from a sequence of files. In Example 10-13, a series of files was created by the nfcapd daemon. Example 10-14 shows the command options of the nfcapd daemon command.
Example 10-14 nfcapd Daemon Command Options
omar@ server1:~$ nfcapd  -h
usage nfcapd [options]
-h             this text you see right here
-u userid      Change user to username
-g groupid     Change group to groupname
-w             Sync file rotation with next 5min (default) interval
-t interval    set the interval to rotate nfcapd files
-b host        bind socket to host/IP addr
-j mcastgroup  Join multicast group <mcastgroup>
-p portnum     listen on port portnum
-l basdir      set the output directory. (no default)
-S subdir      Sub directory format. see nfcapd(1) for format
-I Ident       set the ident string for stat file. (default ‘none’)
-H             Add port histogram data to flow file.(default ‘no’)
-n Ident,IP,logdir  Add this flow source - multiple streams
-P pidfile     set the PID file
-R IP[/port]   Repeat incoming packets to IP address/port
-s rate        set default sampling rate (default 1)
-x process     launch process after a new file becomes available
-z             Compress flows in output file.
-B bufflen     Set socket buffer to bufflen bytes
-e             Expire data at each cycle.
-D             Fork to background
-E             Print extended format of netflow data. for debugging purpose only.
-T             Include extension tags in records.
-4             Listen on IPv4 (default).
-6             Listen on IPv6.
-V             Print version and exit.
Example 10-15 demonstrates how to use the nfdump command to process and analyze all files that were created by nfcapd in the netflow directory.
Example 10-15 Processing and Displaying the nfcapd Files with nfdump
omar@server1::~$ nfdump -R netflow -o extended -s srcip -s ip/flows
Top 10 Src IP Addr ordered by flows:
Date first seen          Duration Proto     Src IP Addr     Flows(%)
  Packets(%)       Bytes(%)         pps      bps   bpp
2020-09-11 22:35:10.805     2.353 any      192.168.1.140   1582(19.5)
  0(-nan)        0(-nan)        0        0     0
2020-09-11 22:35:10.829     2.380 any      192.168.1.130   875(10.8)
  0(-nan)        0(-nan)        0        0     0
2020-09-11 22:35:10.805     2.404 any      192.168.1.168   807( 9.9)
  0(-nan)        0(-nan)        0        0     0
2020-09-11 22:35:11.219     1.839 any      192.168.1.142   679( 8.4)
  0(-nan)        0(-nan)        0        0     0
2020-09-11 22:35:10.805     2.258 any      192.168.1.156   665( 8.2)
  0(-nan)        0(-nan)        0        0     0
2020-09-11 22:35:10.805     2.297 any      192.168.1.205   562( 6.9)
  0(-nan)        0(-nan)        0        0     0
2020-09-11 22:35:10.805     2.404 any      192.168.1.89    450( 5.5)
  0(-nan)        0(-nan)        0        0     0
2020-09-11 22:35:11.050     1.989 any      10.248.91.231   248( 3.1)
  0(-nan)        0(-nan)        0        0     0
2020-09-11 22:35:11.633     1.342 any      192.168.1.149   234( 2.9)
  0(-nan)        0(-nan)        0        0     0
2020-09-11 22:35:11.040     2.118 any      192.168.1.157   213( 2.6)
  0(-nan)        0(-nan)        0        0     0

Top 10 IP Addr ordered by flows:
Date first seen          Duration Proto     IP Addr         Flows(%)
  Packets(%)       Bytes(%)         pps      bps   bpp
2020-09-11 22:35:10.805     2.353 any      192.168.1.140   1582(19.5)
  0(-nan)        0(-nan)        0        0     0
2020-09-11 22:35:10.805     2.353 any      10.8.8.8        1188(14.6)
  0(-nan)        0(-nan)        0        0     0
2020-09-11 22:35:10.805     2.297 any      192.168.1.1     1041(12.8)
  0(-nan)        0(-nan)        0        0     0
2020-09-11 22:35:10.829     2.380 any      192.168.1.130   875(10.8)
  0(-nan)        0(-nan)        0        0     0
2020-09-11 22:35:10.805     2.404 any      192.168.1.168   807( 9.9)
  0(-nan)        0(-nan)        0        0     0
2020-09-11 22:35:11.219     1.839 any      192.168.1.142   679( 8.4)
  0(-nan)        0(-nan)        0        0     0
2020-09-11 22:35:10.805     2.258 any      192.168.1.156   665( 8.2)
  0(-nan)        0(-nan)        0        0     0
2020-09-11 22:35:10.805     2.297 any      192.168.1.205   562( 6.9)
  0(-nan)        0(-nan)        0        0     0
2020-09-11 22:35:10.825     2.277 any      10.190.38.99    467( 5.8)
  0(-nan)        0(-nan)        0        0     0
2020-09-11 22:35:10.805     2.404 any      192.168.1.89    450( 5.5)
  0(-nan)        0(-nan)        0        0     0

Summary: total flows: 8115, total bytes: 0, total packets: 0, avg bps: 0, avg
  pps: 0, avg bpp: 0
Time window: 2020-09-11 22:35:10 - 2020-09-11 22:35:13
Total flows processed: 8115, Blocks skipped: 0, Bytes read: 457128
Sys: 0.009s flows/second: 829924.3   Wall: 0.008s flows/second: 967222.9
In Example 10-15, you can see the top talkers (top hosts that are sending the most traffic in the network). You can refer to the nfdump man pages for details about use of the nfdump command (using the man nfdump command).
Big Data Analytics for Cybersecurity Network Telemetry
NetFlow data, syslog, SNMP logs, server and host logs, packet captures, and files (such as executables, malware, and exploits) can be parsed, formatted, and combined with threat intelligence information and other “enrichment data” (network metadata) to perform analytics. This process is not an easy one; this is why Cisco created an open-source framework for big data analytics called Open Security Operations Center (OpenSOC). OpenSOC was later replaced by Apache Metron. You can find additional information about Apache Metron at http://metron.incubator.apache.org/.
Apache Metron was created to attack the “big data problem” for managed threat defense services. Cisco developed a fully managed service delivered by Cisco Security Solutions to help customers protect against known intrusions, zero-day attacks, and advanced persistent threats. Cisco has a global network of security operations centers ensuring constant awareness and on-demand analysis 24 hours a day, 7 days a week. These SOCs needed the ability to capture full packet-level data and extract protocol metadata to create a unique profile of the customer’s network and monitor it against Cisco threat intelligence. As you can imagine, performing big data analytics for one organization is a challenge; Cisco has to perform big data analytics for numerous customers, including very large enterprises. The goal with OpenSOC and now Apache Metron is to have a robust framework based on proven technologies to combine machine-learning algorithms and predictive analytics to detect today’s security threats.
The following are some of the benefits of these frameworks:
• Capturing raw network packets, storing those packets, and performing traffic reconstruction
• Collecting any network telemetry, performing enrichment, and generating real-time rules-based alerts
• Performing real-time search and cross-telemetry matching
• Generating automated reports
• Performing anomaly detection and alerting
• Integrating with existing analytics tools
Note
Metron is open sourced under the Apache license.
These frameworks use technologies such as the following:
• Hadoop
• Flume
• Kafka
• Storm
• Hive
• Elasticsearch
• HBase
• Third-party analytic tool support (R, Python-based tools, Power Pivot, Tableau, and so on)
The challenges of big data analytics include the following:
• Data capture capabilities
• Data management (curation)
• Storage
• Adequate and real-time search
• Sharing and transferring of information
• Deep-dive and automated analysis
• Adequate visualizations
Big data has become a hot topic due to the overabundance of data sources inundating today’s data stores as applications proliferate. These challenges will become even bigger as the world moves to the Internet of Everything (IoE), a term coined by Cisco. IoE is based on the foundation of the Internet of Things (IoT) by adding network intelligence that allows convergence, orchestration, and visibility across previously disparate systems. IoT is the networked connection of physical objects. IoT is one of many technology transitions that enable the IoE.
The goal is to make networked connections more relevant by turning information into actions that create new capabilities. The IoE consists of many technology transitions, including the IoT. The key concepts are as follows:
• Machine-to-machine connections: Including things such as IoT sensors, remote monitoring, industrial control systems, and so on
• People-to-people connections: Including collaboration technologies such as Telepresence, Webex, and so on
• Machine-to-people connections: Including traditional and new applications
Big data analytics for cybersecurity in an IoE world will require substantial engineering to address the huge datasets. Scalability will be a huge challenge. In addition, the endless variety of IoT applications presents a security operational challenge. We are starting to experience these challenges now. For instance, on the factory floor, embedded programmable logic controllers (PLCs) that operate manufacturing systems and robots can be a huge target for bad actors. Do we know all the potential true indicators of compromise so that we can perform deep-dive analysis and perform good incident response?
The need to combine threat intelligence and big data analytics will be paramount in this ever-changing world.
Cisco Application Visibility and Control (AVC)
The Cisco Application Visibility and Control (AVC) solution is a collection of services available in several Cisco network infrastructure devices to provide application-level classification, monitoring, and traffic control. The Cisco AVC solution is supported by Cisco Integrated Services Routers Generation 2 (ISR G2), Cisco ASR 1000 Series Aggregation Service Routers (ASR 1000s), and Cisco Wireless LAN Controllers (WLCs). The following are the capabilities that Cisco AVC combines:
• Application recognition
• Metrics collection and exporting
• Management and reporting systems
• Network traffic control
Cisco AVC uses existing Cisco Network-Based Application Recognition Version 2 (NBAR2) to provide deep packet inspection (DPI) technology to identify a wide variety of applications within the network traffic flow, using Layer 3 to Layer 7 data. NBAR works with quality of services (QoS) features to help ensure that the network bandwidth is best used to fulfill its main primary objectives. The benefits of combining these features include the ability to guarantee bandwidth to critical applications, limit bandwidth to other applications, drop selective packets to avoid congestion, and mark packets appropriately so that the network and the service provider’s network can provide QoS from end to end.
Cisco AVC includes an embedded monitoring agent that is combined with NetFlow to provide a wide variety of network metrics data. Examples of the type of metrics the monitoring agent collects include the following:
• TCP performance metrics such as bandwidth usage, response time, and latency
• VoIP performance metrics such as packet loss and jitter
These metrics are collected and exported in NetFlow v9 or IPFIX format to a management and reporting system.
Note
In Cisco routers, metrics records are sent out directly from the data plane when possible to maximize system performance. However, if more complex processing is required on the Cisco AVC-enabled device, such as if the user requests that a router keep a history of exported records, the records may be exported from the route processor at a lower speed.
As previously mentioned, administrators can use QoS capabilities to control application prioritization. Protocol discovery features in Cisco AVC show you the mix of applications currently running on the network. This helps you define QoS classes and policies, such as how much bandwidth to provide to mission-critical applications and how to determine which protocols should be policed. Per-protocol bidirectional statistics are available, such as packet and byte counts, as well as bit rates.
After administrators classify the network traffic, they can apply the following QoS features:
• Using class-based weighted fair queuing (CBWFQ) for guaranteed bandwidth
• Enforcing bandwidth limits using policing
• Marking for differentiated service downstream or from the service provider using the type of service bits or DSCPs in the IP header
• Dropping policy to avoid congestion using weighted random early detection (WRED)
Network Packet Capture
![]()
Full packet capture can be very useful to see exactly what’s happening on the network. In a perfect world, network security administrators would have full packet capture enabled everywhere. However, this is not possible because packet capture demands great system resources and engineering efforts, not only to collect the data and store it, but also to be able to analyze it. That is why, in many cases, it is better to obtain network metadata by using NetFlow, as previously discussed in this chapter.
Packet capture tools are called sniffers. Sometimes you hear the phrase “sniffer traces,” which means the same thing as “packet captures.” Packet captures are very helpful when someone wants to re-create an attack scenario or when doing network forensics. Logging all packets that come and leave the network may be possible with proper filtering, storage, indexing, and recall capabilities. You can also opt for a rolling or constant packet capture deployment, with the option of searching historical data in more long-term storage. Broadcast, multicast, and other chatty network protocols can also be filtered to reduce the total size of packet captures.
Encryption can also cause problems when analyzing data in packet captures because you cannot see the actual payload of the packet. The following are some pros and cons of full packet capture:
• Packet captures provide a full historical record of a network transaction or an attack. It is important to recognize that no other data source offers this level of detail.
• Packet capture data requires understanding and analysis capabilities.
• Collecting and storing packet captures takes a lot of resources. Depending on your environment, this can be fairly expensive.
The following are a few examples of the many commercial and open-source packet capture utilities (sniffers) available:
• tcpdump, which is an open-source packet capture utility that runs on Linux and Mac OS X systems
• Wireshark, which is one of the most popular open-source packet capture utilities used by many professionals
• Netscout enterprise packet capture solutions
• Solarwinds Deep Packet Inspection and Analysis
tcpdump
tcpdump is an open-source packet capture utility that runs on Linux and Mac OS X systems. It provides good capabilities for capturing traffic to and from a specific host.
In Example 10-16, tcpdump is invoked to capture packets to and from cisco.com. The system that is connecting to cisco.com is 192.168.78.3.
Example 10-16 Example of tcpdump to cisco.com
bash-3.2$ sudo tcpdump host cisco.com
tcpdump: data link type PKTAP
tcpdump: verbose output suppressed, use -v or -vv for full protocol decode
listening on pktap, link-type PKTAP (Packet Tap), capture size 262144 bytes
02:22:03.626075 IP 192.168.78.3.59133 > www1.cisco.com.http: Flags [S], seq 1685307965, win 65535, options [mss 1460,nop,wscale 5,nop,nop,TS val 29606499 ecr 0,sackOK,eol], length 0
02:22:03.655776 IP www1.cisco.com.http > 192.168.78.3.59133: Flags [S.], seq 1635859801, ack 1685307966, win 32768, options [mss 1380], length 0
02:22:03.655795 IP 192.168.78.3.59133 > www1.cisco.com.http: Flags [.], ack 1, win 65535, length 0
02:22:06.044472 IP 192.168.78.3.59133 > www1.cisco.com.http: Flags [P.], seq 1:6, ack 1, win 65535, length 5: HTTP: get
02:22:06.073700 IP www1.cisco.com.http > 192.168.78.3.59133: Flags [.], ack 6, win 32763, length 0
02:22:13.732096 IP 192.168.78.3.59133 > www1.cisco.com.http: Flags [P.], seq 6:8, ack 1, win 65535, length 2: HTTP
02:22:13.953418 IP www1.cisco.com.http > 192.168.78.3.59133: Flags [.], ack 8, win 32761, length 0
02:22:15.029650 IP 192.168.78.3.59133 > www1.cisco.com.http: Flags [P.], seq 8:9, ack 1, win 65535, length 1: HTTP
02:22:15.059947 IP www1.cisco.com.http > 192.168.78.3.59133: Flags [P.], seq 1:230, ack 9, win 32768, length 229: HTTP
02:22:15.060017 IP 192.168.78.3.59133 > www1.cisco.com.http: Flags [.], ack 230, win 65535, length 0
02:22:15.089414 IP www1.cisco.com.http > 192.168.78.3.59133: Flags [F.], seq 230, ack 9, win 5840, length 0
02:22:15.089441 IP 192.168.78.3.59133 > www1.cisco.com.http: Flags [.], ack 231, win 65535, length 0
02:22:15.089527 IP 192.168.78.3.59133 > www1.cisco.com.http: Flags [F.], seq 9, ack 231, win 65535, length 0
02:22:15.119438 IP www1.cisco.com.http > 192.168.78.3.59133: Flags [.], ack 10, win 5840, length 0
In Example 10-16, you can see high-level information about each packet that was part of the transaction. On the other hand, you can obtain more detailed information by using the -nnvvXSs 1514 option, as demonstrated in Example 10-17.
Example 10-17 Example of tcpdump to cisco.com Collecting the Full Packet
bash-3.2$ sudo tcpdump -nnvvXSs 1514 host cisco.com
tcpdump: data link type PKTAP
tcpdump: listening on pktap, link-type PKTAP (Packet Tap), capture size 1514 bytes
02:29:32.277832 IP (tos 0x10, ttl 64, id 36161, offset 0, flags [DF], proto TCP (6), length 64, bad cksum 0 (->5177)!)
    192.168.78.3.59239 > 72.163.4.161.80: Flags [S], cksum 0x5c22 (incorrect -> 0x93ec), seq 1654599046, win 65535, options [mss 1460,nop,wscale 5,nop,nop,TS val 30002554 ecr 0,sackOK,eol], length 0
         0x0000:  188b 9dad 79c4 ac87 a318 71e1 0800 4510  ....y.....q...E.
         0x0010:  0040 8d41 4000 4006 0000 c0a8 4e03 48a3  [email protected]@[email protected].
         0x0020:  04a1 e767 0050 629f 2d86 0000 0000 b002  ...g.Pb.-.......
         0x0030:  ffff 5c22 0000 0204 05b4 0103 0305 0101  ..”............
         0x0040:  080a 01c9 cd7a 0000 0000 0402 0000       .....z........
02:29:32.308046 IP (tos 0x0, ttl 243, id 28770, offset 0, flags [none], proto TCP (6), length 44)
    72.163.4.161.80 > 192.168.78.3.59239: Flags [S.], cksum 0xca59 (correct), seq 1699681519, ack 1654599047, win 32768, options [mss 1380], length 0
         0x0000:  ac87 a318 71e1 188b 9dad 79c4 0800 4500  ....q.....y...E.
         0x0010:  002c 7062 0000 f306 fb79 48a3 04a1 c0a8  .,pb.....yH.....
         0x0020:  4e03 0050 e767 654f 14ef 629f 2d87 6012  N..P.geO..b.-.’.
         0x0030:  8000 ca59 0000 0204 0564                 ...Y.....d
02:29:32.308080 IP (tos 0x10, ttl 64, id 62245, offset 0, flags [DF], proto TCP (6), length 40, bad cksum 0 (->ebaa)!)
    192.168.78.3.59239 > 72.163.4.161.80: Flags [.], cksum 0x5c0a (incorrect -> 0x61c7), seq 1654599047, ack 1699681520, win 65535, length 0
         0x0000:  188b 9dad 79c4 ac87 a318 71e1 0800 4510  ....y.....q...E.
         0x0010:  0028 f325 4000 4006 0000 c0a8 4e03 48a3  .(.%@[email protected].
         0x0020:  04a1 e767 0050 629f 2d87 654f 14f0 5010  ...g.Pb.-.eO..P.
         0x0030:  ffff 5c0a 0000                           .....
02:29:35.092892 IP (tos 0x10, ttl 64, id 42537, offset 0, flags [DF], proto TCP (6), length 45, bad cksum 0 (->38a2)!)
    192.168.78.3.59239 > 72.163.4.161.80: Flags [P.], cksum 0x5c0f (incorrect -> 0x7c47), seq 1654599047:1654599052, ack 1699681520, win 65535, length 5: HTTP, length: 5
         get
         0x0000:  188b 9dad 79c4 ac87 a318 71e1 0800 4510  ....y.....q...E.
         0x0010:  002d a629 4000 4006 0000 c0a8 4e03 48a3  .-.)@[email protected].
         0x0020:  04a1 e767 0050 629f 2d87 654f 14f0 5018  ...g.Pb.-.eO..P.
         0x0030:  ffff 5c0f 0000 6765 740d 0a              .....get..
02:29:35.123164 IP (tos 0x0, ttl 243, id 34965, offset 0, flags [none], proto TCP (6), length 40)
    72.163.4.161.80 > 192.168.78.3.59239: Flags [.], cksum 0xe1c6 (correct), seq 1699681520, ack 1654599052, win 32763, length 0
         0x0000:  ac87 a318 71e1 188b 9dad 79c4 0800 4500  ....q.....y...E.
         0x0010:  0028 8895 0000 f306 e34a 48a3 04a1 c0a8  .(.......JH.....
         0x0020:  4e03 0050 e767 654f 14f0 629f 2d8c 5010  N..P.geO..b.-.P.
         0x0030:  7ffb e1c6 0000                           ......
***output omitted for brevity***
There are many different parameters and options in tcpdump, which you can learn about in more detail in the tcpdump man page (which you can access by using the man tcpdump command).
Tip
The following site provides a good list of examples when using tcpdump: https://danielmiessler.com/study/tcpdump.
Wireshark
Wireshark is one of the most popular open-source packet analyzers because it supports many features and a huge list of common and uncommon protocols with an easy-to-navigate GUI. Wireshark can be downloaded from www.wireshark.org. The installation setup is very simple, and within a few clicks, you will be up and running with Wireshark on a Mac OS X or Microsoft Windows machine.
Wireshark provides the user with really good filtering capability. Filters in Wireshark are like conditionals that software developers use while writing code. For example, you can filter by source or destination IP address, protocol, and so on. Wireshark provides the following two types of filtering options:
• Capture filters: Used before starting the capture.
• Display filters: Used during the analysis of captured packets. Display filters can also be used while capturing because they do not limit the packets being captured; they just restrict the visible number of packets.
Figure 10-25 shows a screen capture of Wireshark.

Figure 10-25 The Wireshark Packet Sniffer
Tip
If you are new to packet capture and sniffing, Wireshark’s website has several sample packet captures you can play with. Go to https://wiki.wireshark.org/SampleCaptures. Security Onion (https://securityonion.net) also includes sample packet captures of known attacks, vulnerabilities, and malware activity. These packet captures can be found under /opt/samples in Security Onion.
Network Profiling
Profiling involves identifying something based on various characteristics specified in a detector. Typically, this is a weighted system, meaning that with more data and higher-quality data, the target system can be more accurately profiled. An example might be using generic system data to identify that a system is possibly an Apple OS X product versus gaining enough information (such as detailed application or network protocol data) to distinguish an iPad from an iPhone. The results come down to the detector, data quality, and how the detectors are used.
![]()
This section focuses on network profiling concepts. These are methods used to capture network-based data that can reveal how systems are functioning on the network. The areas of focus for this section are determining throughput, ports used, session duration, and address space. Throughput directly impacts network performance. For most networks, it is mission critical to not over-utilize throughput; otherwise, the users will not be happy with the overall network performance. Network access comes from a LAN, VPN, or wireless connection; however, at some point that traffic will eventually connect to a network port. This means that by monitoring ports, you can tell what is accessing your network regardless of the connection type. Session duration refers to how long systems are on the network or how long users are accessing a system. This is important for monitoring potential security issues as well as for baselining user and server access trends. Lastly, address space is important to ensure critical systems are given priority over other systems when you’re considering distributing network resources.
Let’s start off by looking into profiling network throughput.
Throughput
Throughput is the amount of traffic that can cross a specific point in the network, and at what speed. If throughput fails, network performance suffers, and most likely people will complain. Administrators typically have alarms monitoring for situations where throughput utilization reaches a level of concern. Normal throughput levels are typically recorded as a network baseline, where a deviation from that baseline could indicate a throughput problem. Baselines are also useful for establishing real throughput compared to what is promised by your service provider. Having a network baseline may sound like a great idea; however, the challenge is establishing what your organization’s real network baseline should be.
The first step in establishing a network baseline is identifying the devices on your network that can detect network traffic, such as routers and switches. Once you have an inventory, the next step is identifying what type of data can be pulled from those devices. The most common desired data is network utilization; however, that alone should not be your only source for building a network baseline. Network utilization has limitations, such as knowing what devices are actually doing on the network.
There are two common tactics for collecting network data for traffic analytic purposes. The first approach is capturing packets and then analyzing the data. The second approach is capturing network flow, also known as NetFlow. Both approaches have benefits and disadvantages. Packet capturing can provide more details than NetFlow; however, this approach requires storing packets as well as a method to properly analyze what is captured. Capturing packets can quickly increase storage requirements, making this option financially challenging for some organizations. Other times, the details provided by capturing packets are necessary for establishing baselines as well as security requirements and therefore is the best approach versus what limited data NetFlow can provide. For digital forensics requirements, capturing packets will most likely be the way to go due to the nature of the types of details needed to perform an investigation and to validate findings during the legal process.
NetFlow involves looking at network records versus actually storing data packets. This approach dramatically reduces storage needs and can be quicker to analyze. NetFlow can provide a lot of useful data; however, that data will not be as detailed as capturing the actual packets. An analogy of comparing capturing packets to NetFlow would be monitoring a person’s phone. Capturing packets would be similar to recording all calls from a person’s phone and spending time listening to each call to determine if there is a performance or security incident. This approach obviously would be time consuming and require storage for all the calls. Capturing NetFlow would be similar to monitoring the call records to and from the phone being analyzed, meaning less research and smaller storage requirements. Having the phone call (packet capture) would mean having details about the incident, whereas the call record (NetFlow) would show possible issues, such as multiple calls happening at 3 a.m. between the person and another party. In this case, you would have details such as the phone numbers, time of call, and length of call. If these call records are between a married person and somebody who is not that person’s significant other, it could indicate a problem—or it could simply be planning for a surprise party. The point is, NetFlow provides a method to determine areas of concern quickly, whereas packet capturing determines concerns as well as includes details about the event since the actual data is being analyzed versus records of the data when using NetFlow. Also, it is important to note that some vendors offer hybrid solutions that use NetFlow but start capturing packets upon receiving an alarm. One example of a hybrid technology is Cisco’s Stealthwatch technology.
Once you have your source and data type selected, the final task for establishing a baseline is determining the proper length of time to capture data. This is not an exact science; however, many experts will suggest at least a week to allow for enough data to accommodate trends found within most networks. This requirement can change depending on many factors, such as how the business model of an organization could have different levels of traffic at different times of the year. A simple example of this concept would be how retailers typically see higher amounts of traffic during holiday seasons, meaning a baseline sample during peak and nonpeak business months would most likely be different. Network spikes must be accounted for if they are perceived to be part of the normal traffic, which is important if the results of the baseline are to be considered a true baseline of the environment. Time also impacts results in that any baseline taken today may be different in the future as the network changes, making it important to retest the baseline after a certain period of time.
Most network administrators’ goal for understanding throughput is to establish a network baseline so throughput can later be monitored with alarms that trigger at the sign of a throughput valley or peak. Peaks are spikes of throughput that exceed the normal baseline, whereas valleys are periods of time that are below the normal baseline. Peaks can lead to problems, such as causing users to experience long delays when accessing resources, triggering redundant systems to switch to backups, breaking applications that require a certain data source, and so on. A large number of valleys could indicate that a part of the network is underutilized, representing a waste of resources or possible failure of a system that normally utilizes certain resources.
Many tools are available for viewing the total throughput on a network. These tools can typically help develop a network baseline as well as account for predicted peaks and valleys. One common metric used by throughput-measuring tools is bandwidth, meaning the data rate supported by a network connection or interface. Bandwidth, referred to as bits per second (bps), is impacted by the capacity of the link as well as latency factors, meaning things that slow down traffic performance.
Best practice for building a baseline is capturing bandwidth from various parts of the network to accommodate the many factors that impact bandwidth. The most common place to look at throughput is the gateway router, meaning the place that traffic enters and leaves the network. However, throughput issues can occur anywhere along the path of traffic, so only having a sample from the gateway could be useful for understanding total throughput for data leaving and entering the network, but this number would not be effective for troubleshooting any issues found within the network. For example, network congestion could occur between a host and network relay point prior to data hitting the network gateway, making the throughput at the gateway look slower than it actually would be if the administrator only tests for complications from the host network and doesn’t validate the entire path between the host and gateway.
Measuring throughput across the network can lead to the following improvements:
• Understanding the impact of applications on the network
• Reducing peak traffic by utilizing network optimization tools to accommodate for latency-generating elements such as bandwidth hogs
• Troubleshooting and understanding network pain points, meaning areas that cause latency
• Detecting unauthorized traffic
• Using security and anomaly detection
• Understanding network trends for segmentation and security planning
• Validating whether quality of service settings are being utilized properly
Let’s look at some methods for measuring throughput.
Measuring Throughput
To capture packets and measure throughput, you need a tap on the network before you can start monitoring. Most tools that collect throughput leverage a single point configured to provide raw data, such as pulling traffic from a switch or router. If the access point for the traffic is a switch, typically a network port is configured as a Switched Port Analyzer (SPAN) port, sometimes also called port mirroring or port monitoring. The probe capturing data from a SPAN port can be either a local probe or data from a SPAN port that is routed to a remote monitoring tool.
The following is an example of configuring a Cisco switch port as a SPAN port so that a collection tool can be set up to monitor throughput. The SPAN session for this example is ID 1 and is set to listen on the fastEthernet0/1 interface of the switch while exporting results to the fastEthernet0/10 interface of the switch. SPAN sessions can also be configured to capture more than one VLAN.
Switch(config)# no monitor session 1
Switch(config)# monitor session 1 source interface fastEthernet0/1
Switch(config)# monitor session 1 destination interface fastEthernet0/10  encapsulation dot1q
Switch(config)# end
Another method for capturing packets is to place a capturing device in the line of traffic. This is a common tactic for monitoring throughput from a routing point or security checkpoint, such as a firewall configured to have all traffic cross it for security purposes. Many current firewall solutions offer a range of throughput-monitoring capabilities that cover the entire network protocol stack.
Routers can be leveraged to view current throughput levels. To see the current state of an interface on a standard Cisco router, simply use the show interface command to display lots of data, including bps, packets sent, and so on. Some sample numbers from running this command might include the following information:
5 minute input rate 131000 bits/sec, 124 packets/sec
5 minute output rate 1660100 bit/sec, 214 packets/sec
This output provides details on throughput at that moment in time. Taking the average of samples across a span of time would be one method of calculating a possible network baseline.
Packet capture tools, sometimes referred to as packet analyzers or packet sniffers, are hardware or programs that intercept and log traffic as it passes over a digital network. This happens as a data stream crosses the network while the packet capture tool captures each packet and decodes the packet’s raw data elements representing the various fields that can be interpreted to understand its content.
The requirements for capturing packets are having access to the data, the ability to capture and store the data, tools to interoperate with the data, and capabilities to use the data. This means the tool must be able to access the data from a tap and have enough storage to collect the data, and it must be able to read the results and have a method to use those results for some goal. Failing at any of these will most likely result in an unsuccessful packet capture session. Previously in this chapter you learned that one of the most popular packet capture applications used by industry experts is Wireshark. Wireshark can break down packets using various filters, thus aiding an analyst’s investigation of a captured session.
Capturing NetFlow is a different process than collecting network packets. NetFlow must be supported on the system to generate NetFlow data, and that data must be exported to a NetFlow collector that can translate NetFlow into usable data. Exceptions to this requirement are tools such as the Cisco Stealthwatch Flow Sensor. These tools enable you to convert raw data into NetFlow in a network-tap-like deployment. The typical sources of NetFlow are routers, switches, wireless access points, and virtual networking solutions that offer the ability to produce NetFlow upon proper configuration, meaning turning those devices into NetFlow producers rather than purchasing more equipment to create NetFlow. Note that some devices may require software upgrades or flat out do not support the ability to create NetFlow.
The last throughput topic to consider is how to make improvements to your network baseline as well as accommodate for peaks and valleys. One tactic is implementing QoS tools designed to define different priory levels for applications, users, and data flows, with the goal of guaranteeing a certain level of performance to that data. For throughput, this could be guaranteeing a specific bit rate, latency, jitter, and packet loss to protect throughput levels from elements that could impact traffic types with a higher priority. An example would be providing high priority to video traffic since delays would be quickly noticed versus delays in delivering email. QoS is also important for defending against attacks directed at services such as DOS and DDOS attacks. Best practice is defining the data types on your network and configuring QoS properties for those deemed as high importance, which are commonly voice traffic, video traffic, and data from critical systems.
The following list highlights the key throughput concepts:
• A network baseline represents normal network patterns.
• Establishing a network baseline involves identifying devices that will collect throughput, pick the type of data available to be collected, and determine the time to collect data.
• The two common tactics for collecting data are capturing packets and harvesting NetFlow.
• Peaks and valleys are indications of a spike and a reduced amount of throughput from the network baseline, respectively. Both could represent a network problem.
• Network throughput is typically measured in bandwidth, and delays are identified as latency.
• Packet capture technologies are either inline to the network traffic being captured or positioned on a SPAN port.
• Enabling NetFlow on supported devices involves enabling NetFlow and pointing the collected NetFlow to a NetFlow analyzer tool.
• QoS can be used to prioritize traffic to guarantee performance of specific traffic types such as voice and video.
Used Ports
Obviously, having a device that is publicly accessible over the Internet with unnecessary ports open increases the attack surface and the risk for malicious actors all over the world to launch an attack. However, the external adversaries are not the only threat. Insiders can also launch attacks against your organization, or already-compromised systems can also perform additional internal attacks to steal sensitive information or cause disruption. This is why you need to identify critical assets. After you identify those systems, you then need to identify which services are accessible. The device should be behind a firewall, allowing minimal exposure to the services it is running. Sometimes, however, services and associated ports that are not expected are exposed. To determine this, you can run a port scan (such as nmap) to enumerate the services that are running on the exposed hosts.
A port scan is an active scan in which the scanning tool sends various types of probes to the target IP address and then examines the responses to determine whether the service is actually listening. For instance, with an Nmap SYN scan, the tool sends a TCP SYN packet to the TCP port it is probing. This is also referred to as half-open scanning because it does not open a full TCP connection. If the response is a SYN/ACK, this would indicate that the port is actually in a listening state. If the response to the SYN packet is an RST (reset), this would indicate that the port is closed or not in a listening state. If the SYN probe does not receive any response, Nmap marks it as filtered because it cannot determine if the port is open or closed.
Tip
You can find a detailed Nmap cheat sheet at my GitHub repository. You can use this resource to learn the different options of Nmap: https://github.com/The-Art-of-Hacking/h4cker/blob/master/cheat_sheets/NMAP_cheat_sheet.md.
Session Duration
Another important network topic is monitoring how long devices are connected to the network. The value in knowing this can be learning how long users utilize network resources during different periods of the workday, identifying when a critical system goes offline, and identifying how to enforce usage policies, such as limiting access to the network to approved times. An example of limiting access could be controlling guest access to only work hours. This section focuses on viewing the session duration of devices connecting to a network rather than on the time users are logged in to a host system.
Session duration in network access terms is the total time a user or device connects to a network and later disconnects from that network. The session average is the total duration of all sessions at a time divided by the number of sessions. Taking the average of a host’s session duration for a period of time can provide a baseline of how that system utilizes network resources. This can be a very valuable tool for monitoring for anomalies that could represent a technical issue or security breach. An example is identifying that for the first time in eight months, one system starts connecting to other systems it has never connected to in the past. Malicious software is typically designed to spread through the network. Also, attackers tend to seek other systems when compromising a network. Seeing authorized yet “weird” behavior or behavior outside of normal sessions can indicate an insider threat. The same approach can be used to identify whether any critical systems are identified as leaving the network, indicating a problem such as internal network complications or power loss.
Identifying sessions starts with knowing what devices are connected to the network. Session duration is a little different in that you need to use SNMP, NETCONF, RESTCONF, or a port-monitoring solution to gather exact utilization data.
The following list highlights the key session duration concepts:
• Session duration in network access terms is the total time a user or device connects to a network and later disconnects from that network.
• Identifying sessions starts with knowing what devices are connected to the network.
• Many tools are available on the market that leverage SNMP, NetFlow, packet captures, and so on, to monitor the entire session a host is seen on the network.
Critical Asset Address Space
The last topic for the network section of this chapter involves looking at controlling the asset address space. This is important to ensure that critical assets are provisioned network resources, limit devices from interfering with devices deemed a higher importance, and possibly control the use of address spaces for security or cost purposes.
Address space can be either Internet Protocol version 4 (IPv4) or 6 (IPv6). IPv4 uses 32-bit addresses broken down into 4 bytes, which equals 8 bits per byte. An IPv4 address is written in a dotted-decimal notation. The address is divided into two parts, where the highest-order octet of the address identifies the class of network, and the rest of the address represents the host. There are five classes of networks: Classes A, B, C, D, and E. Classes A, B, and C have different bit lengths for the new network identification, meaning the rest of the network space will be different regarding the capacity for address hosts. Certain ranges of IP addresses defined by the Internet Engineering Task Force and the Internet Assigned Numbers Authority are restricted from general use and reserved for special purposes. Network Address Translation was developed as a method to remap one IP address space into another by modifying network address information; however, this still doesn’t deal with the increasing demand for new IP addresses.
To tackle the issue of available IPv4 address depletion, IPv6 was created as a replacement. It offers a much larger address space that ideally won’t be exhausted for many years. This also removes the need for NAT, which has its own inherent problems. IPv6 is made up of a 128-bit address format logically divided into a network prefix and host identifier. The number of bits in a network prefix is represented by a prefix length, while the remaining bits are used for the host identifier. Many network administrators leverage IPv4-to-IPv6 transition techniques, such as running both protocols simultaneously, which is known as dual stacking or translating between IPv4 and IPv6 approaches.
Regardless of the version of IP addressing being used, IP address management (IPAM) will be a topic to tackle. Factors that impact address management include the version of IP addresses deployed, DNS security measures, and Dynamic Host Configuration Protocol (DHCP) support. IPAM can be broken down into three major areas of focus.
• IP address inventory: This function involves obtaining and defining the public and private IPv4 and IPv6 address space as well as allocating that address space to locations, subnets, devices, address pools, and users on the network.
• Dynamic IP address services management: This function deals with the parameters associated with each address pool defined within the IP address space management function as well as how DHCP servers supply relevant IP addresses and parameters to requesting systems. This function also includes managing capacity of address pools to ensure dynamic IP addresses are available.
• IP name services management: This function involves managing Domain Name System (DNS) assignment so devices can access URL resources by name. This also includes other relevant DNS management tasks.
Each of these areas is critical to the proper operation of an IP-based network. Any device accessing the network regardless of connection type will need an IP address and the ability to access internal and/or external resources to be productive. Typically, this starts with an organization obtaining a public IPv4 or IPv6 address space from an Internet service provider (ISP). Administrators must spend time planning to accommodate current and future IP address capacity requirements in user-accessible and mission-critical subnets on the network. Once those numbers are calculated, proper address allocation needs to be enforced. This means considering the routing infrastructure and avoiding issues such as duplicated IP addresses being assigned, networks rendered unreachable due to route summarization conflicts, and IP space rendered unusable due to errors in providing IP addresses in a hierarchical manager while still preserving address space for use on other parts of the network.
Address planning can be challenging and best accomplished by using a centralized IP inventory database, DHCP, and DNS policy. This provides one single, holistic view of the entire address space that is deployed across the network, regardless of the number of locations and required address pools, DHCP servers, and DNS servers. DHCP automatically provisions hosts with an IP address and other related configurations, such as a subnet mask and default gateway. Centralizing DHCP can improve configuration accuracy and consistency of address pool allocation as well as IP reallocation, as needed for ongoing address pool capacity management.
The same centralized deployment practice should be enforced for Domain Name Servers (DNS) responsible for resolving IP addresses to domain names, and vice versa. Leveraging a single DNS database simplifies deploying configuration parameters to the appropriate master or slave configuration as well as aggregating dynamic updates to keep all servers up to date. These and other strategies should make up your IP inventory assurance practice for enforcing the accuracy of IP inventory through periodic discovery, exception reporting, and selective database updates. IP assurance must be a continuous process to confirm the integrity of the IP inventory for effective IP planning.
Critical devices need additional measures to ensure other devices don’t impact their availability and functionality. Typically, two approaches are used to ensure critical devices don’t lose their IP address. One is to manually configure the IP information on those devices, and the other approach is reserving those IP addresses in DHCP. Manually setting the IP address, sometimes called statically setting or hard coding the IP address, ensures that the critical system does not rely on an external system to provide it IP information. Reserving IP addresses to the MAC address of a critical system in DHCP can accomplish the same thing; however, there is the low risk that the critical asset is relying on DHCP to issue the correct IP address, which could go down or be compromised. The risk of using static IP assignment is based on the concept that any system manually configured is not aware of how the IP address it is using impacts the rest of the network. If another device has the same IP address, there will be an IP address conflict and thus network issues. Static assignments also are manually enforced, which means this approach has a risk of address planning errors.
Once IP address sizing and deployment are complete, IP space management will become the next and ongoing challenge. This is due to various reasons that can occur and potentially impact the IP address space. New locations may open or existing locations may close. New IT services may be requested, such as Voice over IP (VoIP) requiring a new dedicated IP range. New security requirements such as network segmentation demands may be pushed down from leadership. One change that many administrators are or will eventually face is converting IPv4 networks to IPv6, as all networks are slowly adapting to the future of the Internet. The success of maintaining an effective IP address space is staying on top of these and other requests.
Here is a summary of IP address inventory management best practices:
• Use a centralized database for IP address inventory.
• Use a centralized DHCP server configuration and include failover measures.
• Document all IP subnet and address space assignments.
• Use basic security practices to provide selective address assignment.
• Track address space allocations in accordance with the routing topology.
• Deploy consistent subnet addressing policies.
• Develop network diagrams that include a naming convention for all devices using IP space.
• Continuously monitor address and pool utilization as well as adapt to capacity issues.
• Plan for IPv6 if using IPv4.
Exam Preparation Tasks
Review All Key Topics
Review the most important topics in the chapter, noted with the Key Topic icon in the outer margin of the page. Table 10-5 lists these key topics and the page numbers on which each is found.
![]()
Table 10-5 Key Topics for Chapter 10

Define Key Terms
Define the following key terms from this chapter, and check your answers in the glossary:
Review Questions
The answers to these questions appear in Appendix A, “Answers to the ‘Do I Know This Already?’ Quizzes and Review Questions.” For more practice with exam format questions, use the exam engine on the website.
1. List at least three examples of open-source packet-capture software.
2. What is a big data analytics technology that’s used by several frameworks in security operations centers to store security event information?
3. Why can encryption cause problems when you’re analyzing data in packet captures?
4. What is a command-line network packet capture utility modeled after Wireshark?
5. What are the components of the 5-tuple of a flow in NetFlow?
6. It is extremely important that your syslog and other messages are timestamped with the correct date and time. What protocol is strongly recommended for time synchronization?
7. What technology does Cisco AVC use to provide deep packet inspection (DPI) technology to identify a wide variety of applications within the network traffic flow, using Layer 3 to Layer 7 data?
8. What technology does NBAR work with to help ensure that the network bandwidth is best used to fulfill its main primary objectives?
9. Through what protocol are traditional Cisco NetFlow records are usually exported?
10. You are an analyst tasked to deploy a protocol to collect network metadata from a multivendor network environment. What protocol should you use?