China’s derivatives markets
Abstract:
This chapter presents an overall picture of China’s derivatives market and reviews the history of its development. It not only introduces China’s four futures markets and their futures products, but also discusses the price correlations between different future products and futures markets. Other derivatives markets are also described. The chapter explains why China’s derivatives market is less developed, and why China does not have the very important T-bond futures market. It also discusses the latest development of derivatives products in China’s market, such as the development of CDS (credit default swap). Furthermore, the recent rapid expansion of local underground futures markets is analyzed. The chapter finishes by discussing the problems existing in the current derivatives market and exploring how it should be supervised.
Introduction
China’s economy has been the second-largest in the world since 2010. Large economic size means huge consumption of energy and materials as well as commodities, which indicates that China’s derivatives markets should be large, particularly China’s futures market. The most important part of China’s derivatives markets is the futures market, particularly commodity futures, which have been an important component of the Chinese economy. China increasingly looks beyond its own borders to secure energy resources for domestic economic growth and hedge inflationary pressures. There are other derivatives markets, such as the foreign exchange derivatives market, the bond derivatives market, and the interest rate derivatives market, in mainland China.
China’s futures market
A brief history of China’s futures market
China’s futures market began in 1990. On 12 October 1990, approved by the State Council, Zhengzhou Grain Wholesale Market was established and introduced its first futures contract. That was China’s first commodity futures market. From 1991 onwards, many local exchanges emerged. In September 1992, the first futures brokerage firm, Guangdong Wantong Futures Brokerage Firm, was established. At the end of 1992, China International Futures Corporation Limited was founded. After that, many futures firms were established. By the end of 1993, there were more than 300 futures companies. In October 1992, Shenzhen Metals Exchanges launched the first commodity futures contract, special aluminum futures. By the end of 1993, there were about 100 futures products in mainland China. It seemed that the developing futures market had somewhat lost control.
On 6 April 1994, the State Council started to clear up the futures market. Many trading futures products were suspended or closed. The “3.27” incident in 1995 caused the suspension of T-bond futures. China started to consolidate unauthorized futures exchanges. In August 1998, the State Council merged the 14 futures exchanges into three: Dalian Commodity Exchange (DCE), Zhengzhou Commodity Exchange (ZCE) and Shanghai Futures Exchange (SHFE). To improve the management and supervision of China’s future markets, on 2 June 1999 the State Council issued Administration of Futures Trading Tentative Regulation. On 1 July 2002, Measures for the Administration of Futures Exchanges and Measures for the Administration of Futures Brokerage Company were implemented.
From 1995 to 2004, China’s futures market had been through difficult times. In 1995, the total trading value of the futures market in China was RMB 10.05 trillion Yuan. It then declined yearly. In 2000, the trading value was only RMB 1.6 trillion Yuan (Figure 3.1). Meanwhile, the number of brokerage firms decreased from more than 300 to about 180. In 2000, more than 80 percent of brokerage firms lost money. In 2001, the total profits of futures firms were only about RMB 50 million Yuan. But the development of China’s futures market has accelerated since 2004. In June 2004, after years of consolidation and clearing up of exchanges, the first new futures product, cotton contract, was launched in ZCE. In August, the first energy futures product, fuel oil contract, was traded in SHFE. On 15 April 2007, the revised Administration of Futures Trading Tentative Regulation was issued and domestic futures companies were allowed to develop overseas brokerage business.

On 9 January 2008, the first noble metal, gold, was listed for trading in SHFE. On 16 April 2010, China’s first financial futures, stock index futures or CSI 300, were launched by China Financial Futures Exchange (CFFEX). From 2002 to 2011, China’s futures market developed fast. Its trading value was increased by 35 times and trading volume was increased by 7.5 times (Figure 3.1). In 2002, the trading value was RMB 3.94 trillion Yuan, while in 2011 it reached RMB 137.5 trillion Yuan. At the end of 2002, the margin value of exchanges was about RMB 15 billion Yuan, while at the end of 2011 the margin reached RMB 200 billion Yuan, increased by 13 times. At the end of 2002, the total net assets of 181 futures firms were only RMB 6.5 billion Yuan, while at the end of 2011 the 163 futures firms had net assets of RMB 29 billion Yuan.
Today, China has four futures exchanges, including three commodity exchanges, SHFE, ZCE and DCE, and one financial futures exchange, CFFEX. SHFE is mainly for metal futures transactions. ZCE and DCE mainly offer agricultural commodity futures. CFFEX, which was jointly established by SSE, SZSE, SHFE, DCE and ZCE on 8 September 2006, offers financial futures. It is a government-backed cooperative venture and focuses on the listing, trading, clearing and settlement of financial derivatives. CFFEX currently provides only one product, the CSI 300 index. In terms of financial derivative instruments, warrant is provided by Chinese securities exchanges, such as SSE and SZSE; while stock index futures are provided by CFFEX. The four futures exchanges had offered 30 futures products, including one financial futures product, by the end of March 2013. A glass futures product was launched on 3 December 2012 in ZCE. Coking coal futures were traded on 22 March 2013. These are the latest traded futures products. Crude oil and T-bond futures may be launched in 2013.
China’s four futures exchanges
SHFE offers ten futures products (Table 3.1), most being metal futures. In 2011, SHFE’s trading value was RMB 43.45 trillion Yuan, decreased by 29.6 percent from 2010.
Table 3.1
| Futures product | Code | Launch date |
| Copper | CU | 1991 |
| Aluminum | AL | 1991 |
| Natural rubber | RU | 1991 |
| Fuel oil | FU | 25 August 2004 |
| Zinc | ZN | 26 March 2007 |
| Gold | AU | 9 January 2008 |
| Steel rebar | RB | 27 March 2009 |
| Steel wire rod | WR | 27 March 2009 |
| Lead | PB | 24 March 2011 |
| Silver | AG | 10 May 2012 |
Source: SHFE (www.shfe.com.cn)
DCE now offers nine futures products (Table 3.2), most being agricultural futures. In 2011 DCE’s trading value was 16.88 trillion Yuan, decreased by 19.07 percent from 2010.
Table 3.2
DCE’s futures products
GMO, genetically modified; RBD, refined, bleached and deodorized.
| Futures product | Code | Launch date |
| No. 1 Soybeans (non-GMO) | A | 28 February 1993 |
| Soybean meal | M | 17 July 2000 |
| Corn | C | 21 September 2004 |
| No. 2 Soybeans (GMO) | B | 22 December 2004 |
| Soybean oil | Y | 9 January 2006 |
| Linear low density polyethylene (LLDPE) | L | 31 July 2007 |
| RBD palm olein | P | 29 October 2007 |
| Polyvinyl chloride (PVC) | V | 25 May 2009 |
| Coke | J | 15 April 2011 |
Source: DCE (www.dce.com.cn)
ZCE offers eight futures products and focuses on agricultural products (Table 3.3). In 2011 ZCE’s trading value was RMB 33.42 trillion Yuan, decreased by 8.17 percent.
Table 3.3
ZCE’s futures products
PTA, pure terephthalic acid
| Futures product | Code | Launch date |
| Hard white wheat | WT | 27 November 1998 |
| Strong gluten wheat | WS | 27 November 1998 |
| Cotton (No. 1) | CF | 1 June 2004 |
| Sugar | SR | 6 January 2006 |
| PTA | TA | 18 December 2006 |
| Rapeseed oil | RO | 8 June 2007 |
| Early rice | ER | 20 April 2009 |
| Methanol | ME | 8 October 2011 |
Source: ZCE (www.czce.com.cn)
CFFEX has only one product, a stock index futures product, which was launched in April 2010. Investors trade the stock index futures to hedge the future performance of the stock market. In 2011, its trading volume reached RMB 43.77 trillion Yuan, increased by 6.56 percent from 2010. It was the only futures market among the four exchanges with higher trading value in 2011 than in 2010.
The trading of futures products
In 2011, the total trading value of China’s futures market was RMB 137.52 trillion Yuan, 11.03 percent less than in 2010. Among the 28 futures products, only the prices of gold and fuel oil on SHFE closed at increasing prices for the year, while all other products closed at declining prices. The top six trading value products were stock index futures, cotton, natural rubber, copper, sugar and pure terephthalic acid (PTA). It should be noticed that the trading volume of stock index futures was only 4.78 percent of the total trading volume of China’s futures markets, while its trading value accounted for 31.83 percent of the total trading value of China’s futures markets. The other five futures products accounted for 51.33 percent of the national trading volume, while only 46.73 percent of the national trading value. Among the four futures markets, ZCE had the largest trading volume with ten futures products and CFFEX had the smallest trading volume with only one futures product in 2011. However, CFFEX had the largest trading value with the one futures product. DCE had the smallest trading value with eight futures products (Figure 3.2 and Figure 3.3).

Figure 3.2 Market shares of futures markets in trading volume in 2011 Source: SHFE, ZCE, DCE, and CFFEX

Figure 3.3 Market shares of futures markets in trading value in 2011 Source: SHFE, ZCE, DCE, and CFFEX
In 2011, Shanghai Gold Exchanges (SGE) completed gold transactions of 7438.5 tons, increased by 22.9 percent from 2010. The amount was 30.5 tons each day on average. The trading value was RMB 2.48 trillion Yuan. The transaction volume for silver reached 24.7 tons, increased by 235.6 percent, and the transaction value was RMB 1.94 trillion Yuan, increased by 402.2 percent.
If we look at China’s futures markets from the global perspective, it can be seen that, in 2011, ZCE, SHFE and DCE ranked 11th, 14th and 15th among the global futures markets by trading volumes. Among agricultural commodity futures, China had four futures products ranked among the top five in the world by trading volume; cotton, sugar and natural rubber ranked the top three (Table 3.4). In 2011, the agricultural commodity futures trading accounted for 44.44 percent of the national futures trading volume and 28.18 percent of national futures trading value.
Table 3.4
Global ranking of agricultural commodity futures by trading volume

Source: FIA (www.futuresindustry.org)
China had three metals futures ranked among the top ten in the world by trading volume in 2011 (Table 3.5). The trading volume of metals futures accounted for 19.30 percent of national futures trading volume and 19.76 percent of national futures trading value. China’s energy and chemical futures accounted for 31.47 percent of the national futures trading volume and 20.23 percent of the national futures trading value. 2011 was the second trading year of China’s stock index futures. Although their trading volume was only 4.78 percent of the national futures trading volume, their trading value reached RMB 43.77 trillion Yuan, about one-third of the national futures trading value. In 2011, 163 Chinese futures firms made commission of RMB 7.422 billion Yuan, and the total profit was only RMB 2.242 billion Yuan. However, the three futures exchanges made commission of more than RMB 8 billion Yuan. In China, profits tend to flow to exchanges rather than brokerage firms. This may not benefit the developing brokerage business.
Table 3.5
Global ranking of metals futures products by trading volume

Source: FIA (www.futuresindustry.org)
Correlations between futures products and between futures markets
By studying price correlations between 18 domestic futures products from 5 January 2009 to 15 June 2011, it can be seen that there were positive price correlations between the futures products (Tables 3.6, 3.7 and 3.8). This explains the phenomenon that all prices of futures products often changed in the same direction, or went up and down together. The price correlation coefficients between agricultural commodities were over 0.90, which indicates strong price correlations between them. It is somewhat surprising to find that a chemical product, natural rubber, was highly correlated with agricultural products and metals as well as gold, while the correlation of another important futures product, copper, with agricultural commodities was not as strong as for natural rubber.
Table 3.6
The matrix of price correlation coefficients between futures products (I)

RBD, refined, bleached and deodorized; PTA pure terephthalic acid
Source: Based on the data from 5 January 2009 to 15 June 2011 of DCE, ZCE and SHFE
Table 3.7
The matrix of price correlation coefficients between futures products (II)

GMO, genetically modified; RBD, refined, bleached and deodorized; PTA pure terephthalic acid
Source: Based on the data from 5 January 2009 to 15 June 2011 of DCE, ZCE and SHFE
Table 3.8
The matrix of price correlation coefficients between futures products (III)

GMO, genetically modified; RBD, refined, bleached and deodorized; PTA pure terephthalic acid
Source : Based on the data from 5 January 2009 to 15 June 2011 of DCE, ZCE and SHFE
In China’s futures markets, it is said that zinc price always follows copper price. Their price correlation coefficient was about 0.904, and thus they were highly correlated. However, the price correlation coefficient between zinc and aluminum was as high as 0.962, much higher than that between zinc and copper. It was surprising to find that the price correlation coefficient between zinc and linear low density polyethylene (LLDPE) reached about 0.9043; even higher than that between zinc and copper. It is interesting to find that the price of LLDPE was closely related to zinc and aluminum, and the correlation coefficient between sugar and natural rubber was as high as about 0.977.
There were two triangular relations. One was between copper, aluminum and zinc; their price correlation coefficients were very high, more than 0.90 (Table 3.9). The other triangular relation was between soybean oil, rapeseed oil and palm oil; their price correlation coefficients were more than 0.980 (Table 3.10).
Table 3.9
Price correlation coefficients between copper, zinc and aluminum
| Aluminum | Zinc | |
| Copper | 0.947633 | 0.904402 |
| Aluminum | 1 | 0.962431 |
Source: Based on the data from 5 January 2009 to 15 June 2011 of DCE, ZCE and SHFE
Table 3.10
Price correlation coefficients between soybean oil, rapeseed oil and palm olein
| Rapeseed oil | RBD palm olein | |
| Soybean oil | 0.991401 | 0.990009 |
| Rapeseed oil | 1 | 0.98497 |
Source: Based on the data from 5 January 2009 to 15 June 2011 of DCE, ZCE and SHFE
Global futures markets had an obvious influence on China’s futures market, which varied with different futures products. For example, gold, copper, natural rubber and zinc had price correlation coefficients of more than 0.99 between the domestic futures markets and global futures markets. It could be argued that the prices of some domestic commodities or products were determined by the global markets. However, some commodities, such as corn, had price correlation coefficients as low as 0.2642. This indicated that the prices of the domestic futures products were not obviously affected by global futures markets. Chinese corn price was mainly determined by domestic markets. Some other futures products, such as aluminum, were correlated to the global futures market, but not as highly as gold or copper. The price correlation coefficient between domestic aluminum and London Metal Exchange (LME) aluminum was 0.643. The domestic No. 1 soybean futures’ price was obviously affected by the imported soybean price. This explains why China’s imports of soybean affected the price of the soybean futures product (Table 3.11).
Table 3.11
Some futures products’ price correlation coefficients between domestic futures markets and domestic spot markets in 2011

CBOT, The Chicago Board of Trade; COMEX, New York Commodity Exchange; ICE, International Commodities Exchange; TOCOM, Tokyo Commodity Exchange
Source: DCE, ZCE, SHFE, CBOT, TOCOM
China’s futures markets may also have a significant influence on domestic spot markets. From the market performances of 2011, it could be found that the domestic price performance of futures markets did affect the domestic price performance of spot markets. Most price correlation coefficients between domestic futures markets and spot markets were around 0.99, except for No. 1 Soybean. For some products, the influence from the domestic futures market was stronger than from the global market. For example, the sugar price correlation coefficient between the domestic sugar futures market and the domestic sugar spot market was as high as 0.92, while its price correlation coefficient between the global market and the domestic spot market was only 0.77.
Meanwhile, China’s stock index futures, CSI 300, has been closely related to the CSI 300 stock index. Their correlation coefficient reached 0.9994 in 2011. According to China’s CFMMC, in 2011 China’s futures markets had 1.4114 million investors, of whom 97.11 percent were individual investors, while institutional investors only accounted for 2.89 percent. So, China’s futures markets are dominated by individual investors. This also indicates that China’s futures markets have great potential for development and many opportunities will emerge.
T-bond derivatives market
Government bond futures can be used to hedge against risks associated with bonds transactions and to serve as a reference for pricing other financial products. China’s Treasury bond (T-Bond) futures product was first launched in 1992. In the early 1990s, when inflation and bank deposit interest rates went up, T-Bonds were often subsidized by the central government. A T-Bond’s return was, then, its coupon plus the subsidy. To protect T-Bond investors in an inflationary environment, the MOF started supporting the three-year T-Bonds issued in 1992, whose total par value was RMB 24 billion Yuan, and its futures contract was given the code name of “327.” Since China’s interest rates were not market determined, T-Bond investors were betting on government subsidy level rather than bond yield, because the subsidy determines the investors’ profit or loss. Since the MOF determined its support level according to the monthly inflation rate, a compensation or subsidy was then made for those traders betting long or short on “327” futures.
For the “327” T-Bond futures trading in 1995, the short-sellers were led by Mr Guan Jinsheng, the CEO of Wanguo Securities. Long-sellers were led by the China Economic Development Trust and Investment Corporation, which was wholly owned by the MOF. In the trading, if the price of “327” T-Bond futures was not under $17.78, Wanguo Securities would lose $718.5 million. On 23 February 1995, eight minutes before the trading day for “327” contracts closed, Wanguo Securities suddenly placed a huge sell order of 7 million contracts, which was worth US$ 16.8 billion. That caused the price to plummet from $18.12 to $17.66. Regulators later found that the order was not backed by margin deposits as required, and the T-Bond volume put up for sale was larger than that being traded. The SSE then announced that all transactions conducted in the last eight minutes on that day were invalid. In May 1995, T-Bond futures product trading was suspended. Mr Guan was later jailed and the President of the SSE, Mr Wei Wenyuan, resigned.
After 17 years, China had about RMB 6.5 trillion Yuan ($1.03 trillion) worth of bonds outstanding by December 2011, 60 times the bond value issued through 1995. The liquidity of China’s bond market is high, while pricing remains less than efficient due to the shortage of effective hedging tools. China needs a market to give T-Bond investors a chance to hedge transaction risks associated with those bonds. In early 2012, CFFEX issued a notice asking some firms to begin technical preparations and training to participate in T-Bond futures trading simulation. CFFEX started to undertake simulated trading of T-Bond futures among some member futures firms from February 2012, including several futures firms and securities firms as well as banks. The mock trading is based on 5-year treasury bonds with a coupon rate of 3 percent. The T-Bond futures market will be relaunched in the near future, possibly in 2013 or 2014. It is said that the new bond futures market will be aimed at institutional investors who are able to afford a high entry threshold. The margin deposit for each contract in the recent mock trading was 3 percent of bond investment value. Contracts were based on 5-year bonds, settled with outstanding bonds maturing in 3 to 7 years. It is believed that the 3 percent margin deposit set for the simulated trading would be enough to cover losses from a one-time decline of about 60 basis points for 5-year bond yields.
However, the trading simulation did not seem to be satisfactory. Some participants complained of a complex application process and small trading volumes. In fact, many investors would like to hold T-bonds to maturity. Since the state-owned banks are risk-averse, they prefer to deposit T-Bonds in the central bank as reserve funds. Banks may hedge to preserve value on a portion of T-Bonds. But it is unrealistic for them to take out a large portion for trading. In addition, it is believed that the T-Bond market could be a means of driving interest rate reform. For example, in 1976, America introduced the world’s first government bond futures contract, which contributed to successfully reforming interest rates in 1982. In 1985, Japan introduced its first government bond futures contracts, which contributed to finishing its interest rate reform between 1992 and 1993. It would be meaningful if China could use its T-Bond futures market to support liberation of Chinese interest rates; China could finish market reform of interest rates in 8 years. Future demand for bond futures is expected to be strong because they would provide investors with a powerful hedging instrument and, crucially, a means to express bearish views on the market.
China’s warrant market
The development of China’s warrant market can be divided into two periods. The first period was from 1992 to 1996; and the second was from 2005 to 2011. There was a blank period from 1996 to 2005, during which no warrants existed in China’s stock exchanges.
China’s warrant market can be traced back as early as 1992. On 8 June 1992, the listed company Feilo (600654: SSE) introduced the first warrant in mainland China. On 30 October 1992, another listed company, Shenzhen Baoan (000009: SZSE), issued the first mid-term (1 year) warrant, named the Baoan 93 warrant. The total issued quantity was 26.4 million. Its price was pushed from RMB 4 Yuan to more than RMB 20 Yuan, and even had a record 637 percent increase for 1 day. China’s warrant market had been a large market. However, from June 1996, due to active speculations, it was suspended. The first period was finished. Warrants were relaunched in 2005. After the non-tradable share reform, on 22 August 2005, the first warrant of the second period, Baosteel JTB1 (code: 580000), was listed on SSE. It comprised 388 million call warrants. The exercise price of the call warrants was RMB 4.50, and the duration was 378 days, from 18 August 2005 to 30 August 2006. Trading of Baosteel Warrants adopted T + 0 trading mode, and the warrants purchased could be sold on the same day. According to the “Provisional Measures on Administration of Warrant Business of SSE”, the SSE member securities companies authorized by the SSE could buy and sell warrants for self-operation or as agents of investors. The declared amount of single purchase or sale of warrants should be no more than 1 million. The minimum change unit of declared price was RMB 0.001 Yuan. The declared amount of warrant purchase should be an integer multiple of 100. Based on the classical theoretical formula, the BS model, SSE gave a reference opening price, RMB 0.688 Yuan. As the first warrant in the “A-share” market after the non-tradable share reform and 9 years’ suspension of issuing warrants, Baosteel JTB1 became the favorite of the speculators. Its opening price was RMB 1.263 Yuan. An upward limit was reached right at opening. Its price jumped to RMB 2.088 Yuan in the following 2 trading days, 203.5 percent up from the opening price on the listing date. On 23 August 2006, the Baosteel warrant expired. On the last trading day, its price fell by 85.78 percent with a turnover rate of 1164.77 percent. In the last trading hour its price declined by 83 percent. During the year’s span, or 243 trading days, the warrant’s highest price was RMB 2.38 Yuan, while the lowest price was only RMB 0.022 Yuan. The largest daily surge was 46.54 percent and the largest daily decrease was 85.78 percent. The total value was RMB 178.8 billion Yuan, a daily value of RMB 700 billion Yuan on average. On 16 November 2005, its trading value of RMB 4.171 billion Yuan was even more than the total trading value of SZSE on that day, which was RMB 3.316 billion Yuan. From 2005, nearly 30 warrants were issued in stock exchanges. As of January 2007, according to Goldman Sachs, China’s warrant market is the biggest in the world in terms of annual trading volume, surpassing that of Hong Kong. It could be argued that China’s warrant market was once ruled by speculators, who inflated the volume of turnover to about $250 billion in 2006, more than Hong Kong’s $230 billion.
However, the speculations caused the warrant market to decline. In 2009, there was only one warrant, Changhong CWB1, whose life was from 19 August 2009 to 18 August 2011. Its quantity was 573 million. On 11 August 2011, Changhong CWB1 saw its last trading day. During its life, some investors made 700 times return in one day by speculating on Changhong CWB1. Since 12 August 2011, there have been no warrants in China’s stock exchanges. This is the second blank period without warrants in mainland China.
The two failed attempts to develop a warrant market indicate that there may be some problems in the market mechanism. Fan and Yuan (2011) found that trading mechanism constraints in China’s securities market prevent rational investors from driving the prices of the call warrants to a reasonable level. The mechanism problem was also shown by the case of the warrant of Salt Lake Potash (000792: SZSE); when it expired, its price did not go to zero. The active speculations may result from China’s unique “T + 0” settlement rule, which caused high trading volume and persistent mispricing in the Chinese warrant market. Furthermore, the poor performance of brokerage business in other products trading may contribute to speculation on warrants. In 2006, the commissions that brokers and securities firms earned from warrant trading totaled RMB 3.6 billion Yuan, which was about one-quarter of their total securities turnover and made them rely mainly on trade commissions. Thus, they may drive warrant trading and speculations.
In addition, China has a bond forward market. In 2011, 436 deals of bond forward were finished. The total transaction value was about RMB 103 billion Yuan, decreased by 67.64 percent. Among the transactions, 63.5 percent were policy financial bonds.
Interest rate (IR) derivatives market
Interest rate (IR) derivatives are often used to hedge future uncertainty of market interest rate movements, which may negatively impact companies’ future cash flows. In 2007 Shanghai introduced the Shanghai Interbank Offering Rate, or SHIBOR rate, which is an important step in liberalizing interest rates in China’s wholesale banking industry by providing large institutions with a mechanism to use a market-driven interest rate in the interbank market. Since then, IR products have been traded in China’s over-the-counter derivatives market, including IR swaps and forward rate agreements. In 2011, the total trading volume of IR derivatives in the interbank market reached RMB 2.8 trillion, up 52.8 percent year-on-year. The introduction of IR options has been considered. In 2006, China launched an IR swap market, a venue for investors to hedge risks associated with bonds and loans. However, due to its more complicated nature, the IR swap market remains small in scale and is often victim to rampant speculation. From 2009, IR swaps showed explosive growth. In 2011, the market value of IR swaps reached RMB 2.68 trillion Yuan, much more than the RMB 1.0423 trillion Yuan of 2010. Seventy-eight percent of IR swaps had a term of less than 1 year. IR derivatives would develop further if IR liberation were further improved.
Foreign exchange derivatives market
RMB swaps, forwards and options
China’s foreign exchange derivatives include currency swaps, currency forwards and currency options. The purpose of foreign exchange derivatives is to hedge exchange rate fluctuations or currency swings. Since China changed to a floating exchange rate system for its currency from 2010, foreign exchange derivatives have become increasingly important in China. By the end of 2011, there were 318 spot market members, 73 forward market members, 71 swap market members, 27 option market members, 29 spot market makers, and 20 forward market makers.
In the foreign exchange derivatives market, the total RMB foreign exchange swap transactions reached about $1.77 trillion in 2011, increased by 38 percent from 2010. Of these transactions, 57.7 percent were overnight swaps. The transactions of RMB forward contracts were $214.6 billion, increased by 556.8 percent. According to PBOC, China had signed currency swap contracts worth 1.3 trillion Yuan with 14 countries and regions by the end of 2011. Since March 2011, SAFE has allowed Chinese banks to trade currency swap for corporate clients, extending the use of the financial derivative beyond the interbank market. This will support Chinese cross-border investments and trade.
A currency forward contract is an obligation to buy or sell a specific currency on a future date for a fixed price. Chinese currency forwards have been developed since 1997, when BOC was allowed to offer RMB forwards as part of a pilot scheme. Then the pilot was extended to ABC and CCB in 2003. Only a small number of banks were able to offer RMB forwards. For the past several years, appreciation, and expectation of appreciation, of the RMB against the US dollar has caused a surge in trading in RMB forwards. RMB short-term forwards, from 1 to 3 months, have overtaken the 1-year contract as the most actively traded tenors.
Non-deliverable forwards, known as NDFs, allow market participants to hedge exposure or speculate on a move in a currency where local authorities limit such activity. NDFs work like conventional forwards but they are settled offshore, typically in US dollars. So, they are popular in China, where there are restrictions on transferring the local currency abroad. As a reflection of the market consensus on the future of the RMB/dollar exchange rate, NDF prices are watched by investors and policymakers alike. Many banks in China, such as BOC and ICBC, are developing NDF-related wealth management products. There is no definitive source of data on the size of the RMB/dollar NDF market operating through privately negotiated deals. It is estimated that average daily volumes are between $3 billion and $5 billion.
Another foreign exchange derivative is currency options. Since April 2011, RMB foreign-exchange options are allowed in mainland China. Banks have been allowed to trade options among themselves and to sell them to customers. Businesses are allowed to buy options from banks, but not to sell them unless they are trying to exit from an option bought earlier. Some banks, such as ICBC and CCB, have launched option products. The ICBC RMB/FX (foreign exchange) option is a simple European option. There are two types of options available for customers: FX call option and FX put option. CCB has personal foreign exchange options, which are traded over the counter. CCB offers European options, whose trading is limited to options on the exchange rates between the US dollar and each of the other currencies. Two-week, 1-month, and 3-month maturities are available. Although the initial trading is thin, this is an important event. With the continuing evolution of the RMB as a more global and, indeed, volatile currency, it has significant implications for China’s capital account.
Market-maker categories
To further develop China’s foreign exchange market and increasing liquidity in the interbank foreign exchange market, in 2011 SAFE repealed its 2005 Tentative Guidelines for Market-makers on the Interbank Foreign Exchange Market and issued Guidelines for Market-makers in the Inter-bank Foreign Exchange Market, which introduced new market-maker categories to China’s interbank foreign exchange market and was related to market-makers of RMB/foreign exchange trades, as opposed to foreign exchange/foreign exchange trades, in the interbank foreign exchange market. “Market-makers of the inter-bank foreign exchange market” refers to members of the interbank foreign exchange market verified by SAFE to bear the obligations of providing buying and selling prices to market members in the course of RMB and foreign currency transactions carried out in the interbank foreign exchange market.
Market-makers are categorized into three categories: spot trading market-makers, forward/swap trading market-makers and general market-makers. A general market-maker can conduct all market-making activities carried out by spot and forward/swap trading market-makers. Meanwhile, a general market-maker enjoys more rights compared with spot and forward/swap trading market-makers.
The Guidelines introduced a new category of “trial” market-makers. Only banking financial institutions can be trial market-makers. The threshold for trial market-makers is much lower than that for formal market-makers. For example, a trial market-maker applicant is not required to have a minimum ranking within the markets. However, to be a formal market-maker, an institution must be within the top 30 in terms of volume of RMB/foreign exchange trades in the interbank market. There are two categories of trial market-makers: spot trading market-makers and forward/swap trading market-markers. Trial market-makers are permitted to provide buy and sell prices in the interbank foreign exchange market and can, in practice, conduct market-making activities. But they are not market-makers, and therefore do not enjoy the same rights and are not subject to the same obligations as market-makers. SAFE has announced a list of trial market-makers and formal market-makers, including seven trial spot trading market-makers, 12 trial forward/swap trading market-makers, 26 spot trading market-makers and 18 forward/swap trading market-makers. No firm has yet been approved as a general market-maker.
Certain qualification requirements are applied to each category of market-maker. For example, to be a market-maker, the applicant must have been a trial market-maker for at least 2 years; while, to be a general market-maker, the applicant must have been a spot trading market-maker for at least 5 years and a forward/swap trading market-maker for at least 1 year. In certain circumstances, a trial market-maker or market-marker’s qualification can be withdrawn or downgraded by SAFE. If a general market-maker has not met the applicable ongoing compliance requirements in 2 of the last 3 years, it will be reduced to a spot trading market-maker and/or a forward/swap trading market-maker.
Credit Default Swap (CDS) market
Credit derivatives play a significant role in distributing credit risk against broken financial agreements. In November 2010, China launched a Chinese version of CDS, Credit Risk Mitigation (CRM). It had two products, CRMA (Credit Risk Mitigation Agreement) and Credit Risk Mitigation Warrant (CRMW). However, market demand was quite weak. For example, 6 months later, by 12 May 2011, only 23 deals of CRMA with trading value of RMB 1.99 billion Yuan had been reached. Compared with the domestic credit debt market of more than RMB 50 trillion Yuan, the trading volume of CRMA was quite small. It was also tiny compared with the thousands of billions of Yuan assets in Chinese banking. One reason was that the global crisis made CSRC and China Insurance Regulatory Commission (CIRC) cautious about CRM products, and the two products were not well recognized by the authorities. Another reason was that pricing and rating those two CRM products was difficult, since there had as yet been no default in China’s debt market and there was no benchmark or reference for their pricing. Meanwhile, under non-market interest rate conditions, returns of the products were hard to measure; then their rating was somewhat difficult. In addition, the CRM products mainly targeted large state-owned financial institutions, which did not have an appetite for the products. Compared with other derivatives, the products were not attractive, with a risk rated ratio of no more than 8 percent high. There is a long way to go in developing China’s CDS market.
Local derivatives markets
Different derivatives markets
Since 2009, supported by local governments, local derivatives markets have developed fast in China. One kind of market is cultural artwork exchanges. More than 20 cultural art exchanges in different regions have been launched. In January 2011, Tianjin Cultural Artwork Exchange was opened for art shares. This is a pilot art market to allow small investors to buy shares in the ownership of art works previously traded only in auction houses by the super-rich. It is considered a financial innovation by the Tianjin municipal government. Shares in two traditional Chinese paintings were offered for sale on the market: one was valued at 6 million Yuan and the other at 5 million Yuan. Ownership was divided into 6 million shares for the first and 5 million for the other. Investors were very full of passion for trading. According to the market’s rules, an investor who buys up to 67 percent of an artwork can require the purchase of the remaining shares from other investors. Other regions quickly followed Tianjin Cultural Artwork Exchange, and many similar exchanges were developed.
Although there were many cultural art exchanges in different regions, only four of them were in trading: Tianjin Cultural Art Exchanges, Zhengzhou Cultural Art Exchanges, Chengdu Cultural Art Exchanges, and Hunan Cultural Art Exchanges. They had two operation models, for either art shares trading or art property trading. The first model is mainly used by private exchanges, while the later model was mainly taken by state-owned exchanges. In operation, many speculations emerged. For example, in March 2011, the art shares’ price of Tianjin Cultural Art Exchanges surged by 1800 percent, which raised the possibility that the market was full of speculation as gambling while the risk control mechanism was not well established. In Zhengzhou Cultural Art Exchanges, illegal antique trading was found. These facts suggest that a supervision policy and mechanism should be established.
Underground derivatives markets and cleaning up policy
Since 2011, different kinds of exchanges, such as cultural art exchanges, gold exchanges, metal exchanges, wine exchanges, agricultural commodities exchanges, etc., mushroomed nationwide. In Zhejiang Province, there were at least 58 exchanges. About 300 exchanges were established nationwide which were not approved by the authorities and hence illegal. Among those exchanges, gold exchanges and cultural art exchanges were the most popular. Because spot prices of the precious metal had soared to a record high, gold exchanges had emerged across China. In the exchanges, irregular activities and evidence of illegality were causing risks to emerge. Many of those exchanges were full of speculations and were not well managed; in particular, a risk management mechanism was lacking. For example, in Hangzhou city of Zhejiang Province, an illegal gold futures trading related to Zhejiang Century Gold Corporation involved RMB 60 billion Yuan. In Shanghai, a company named CCBOT (Shanghai Agricultural Products E-Business Co., Ltd.), which was quite similar to the American Chicago Board of Trade (CBOT) for futures trading in agricultural commodities, was reported by the China Business News on 9 July 2010 for manipulating the Pu-erh tea price.
To avoid financial risk or crisis caused by the exchanges, the central government decided to clean up the exchanges. On 11 November 2011, the State Council issued Decision of the State Council on Straightening out and Rectifying Various Types of Trading Venues to Effectively Prevent Financial Risks (No. 38 [2011] of the State Council), which is often called the No. 38 document, to clean up illegal exchanges nationwide. The deadline to finish the clean-up work was 30 June 2012. In December 2011, five regulators, including PBOC, CSRC, CBRC, the State Administration for Industry and Commerce (SAIC) and the Ministry of Public Security, jointly issued the notice, which said that no local authority, institution or individual was allowed to set up a gold exchange. Shanghai Gold Exchange and the Shanghai Futures Exchange were enough to meet domestic investor demand for spot gold and futures gold trading. Other gold exchanges were to be banned. Local gold exchanges would be altered or closed, banks were asked to stop providing them with clearing services, and some people would be faced with police investigation. Hunan Weicai Noble Metal Exchange, which was for illegal gold trading, became the first exchange to be closed, with 37,000 investors involved. After that, about 100 exchanges trading for gold claimed to suspend or exit gold trading.
However, it is somewhat hard to really implement the No. 38 documents. Local exchanges often involve local interests or government. In July 2012, a research institute, PPI, carried out a sampling survey and found that about 30 percent of the 46 commodity exchanges were still in operation, including ten exchanges switched to spot markets; and only ten exchanges were closed. By the end of October 2012, it was reported that all cultural art exchanges had finished their cleaning up work except Tianjin Cultural Art Exchange.
The widespread and fast development of kinds of exchanges indicates strong demand, for the current exchanges or markets, as well as varieties of derivatives, cannot well meet investors’ demands. One side of solving this problem is to develop futures and derivatives markets well; the other side is to explore and develop a market-oriented supervision and management mechanism. Meanwhile, the central government may consider developing a centralized or national cultural art exchange to meet the demand and the developing cultural art industry. Related policy, regulation and supervision should be established.
China’s supervision of financial derivatives markets
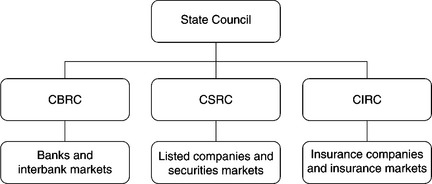
China’s derivatives markets have different regulators according to different financial instruments, such as CBRC and CSRC. CBRC mainly supervises banking-related derivatives markets (Figure 3.4). It focuses on regulation to prevent excessive speculation of derivatives. For example, it limits the volume of speculative derivatives trading in an effort to prevent market price distortion among derivatives and to reduce the risk of a speculative bubble.
In January 2011, China updated its regulatory approach to the derivatives market. It tried to lower access barriers to trading products while clamping down on speculative activities. CBRC has reduced the entry requirements for investors involving hedging transactions. It intends to encourage financial innovation in hedging products, and provides companies with more options to mitigate financial and credit risks encountered in their business operations. Rather than applying the same strict set of rules to hedging companies and speculative companies, CBRC now requires those investors trading hedging derivatives to obtain only a Basic Qualification, the regulator’s most general classification necessary for trading. In its “Measures on the Administration of Derivatives Transactions,” the CBRC established a tiered system in which financial institutions with derivatives trading are classified by trading purpose and regulated separately. According to the “Revised Measures on Administration of Derivatives Business of Banking Financial Institutions” issued by CBRC, any banking or financial institution engaged in derivatives speculation is required to have a market risk reserve no more than 3 percent of the company’s core capital. The revised measures disproportionately impact foreign firms in China, which hold limited core capital on the mainland and thus need to raise additional capital to meet risk reserve requirements.
CSRC focuses on supervising futures markets. Futures brokerage companies are the leading intermediaries in the futures market. To detect margin safety risks and report to regulatory authorities in a timely manner, and to provide investors with transaction clearing information inquiry, China Futures Margin Monitoring Center Co., Ltd (CFMMC) was established upon approval by CSRC in 2006. It is a monitoring and early warning mechanism for futures margins, and helps in managing futures investor protection funds and engaging in the risk disposal of futures brokerage firms. Investors could log into the system to check the margins and risk after the market closes. Margins and risk information would be shown when investors log into the trading platform. On 12 January 2009, CFMMC inaugurated its Shanghai headquarters after obtaining approval from CSRC. The new headquarters is mainly responsible for the construction of the supervision system of the futures market and the monitoring and analysis of the futures trading in the region. As an important infrastructure for the development and monitoring of the futures market, the monitoring system is expected to enhance the government’s supervision of the futures trading market and combat illegal trading activities in futures.
Insurance companies are important investors for financial markets. But, for a long time, they were restricted to investing in derivatives markets. On 12 October 2012, China Insurance Regulatory Commission (CIRC) issued the Interim Measures on Insurance Funds’ Participation in Financial Derivatives Trading, which allows Chinese insurance institutions to enter into domestic derivatives transactions to trade forwards, swaps, FX forwards, FX swaps, stock index futures, futures and other derivatives for hedging purposes. The Interim Measures set out the qualification criteria and risk management requirements for the insurance institutions which wish to engage in financial derivatives trading. The insurance institutions are asked to periodically report to CIRC for their derivatives transactions. Also in October 2012, CIRC issued Implementing Rules of the Interim Measures on Overseas Investments by Insurance Companies, in which is specified a list of 45 countries and regions, including 25 developed economies and 20 emerging economies, where domestic insurance companies may make overseas investments.
The problems of developing China’s derivatives markets
Despite being the world’s second-largest economy, China has only 30 futures products, while America has nearly 400. China’s economic development requires more derivatives products and financial innovations. It can be argued that interest rate futures and oil futures should be the priorities, since China has such a large bond market and demand for oil.
A critical problem in the current derivatives market is that regulation is complicated and thus the transaction cost is expensive. Derivatives are financial products involving underlying assets, including commodities, foreign exchange rates, interest rates, etc., and demanded by different institutions. Different regulators have inconsistent market access criteria and approval processes for derivatives trading and financial product design. Market participants are often not notified of regulations and access criteria in a coordinated and clear manner following the launch of new products and services. Inconsistency and conflict on policy execution can led to confusion among companies regarding compliance issues on trading derivatives and designing products, which may hinder financial innovation and the development of China’s derivatives market. For example, companies trading derivatives in China may involve regulators such as PBOC, CBRC, CSRC, CIRC, SAFE and National Association of Financial Market Institutional Investors (NAFMII). If an insurance company wants to trade foreign currency derivatives it needs approval from CIRC, SAFE, PBOC, and CBRC. Although PBOC and CBRC oversee all activities in the derivatives market, other regulators may hold jurisdiction according to the type of trading company and the type of underlying asset. It is critical to eliminate overlap among regulatory bodies and clarify agency jurisdiction. Meanwhile, a unified regulator should be established to supervise and regulate China’s derivatives market, such as unifying approval process criteria for market participation and activities.
Another problem in China’s futures market is the great shortage of qualified professionals. According to China Futures Associate, by 31 December 2010, there were 163 futures companies with a total of 24,064 employees. Only 22,993 of them had the required qualifications. In futures companies, their staff mobility was quite high. In 2010, the mobility of senior managers, operation department managers, middle senior managers, and ordinary employees was 9.27 percent, 11.01 percent, 16.64 percent, and 16.47 percent, respectively. Among the employees leaving their original futures companies, 38.06 percent of them switched to other futures companies; 23.18 percent went to the securities sector; 10.39 percent worked for fund management; 8.22 percent looked for jobs in spot markets; 7.23 percent headed to banking; and 12.93 percent went to other industries. The shortage of qualified professionals has been a key obstacle in developing China’s derivatives markets.
Summary
As the world’s second-largest economy, China has an underdeveloped derivatives market. It is individual investors who dominate the market. China does not have enough qualified institutional investors or enough derivative products. Its existing credit derivative products are too limited for debt issuers to hedge against different levels of credit risks from borrowers. Without a fully liberalized interest rate to indicate borrowers’ creditworthiness, differences in credit risk of underlying financial obligations are not clear. China should further develop futures markets and more derivatives to meet demands from all kinds of investors. Although China has dozens of regional commodity exchanges, the commodity derivatives markets are separated and lack a single onshore commodity exchange with indices.
Supervision of the derivatives markets is hard. In China, derivatives markets have different regulators, while the nature of capital markets is very active, liquid and correlated. It is necessary to have one centralized and unified supervision model for China’s derivatives markets. The current regulatory system is complex, and includes numerous bodies with overlapping jurisdictional control. The supervision is somewhat weak and there is no well-developed legal framework. China’s derivatives markets are just at the beginning stage.