
Chapter 11. Network and Host Telemetry
This chapter covers different network and host security telemetry solutions. Network telemetry and logs from network infrastructure devices such as firewalls, routers, and switches can prove useful when you’re proactively detecting or responding to a security incident. Logs from user endpoints not only can help you for attribution if they are part of a malicious activity, but also for victim identification.
“Do I Know This Already?” Quiz
The “Do I Know This Already?” quiz helps you identify your strengths and deficiencies in this chapter’s topics. The ten-question quiz, derived from the major sections in the “Foundation Topics” portion of the chapter, helps you determine how to spend your limited study time. You can find the answers in Appendix A Answers to the “Do I Know This Already?” Quizzes and Q&A Questions.
Table 11-1 outlines the major topics discussed in this chapter and the “Do I Know This Already?” quiz questions that correspond to those topics.

1. Why you should enable Network Time Protocol (NTP) when you collect logs from network devices?
a. To make sure that network and server logs are collected faster.
b. Syslog data is useless if it shows the wrong date and time. Using NTP ensures that the correct time is set and that all devices within the network are synchronized.
c. By using NTP, network devices can record the time for certificate management.
d. NTP is not supported when collecting logs from network infrastructure devices.
2. Cisco ASA supports which of the following types of logging? (Select all that apply.)
a. Console logging
b. Terminal logging
c. ASDM logging
d. Email logging
e. External syslog server logging
3. Which of the following are examples of scalable, commercial, and open source log-collection and -analysis platforms? (Select all that apply.)
a. Splunk
b. Spark
c. Graylog
d. Elasticsearch, Logstash, and Kibana (ELK) Stack
4. Host-based firewalls are often referred to as which of the following?
a. Next-generation firewalls
b. Personal firewalls
c. Host-based intrusion detection systems
d. Antivirus software
5. What are some of the characteristics of next-generation firewall and next-generation IPS logging capabilities? (Select all that apply.)
a. With next-generation firewalls, you can only monitor malware activity and not access control policies.
b. With next-generation firewalls, you can monitor events for traffic that does not conform with your access control policies. Access control policies allow you to specify, inspect, and log the traffic that can traverse your network. An access control policy determines how the system handles traffic on your network.
c. Next-generation firewalls and next-generation IPSs help you identify and mitigate the effects of malware. The FMC file control, network file trajectory, and Advanced Malware Protection (AMP) can detect, track, capture, analyze, log, and optionally block the transmission of files, including malware files and nested files inside archive files.
d. AMP is supported by Cisco next-generation firewalls, but not by IPS devices.
6. Which of the following are characteristics of next-generation firewalls and the Cisco Firepower Management Center (FMC) in relation to incident management? (Select all that apply.)
a. They provide a list of separate things, such as hosts, applications, email addresses, and services, that are authorized to be installed or active on a system in accordance with a predetermined baseline.
b. These platforms support an incident lifecycle, allowing you to change an incident’s status as you progress through your response to an attack.
c. You can create your own event classifications and then apply them in a way that best describes the vulnerabilities on your network.
d. You cannot create your own event classifications and then apply them in a way that best describes the vulnerabilities on your network
7. Which of the following are true regarding full packet capture?
a. Full packet capture demands great system resources and engineering efforts, not only to collect the data and store it, but also to be able to analyze it. That is why, in many cases, it is better to obtain network metadata by using NetFlow.
b. Full packet captures can be discarded within seconds of being collected because they are not needed for forensic activities.
c. NetFlow and full packet captures serve the same purpose.
d. Most sniffers do not support collecting broadcast and multicast traffic.
8. Which of the following are some useful attributes you should seek to collect from endpoints? (Select all that apply.)
a. IP address of the endpoint or DNS hostname
b. Application logs
c. Processes running on the machine
d. NetFlow data
9. SIEM solutions can collect logs from popular host security products, including which of the following?
a. Antivirus or antimalware applications
b. Cloud logs
c. NetFlow data
d. Personal firewalls
10. Which of the following are some useful reports you can collect from Cisco ISE related to endpoints? (Select all that apply.)
a. Web Server Log reports
b. Top Application reports
c. RADIUS Authentication reports
d. Administrator Login reports
Foundation Topics
Network Telemetry
The network can provide deep insights and the data to determine whether a cyber security incident has happened. This section covers the various types of telemetry features available in the network and how to collect such data. Even a small network can generate a large amount of data. That’s why it is also important to have the proper tools to be able to analyze such data.
Network Infrastructure Logs
Logs from network devices such as firewalls, routers, and switches can prove useful when you’re proactively detecting or responding to a security incident. For example, brute-force attacks against a router, switch, or firewall can be detected by system log (syslog) messages that could reveal the suspicious activity. Log collectors often offer correlation functionality to help identify compromises by correlating syslog events.
Syslog messages from transit network devices can provide insight into and context for security events that might not be available from other sources. Syslog messages definitely help to determine the validity and extent of an incident. They can be used to understand communication relationships, timing, and, in some cases, the attacker’s motives and tools. These events should be considered complementary and used in conjunction with other forms of network monitoring already be in place.
Table 11-2 summarizes the different severity logging levels in Cisco ASA, Cisco IOS, Cisco IOS-XE, Cisco IOS-XR, and Cisco NX-OS devices.

Each severity level not only displays the events for that level but also shows the messages from the lower severity levels. For example, if logging is enabled for debugging (level 7), the router, switch, or firewall also logs levels 0 through 6 events.
Most Cisco infrastructure devices use syslog to manage system logs and alerts. In a Cisco router or switch, logging can be done to the device console or internal buffer, or the device can be configured to send the log messages to an external syslog server for storing. Logging to a syslog server is recommended because the storage size of a syslog server does not depend on the router’s resources and is limited only by the amount of disk space available on the external syslog server. This option is not enabled by default in Cisco devices. In Figure 11-1, a router (R1) is configured with syslog and is sending all logs to a syslog server with the IP address of 10.8.1.10 in the management network.

Network Time Protocol and Why It Is Important
Before you configure a Cisco device to send syslog messages to a syslog server, you need to make sure the router, switch, or firewall is configured with the right date, time, and time zone. Syslog data is useless if it shows the wrong date and time. As a best practice, you should configure all network devices to use Network Time Protocol (NTP). Using NTP ensures that the correct time is set and that all devices within the network are synchronized.
In Example 11-1, the router (R1) is configured to perform DNS resolution to the Cisco OpenDNS free DNS server 208.67.222.222 with the ip name-server command. Domain lookup is enabled with the ip domain-lookup command, and then finally the router is configured as an NTP client and synchronized with the NTP server 0.north-america.pool.ntp.org with the ntp server command.
Example 11-1 Configuring NTP in a Cisco Router
R1#configure terminal
Enter configuration commands, one per line. End with CNTL/Z.
R1(config)#ip name-server 208.67.222.222
R1(config)#ip domain-lookup
R1(config)#ntp server 0.north-america.pool.ntp.org
The pool.ntp.org project is a free and scalable virtual cluster of NTP servers deployed around the world that provide NTP services for millions of clients. You can obtain more information about these NTP servers at http://www.pool.ntp.org.
You can use the show ntp status command to display the status of the NTP service in the router, as demonstrated in Example 11-2.
Example 11-2 show ntp status Command Output
R1#show ntp status
Clock is synchronized, stratum 3, reference is 173.230.149.23
nominal freq is 1000.0003 Hz, actual freq is 1000.1594 Hz, precision is 2**19
ntp uptime is 131100 (1/100 of seconds), resolution is 1000
reference time is DB75E178.34FE24FB (23:55:36.207 UTC Sat Sep 3 2016)
clock offset is -1.8226 msec, root delay is 70.89 msec
root dispersion is 220.49 msec, peer dispersion is 187.53 msec
loopfilter state is 'CTRL' (Normal Controlled Loop), drift is -0.000159112 s/s
system poll interval is 64, last update was 6 sec ago.
You can use the show ntp associations command to display the NTP associations to active NTP servers, as demonstrated in Example 11-3.
Example 11-3 show ntp associations Command Output
R1#show ntp associations
address ref clock st when poll reach delay offset disp
*~173.230.149.23 127.67.113.92 2 11 64 1 69.829 -1.822 187.53
* sys.peer, # selected, + candidate, - outlyer, x falseticker, ~ configured
To verify the time in the router, use the show clock details command, as demonstrated in Example 11-4.
Example 11-4 show clock details Command Output
R1#show clock detail
23:55:53.416 UTC Sat Sep 3 2016
Time source is NTP
In Example 11-4, you can see that the time source is NTP.
Configuring Syslog in a Cisco Router or Switch
Example 11-5 demonstrates how to configure syslog in a Cisco router or switch running Cisco IOS or Cisco IOS-XE software.
Example 11-5 Configuring NTP in a Cisco Router
R1#configure terminal
Enter configuration commands, one per line. End with CNTL/Z.
R1(config)#logging host 10.8.1.10
R1(config)#logging trap warnings
R1(config)#service timestamps debug datetime msec localtime show-timezone
R1(config)#service timestamps log datetime msec localtime show-timezone
In Example 11-5, R1 is configured to send syslog messages to the syslog server with the IP address 10.8.1.10, as you saw previously in the topology shown in Figure 11-1. The logging trap command specifies the maximum severity level of the logs sent to the syslog server. The default value is informational and lower. The service timestamps command instructs the system to timestamp syslog messages; the options for the type keyword are debug and log.
You can display statistics and high-level information about the type of logging configured in a router or switch by invoking the show log command, as demonstrated in Example 11-6.
Example 11-6 Output of the show log Command
R1#show log
Syslog logging: enabled (0 messages dropped, 3 messages rate-limited, 0 flushes, 0
overruns, xml disabled, filtering disabled)
No Active Message Discriminator.
No Inactive Message Discriminator.
Console logging: level informational, 74 messages logged, xml disabled,
filtering disabled
Monitor logging: level debugging, 0 messages logged, xml disabled,
filtering disabled
Buffer logging: level debugging, 76 messages logged, xml disabled,
filtering disabled
Exception Logging: size (8192 bytes)
Count and timestamp logging messages: disabled
Persistent logging: disabled
No active filter modules.
Trap logging: level informational, 13 message lines logged
Logging to 10.8.1.10 (udp port 514, audit disabled,
link up),
3 message lines logged,
0 message lines rate-limited,
0 message lines dropped-by-MD,
xml disabled, sequence number disabled
filtering disabled
Logging Source-Interface: VRF Name:
Log Buffer (8192 bytes):
*Mar 1 00:00:00.926: %ATA-6-DEV_FOUND: device 0x1F0
*Mar 1 00:00:10.148: %NVRAM-5-CONFIG_NVRAM_READ_OK: NVRAM configuration 'flash:/
nvram' was read from disk.
*Sep 3 22:24:51.426: %CTS-6-ENV_DATA_START_STATE: Environment Data Download in start
state
*Sep 3 22:24:51.689: %PA-3-PA_INIT_FAILED: Performance Agent failed to initialize
(Missing Data License)
The first highlighted line in Example 11-6 shows that syslog logging is enabled. The second highlighted line shows that the router is sending syslog messages to 10.8.1.10. The default syslog port in a Cisco infrastructure device is UDP port 514. You can change the port or protocol by using the logging host command with the transport and port keywords, as shown in Example 11-7.
Example 11-7 Changing the Protocol and Port Used for Syslog
logging host 10.8.1.10 transport tcp port 55
In the topology illustrated in Figure 11-1, the syslog server is a basic Ubuntu Linux server. Enabling syslog in Ubuntu is very simple. First, you edit the rsyslog.conf configuration file with your favorite editor. In Example 11-8, vim is used to edit the file.
Example 11-8 Editing the rsyslog.conf File
omar@omar:~$ sudo vim /etc/rsyslog.conf
Once you are in the file, you can uncomment the two lines shown in Example 11-9 to enable syslog in the default UDP port (514).
Example 11-9 Enabling Syslog over UDP in the rsyslog.conf File
module(load="imudp")
input(type="imudp" port="514")
Once you edit the rsyslog.conf configuration file, restart rsyslog with the sudo service rsyslog restart command. All of R1’s syslog messages can now be seen in the server under /var/log/syslog.
Traditional Firewall Logs
The Cisco ASA supports the following types of logging capabilities:
![]() Console logging
Console logging
![]() Terminal logging
Terminal logging
![]() ASDM logging
ASDM logging
![]() Email logging
Email logging
![]() External syslog server logging
External syslog server logging
![]() External SNMP server logging
External SNMP server logging
![]() Buffered logging
Buffered logging
The followings sections detail each logging type.
Console Logging
Just like Cisco IOS and IOS-XE devices, the Cisco ASA supports console logging. Console logging enables the Cisco ASA to send syslog messages to the console serial port. This method is useful for viewing specific live events during troubleshooting.
TIP
Enable console logging with caution; the serial port is only 9600 bits per second, and the syslog messages can easily overwhelm the port. If the port is already overwhelmed, access the security appliance from an alternate method, such as SSH or Telnet, and lower the console-logging severity.
Terminal Logging
Terminal logging sends syslog messages to a remote terminal monitor such as a Telnet or SSH session. This method is also useful for viewing live events during troubleshooting. It is recommended that you define an event class for terminal logging so that your session does not get overwhelmed with the logs.
ASDM Logging
You can enable the security appliance to send logs to Cisco ASDM. This feature is extremely beneficial if you use ASDM as the configuration and monitoring platform. You can specify the number of messages that can exist in the ASDM buffer. By default, ASDM shows 100 messages in the ASDM logging window. You can use the logging asdm-buffer-size command to increase this buffer to store up to 512 messages.
Email Logging
The Cisco ASA supports sending log messages directly to individual email addresses. This feature is extremely useful if you are interested in getting immediate notification when the security appliance generates a specific log message. When an interesting event occurs, the security appliance contacts the specified email server and sends an email message to the email recipient from a preconfigured email account.
Using email-based logging with a logging level of notifications or debugging may easily overwhelm an email server or the Cisco ASA.
Syslog Server Logging
Cisco ASA supports sending the event logs to one or multiple external syslog servers. Messages can be stored for use in anomaly detection or event correlation. The security appliance allows the use of both TCP and UDP protocols to communicate with a syslog server. You must define an external server to send the logs to it, as discussed later in the “Configuring Logging on the Cisco ASA” section.
SNMP Trap Logging
The Cisco ASA also supports sending the event logs to one or multiple external Simple Network Management Protocol (SNMP) servers. Messages are sent as SNMP traps for anomaly detection or event correlation.
Buffered Logging
The Cisco ASA allocates 4096 bytes of memory to store log messages in its buffer. This is the preferred method to troubleshoot an issue because it does not overwhelm the console or the terminal ports. If you are troubleshooting an issue that requires you to keep more messages than the buffer can store, you can increase the buffer size up to 1,048,576 bytes.
NOTE
The allocated memory is a circular buffer; consequently, the security appliance does not run out of memory as the older events get overwritten by newer events.
Configuring Logging on the Cisco ASA
You can configure logging in the Cisco ASA via the Adaptive Security Device Manager (ASDM) or via the command-line interface (CLI). To enable logging of system events through ASDM, go to Configuration, Device Management, Logging, Logging Setup and check the Enable Logging check box, as shown in Figure 11-2.

This option enables the security appliance to send logs to all the terminals and devices set up to receive the syslog messages.
The security appliance does not send debug messages as logs, such as debug icmp trace, to a syslog server unless you explicitly turn it on by checking the Send Debug Messages As Syslogs check box. For UDP-based syslogs, the security appliance allows logging of messages in the Cisco EMBLEM format. Many Cisco devices, including the Cisco IOS routers and Cisco Prime management server, use this format for syslogging.
Example 11-10 shows the CLI commands used to enable syslog in the Cisco ASA.
Example 11-10 Enabling Syslog in the Cisco ASA via the CLI
ASA-1#configure terminal
ASA-1(config)#logging enable
ASA-1(config)#logging debug-trace
ASA-1(config)#logging host management 10.8.1.10
ASA-1(config)#logging emblem
After the logging is enabled, ensure that the messages are timestamped before they are sent. This is extremely important because in case of a security incident, you want to use the logs generated by the security appliance to backtrace. Navigate to Configuration, Device Management, Logging, Syslog Setup and choose the Include Timestamp in Syslog option. If you prefer to use the CLI, use the logging timestamp command, as shown in Example 11-11.
Example 11-11 Enabling syslog Timestamps in the Cisco ASA via the CLI
ASA-1(config)# logging timestamp
You can use the show logging command to display the logging configuration and statistics, as shown in Example 11-12.
Example 11-12 Output of the show logging Command in the Cisco ASA
ASA1# show logging
Syslog logging: enabled
Facility: 20
Timestamp logging: disabled
Standby logging: disabled
Debug-trace logging: enabled
Console logging: disabled
Monitor logging: disabled
Buffer logging: disabled
Trap logging: level informational, facility 20, 257 messages logged
Logging to management 10.8.1.10
Permit-hostdown logging: disabled
History logging: disabled
Device ID: disabled
Mail logging: disabled
ASDM logging: disabled
Syslog in Large Scale Environments
Large organizations use more scalable and robust systems for log collection and analysis. The following are a few examples of scalable commercial and open source log-collection and -analysis platforms:
![]() Splunk
Splunk
![]() Graylog
Graylog
![]() Elasticsearch, Logstash, and Kibana (ELK) Stack
Elasticsearch, Logstash, and Kibana (ELK) Stack
Splunk
The commercial log analysis platform Splunk is very scalable. You can customize many dashboards and analytics. Many large enterprises use Splunk as their central log collection engine. There are a few options available:
![]() Splunk Light: An on-premises log search and analysis platform for small organizations.
Splunk Light: An on-premises log search and analysis platform for small organizations.
![]() Splunk Enterprise: An on-premises log search and analysis platform for large organizations. The Cisco Networks App for Splunk Enterprise includes dashboards, data models, and logic for analyzing data from Cisco IOS, IOS XE, IOS XR, and NX-OS devices using Splunk Enterprise. Splunk’s Cisco Security Suite provides a single-pane-of-glass interface that’s tailor made for your Cisco environment. Security teams can customize a full library of saved searches, reports, and dashboards to take full advantage of security-relevant data collected across Cisco ASA firewalls, Firepower Threat Defense (FTD), Cisco Web Security Appliance (WSA), Cisco Email Security Appliance (ESA), Cisco Identity Services Engine (ISE), and Cisco next-generation IPS devices.
Splunk Enterprise: An on-premises log search and analysis platform for large organizations. The Cisco Networks App for Splunk Enterprise includes dashboards, data models, and logic for analyzing data from Cisco IOS, IOS XE, IOS XR, and NX-OS devices using Splunk Enterprise. Splunk’s Cisco Security Suite provides a single-pane-of-glass interface that’s tailor made for your Cisco environment. Security teams can customize a full library of saved searches, reports, and dashboards to take full advantage of security-relevant data collected across Cisco ASA firewalls, Firepower Threat Defense (FTD), Cisco Web Security Appliance (WSA), Cisco Email Security Appliance (ESA), Cisco Identity Services Engine (ISE), and Cisco next-generation IPS devices.
![]() Splunk Cloud: A cloud service.
Splunk Cloud: A cloud service.
![]() Hunk: A Hadoop-based platform.
Hunk: A Hadoop-based platform.
Figure 11-3 shows the Cisco Security Overview dashboard that is part of the Cisco Security Suite app in Splunk Enterprise.

Figure 11-4 shows the Top Sources, Top Destinations, and Top Services widgets that are part of the Cisco Security Suite app in Splunk Enterprise. It also shows the security event statistics by source type and by hosts.

One of the capabilities of Splunk is to drill down to logs by searching source and destination IP addresses, source and destination ports, protocols, and services. Figure 11-5 shows the Firewall Event Search screen part of the Cisco Security Suite app in Splunk Enterprise.

Splunk also provides high-level dashboards that include information about top threats and other network events. Figure 11-6 shows the Cisco Security Suite – Top Threats screen, where you can see the top threats and network device source of those events.

In Splunk, you can click any of the items to drill down to each of the events. If you click the WSA events in the pie chart illustrated in Figure 11-6, the screen in Figure 11-7 is shown with the specific query/search for those events.
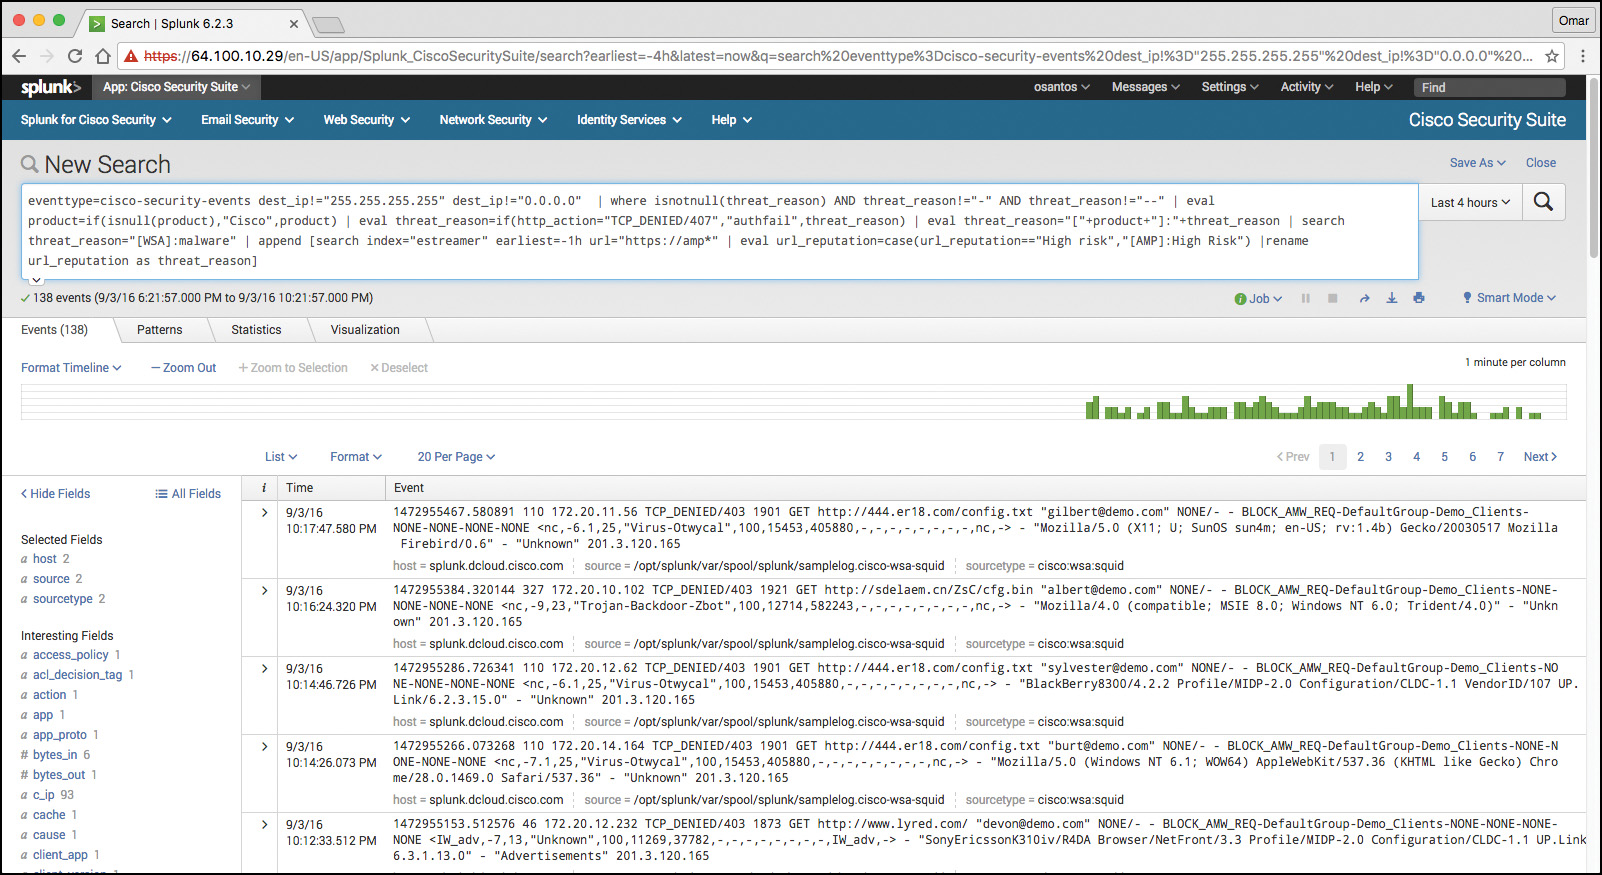
That’s one of the benefits of Splunk—being able to perform very granular and custom searches (search strings) to obtain information about network and security events. Figure 11-8 demonstrates how you can do a simple search by event type and event source. In the screen shown in Figure 11-8, the event type is cisco-security-events and the event source is set to any events by a Cisco ASA.

Graylog
Graylog is a very scalable open source analysis tool that can be used to monitor security events from firewalls, IPS devices, and other network infrastructure devices. The folks at Graylog have many different examples and prepackaged installations including, but not limited to, the following:
![]() Prepackaged virtual machine appliances
Prepackaged virtual machine appliances
![]() Installation scripts for Chef, Puppet, Ansible, and Vagrant
Installation scripts for Chef, Puppet, Ansible, and Vagrant
![]() Easy-to-install Docker containers
Easy-to-install Docker containers
![]() OpenStack images
OpenStack images
![]() Images that can run in Amazon Web Services
Images that can run in Amazon Web Services
![]() Microsoft Windows servers and Linux-based servers
Microsoft Windows servers and Linux-based servers
Graylog is fairly scalable and supports a multi-node setup. You can also use Graylog with load balancers. A typical deployment scenario when running Graylog in multiple servers is to route the logs to be sent to the Graylog servers through an IP load balancer. When you deploy a load balancer, you gain high availability and also scalability by just adding more Graylog servers/instances that can operate in parallel.
Graylog supports any syslog messages compliant with RFC 5424 and RFC 3164 and also supports TCP transport with both the octet counting and termination character methods. It also supports UDP as the transport, and it is the recommended way to send log messages in most architectures.
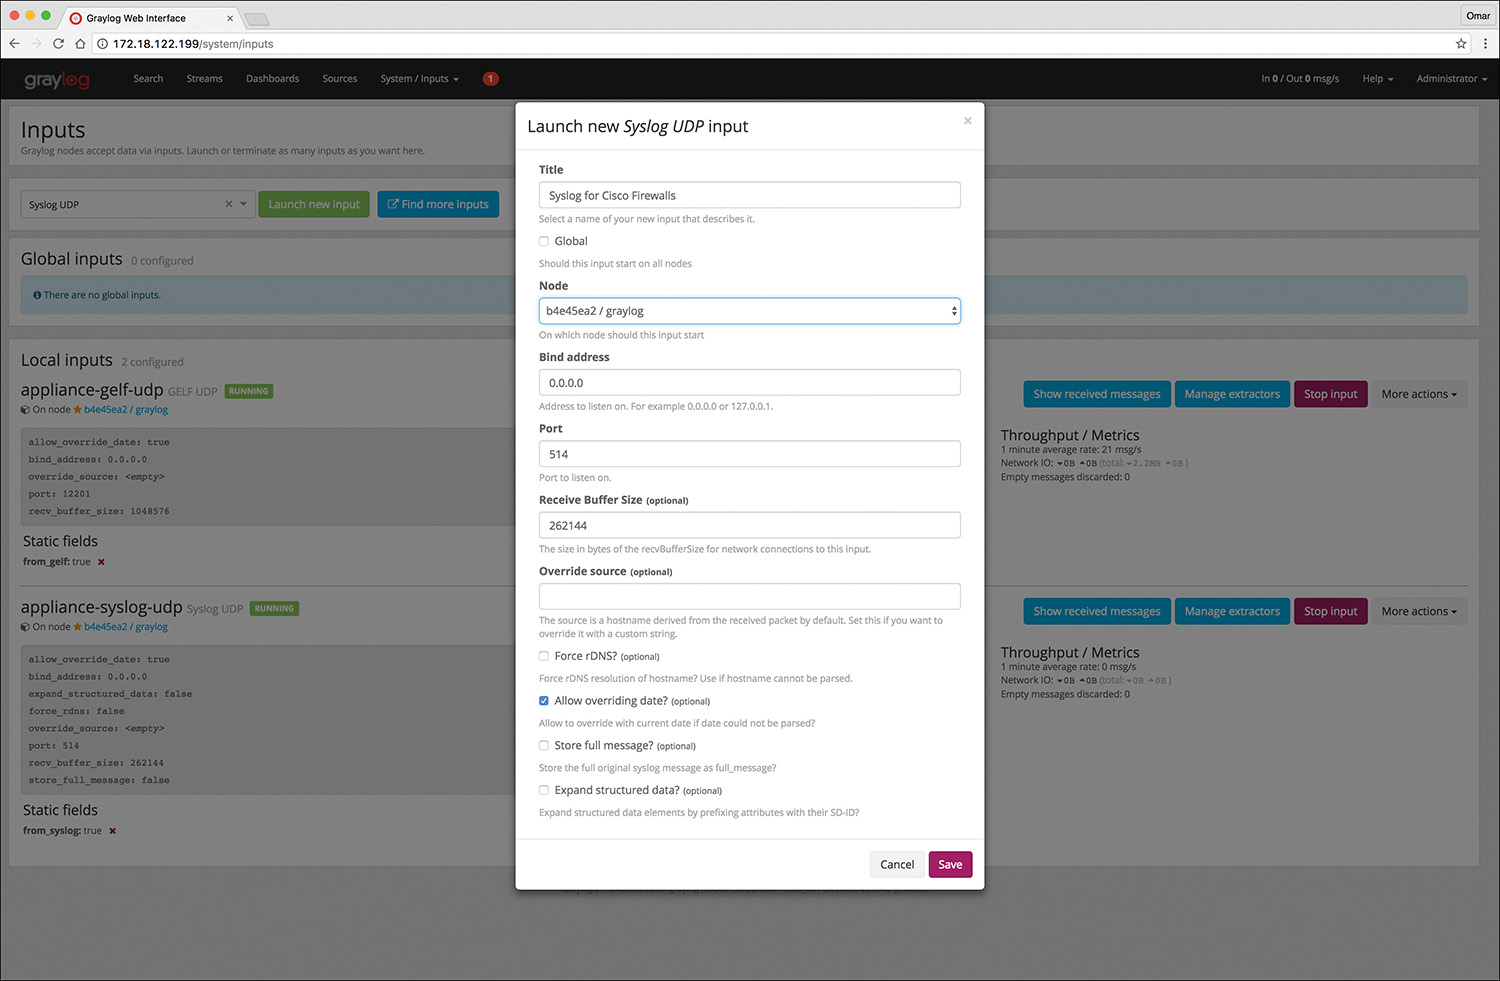
Several devices do not send RFC-compliant syslog messages. This might result in wrong or completely failing parsing. In that case, you might have to go with a combination of raw/plaintext message inputs that do not attempt to do any parsing. Graylog accepts data via inputs. Figure 11-9 shows the Graylog Input screen and several of the supported “inputs,” including plaintext, Syslog from different devices, and transports (including TCP and UDP).

Figure 11-10 shows an example of how to launch a new Syslog UDP input. In this example, this syslog instance will be for Cisco firewalls and the port is set to the default UDP port 514.
Elasticsearch, Logstash, and Kibana (ELK) Stack
The Elasticsearch ELK stack is a very powerful open source analytics platform. ELK stands for Elasticsearch, Logstash, and Kibana.
Elasticsearch is the name of a distributed search and analytics engine, but it is also the name of the company founded by the folks behind Elasticsearch and Apache Lucene. Elasticsearch is built on top of Apache Lucene, which is a high-performance search and information retrieval library written in Java. Elasticsearch is a schema-free, full-text search engine with multilanguage support. It provides support for geolocation, suggestive search, auto-completion, and search snippets.
Logstash offers centralized log aggregation of many types, such as network infrastructure device logs, server logs, and also NetFlow. Logstash is written in JRuby and runs in a Java Virtual Machine (JVM). It has a very simple message-based architecture. Logstash has a single agent that is configured to perform different functions in combination with the other ELK components. There are four major components in the Logstash ecosystem:
![]() The shipper: Sends events to Logstash. Typically, remote agents will only run this component.
The shipper: Sends events to Logstash. Typically, remote agents will only run this component.
![]() The broker and indexer: Receive and index the events.
The broker and indexer: Receive and index the events.
![]() The search and storage: Allow you to search and store events.
The search and storage: Allow you to search and store events.
![]() The web interface: The web-based interface is called Kibana.
The web interface: The web-based interface is called Kibana.
Logstash is very scalable because servers running Logstash can run one or more of these aforementioned components independently. Kibana is an analytics and visualization platform architected for Elasticsearch. It provides real-time summary and charting of streaming data, with the ability to share and embed dashboards.
Marvel and Shield are two additional components that can be integrated with ELK:
![]() Marvel: Provides monitoring of an Elasticsearch deployment. It uses Kibana to visualize the data. It provides a detailed explanation of things that are happening within the ELK deployment that are very useful for troubleshooting and additional analysis. You can obtain information about Marvel at http://www.elasticsearch.org/overview/marvel.
Marvel: Provides monitoring of an Elasticsearch deployment. It uses Kibana to visualize the data. It provides a detailed explanation of things that are happening within the ELK deployment that are very useful for troubleshooting and additional analysis. You can obtain information about Marvel at http://www.elasticsearch.org/overview/marvel.
![]() Shield: Provides security features to ELK such as role-based access control, authentication, IP filtering, encryption of ELK data, and audit logging. Shield is not free, and it requires a license. You can obtain more information about Shield at http://www.elasticsearch.org/overview/shield.
Shield: Provides security features to ELK such as role-based access control, authentication, IP filtering, encryption of ELK data, and audit logging. Shield is not free, and it requires a license. You can obtain more information about Shield at http://www.elasticsearch.org/overview/shield.
Elasticsearch also provides integration with big data platforms such as Hadoop.
You can download each of the ELK components using the following links:
![]() Elasticsearch: https://www.elastic.co/downloads/elasticsearch
Elasticsearch: https://www.elastic.co/downloads/elasticsearch
![]() Kibana: https://www.elastic.co/downloads/kibana
Kibana: https://www.elastic.co/downloads/kibana
![]() Logstash: https://www.elastic.co/downloads/logstash
Logstash: https://www.elastic.co/downloads/logstash
You can obtain information about how to install ELK and collect logs and NetFlow data with ELK at my GitHub repository, https://github.com/santosomar/netflow.
Next-Generation Firewall and Next-Generation IPS Logs
Next-generation firewalls, such as the Cisco ASA with FirePOWER services and Cisco Firepower Threat Defense (FTD), and next-generation IPS devices such as the Cisco Firepower Next-Generation IPS appliances provide a more robust solution to protect against today’s threats. They provide a whole new game when analyzing security logs and events. This integrated suite of network security and traffic management products is also known as the Cisco Firepower System, and they all can be deployed either on appliances or as software solutions via virtual machines (VMs). In a typical deployment, multiple managed devices installed on network segments monitor traffic for analysis and report to a Firepower Management Center (FMC). The FMC is the heart of all reports and event analysis.
You can monitor events for traffic that does not conform to your access control policies. Access control policies allow you to specify, inspect, and log the traffic that can traverse your network. An access control policy determines how the system handles traffic on your network. The simplest access control policy directs its target devices to handle all traffic using its default action. You can set this default action to block or trust all traffic without further inspection, or to inspect traffic for intrusions and discovery data. A more complex access control policy can blacklist traffic based on IP, URL, and DNS Security Intelligence data, as well as use access control rules to exert granular control over network traffic logging and handling. These rules can be simple or complex, matching and inspecting traffic using multiple criteria; you can control traffic by security zone, network or geographical location, VLAN, port, application, requested URL, and user. Advanced access control options include decryption, preprocessing, and performance.
Each access control rule also has an action that determines whether you monitor, trust, block, or allow matching traffic. When you allow traffic, you can specify that the system first inspect it with intrusion or file policies to block any exploits, malware, or prohibited files before they reach your assets or exit your network.
Figure 11-11 shows the Content Explorer window of the Cisco FMC, including traffic and intrusion events from managed devices that include next-generation firewalls and next-generation IPS devices.

In Figure 11-11, you can also see high-level statistics and graphs of indicators of compromise detected in the infrastructure. Figure 11-12 shows the Network Information statistics of the Content Explorer window of the Cisco FMC. In this window, you can see traffic by operating system, connections by access control action, and traffic by source and destination IP addresses as well as source user and ingress security zone.

The FMC Context Explorer displays detailed, interactive graphical information in context about the status of your monitored network, including data on applications, application statistics, connections, geolocation, indications of compromise, intrusion events, hosts, servers, Security Intelligence, users, files (including malware files), and relevant URLs. Figure 11-13 shows application protocol information statistics on the Context Explorer in the FMC.

Figure 11-14 shows Security Intelligence information of the Context Explorer in the FMC, including Security Intelligence traffic by category, source IP, and destination IP. Figure 11-14 also shows high-level intrusion information by impact, as well as displays information about the top attackers and top users in the network.

The FMC dashboard is highly customizable and compartmentalized, and it updates in real time. In contrast, the Context Explorer is manually updated, designed to provide broader context for its data, and has a single, consistent layout designed for active user exploration.
You can use FMC in a multidomain deployment. If you have deployed the FMC in a multidomain environment, the Context Explorer displays aggregated data from all subdomains when you view it in an ancestor domain. In a leaf domain, you can view data specific to that domain only. In a multidomain deployment, you can view data for the current domain and for any descendant domains. You cannot view data from higher-level or sibling domains.
You use the dashboard to monitor real-time activity on your network and appliances according to your own specific needs. Equally, you use the Context Explorer to investigate a predefined set of recent data in granular detail and clear context: for example, if you notice that only 15% of hosts on your network use Linux, but account for almost all YouTube traffic, you can quickly apply filters to view data only for Linux hosts, only for YouTube-associated application data, or both. Unlike the compact, narrowly focused dashboard widgets, the Context Explorer sections are designed to provide striking visual representations of system activity in a format useful to both expert and casual users of the FMC.
NOTE
The data displayed depends on such factors as how you license and deploy your managed devices, and whether you configure features that provide the data. You can also apply filters to constrain the data that appears in all Context Explorer sections.
You can easily create and apply custom filters to fine-tune your analysis, and you can examine data sections in more detail by simply clicking or hovering your cursor over graph areas. For example, in Figure 11-15, the administrator right-clicks the pie chart under the Intrusion Events by Impact section and selects Drill into Analysis.

After the administrator selects Drill into Analysis, the screen shown in Figure 11-16 is displayed. This screen displays all events by priority and classification.

Depending on the type of data you examine, additional options can appear in the context menu. Data points that are associated with specific IP addresses offer the option to view host or whois information of the IP address you select. Data points associated with specific applications offer the option to view application information on the application you select. Data points associated with a specific user offer the option to view that user’s profile page. Data points associated with an intrusion event message offer the option to view the rule documentation for that event’s associated intrusion rule, and data points associated with a specific IP address offer the option to blacklist or whitelist that address.
Next-generation firewalls and next-generation IPS systems via the FMC also support an incident lifecycle, allowing you to change an incident’s status as you progress through your response to an attack. When you close an incident, you can note any changes you have made to your security policies as a result of any lessons learned. Generally, an incident is defined as one or more intrusion events that you suspect are involved in a possible violation of your security policies. In the FMC, the term also describes the feature you can use to track your response to an incident.
Some intrusion events are more important than others to the availability, confidentiality, and integrity of your network assets. For example, the port scan detection can keep you informed of port-scanning activity on your network. Your security policy, however, may not specifically prohibit port scanning or see it as a high-priority threat, so rather than take any direct action, you may instead want to keep logs of any port scanning for later forensic study. On the other hand, if the system generates events that indicate hosts within your network have been compromised and are participating in distributed denial-of-service (DDoS) attacks, this activity is likely a clear violation of your security policy, and you should create an incident in the FMC to help you track your investigation of these events.
The FMC and next-generation firewalls and IPS systems are particularly well suited to supporting the investigation and qualification processes of the incident response process. You can create your own event classifications and then apply them in a way that best describes the vulnerabilities on your network. When traffic on your network triggers an event, that event is automatically prioritized and qualified for you with special indicators showing which attacks are directed against hosts that are known to be vulnerable. The incident-tracking feature in the FMC also includes a status indicator that you can change to show which incidents have been escalated.
All incident-handling processes should specify how an incident is communicated between the incident-handling team and both internal and external audiences. For example, you should consider what kinds of incidents require management intervention and at what level. Also, your process should outline how and when you communicate with outside organizations. You may ask yourself the following questions:
![]() Do I want to prosecute and contact law enforcement agencies?
Do I want to prosecute and contact law enforcement agencies?
![]() Will I inform the victim if my hosts are participating in a distributed denial-of-service (DDoS) attack?
Will I inform the victim if my hosts are participating in a distributed denial-of-service (DDoS) attack?
![]() Do I want to share information with external organizations such as the U.S. CERT Coordination Center (CERT/CC) and the Forum of Incident Response and Security Teams (FIRST)?
Do I want to share information with external organizations such as the U.S. CERT Coordination Center (CERT/CC) and the Forum of Incident Response and Security Teams (FIRST)?
The FMC has features that you can use to gather intrusion data in standard formats such as HTML, PDF, and comma-separated values (CSV) files so that you can easily share intrusion data with other entities. For instance, CERT/CC collects standard information about security incidents on its website that you can easily extract from FMC, such as the following:
![]() Information about the affected machines, including:
Information about the affected machines, including:
![]() The hostname and IP
The hostname and IP
![]() The time zone
The time zone
![]() The purpose or function of the host
The purpose or function of the host
![]() Information about the sources of the attack, including:
Information about the sources of the attack, including:
![]() The hostname and IP
The hostname and IP
![]() The time zone
The time zone
![]() Whether you had any contact with an attacker
Whether you had any contact with an attacker
![]() The estimated cost of handling the incident
The estimated cost of handling the incident
![]() A description of the incident, including:
A description of the incident, including:
![]() Dates
Dates
![]() Methods of intrusion
Methods of intrusion
![]() The intruder tools involved
The intruder tools involved
![]() The software versions and patch levels
The software versions and patch levels
![]() Any intruder tool output
Any intruder tool output
![]() The details of vulnerabilities exploited
The details of vulnerabilities exploited
![]() The source of the attack
The source of the attack
![]() Any other relevant information
Any other relevant information
You can also use the comment section of an incident to record when you communicate issues and with whom. You can create custom incidents in the FMC by navigating to Analysis, Intrusions, Incidents, as shown in Figure 11-17.

To help you identify and mitigate the effects of malware, the FMC file control, network file trajectory, and Advanced Malware Protection (AMP) can detect, track, capture, analyze, log, and optionally block the transmission of files, including malware files and nested files inside archive files.
NOTE
You can also integrate the system with your organization’s AMP for Endpoints deployment to import records of scans, malware detections, and quarantines, as well as indications of compromise (IOC).
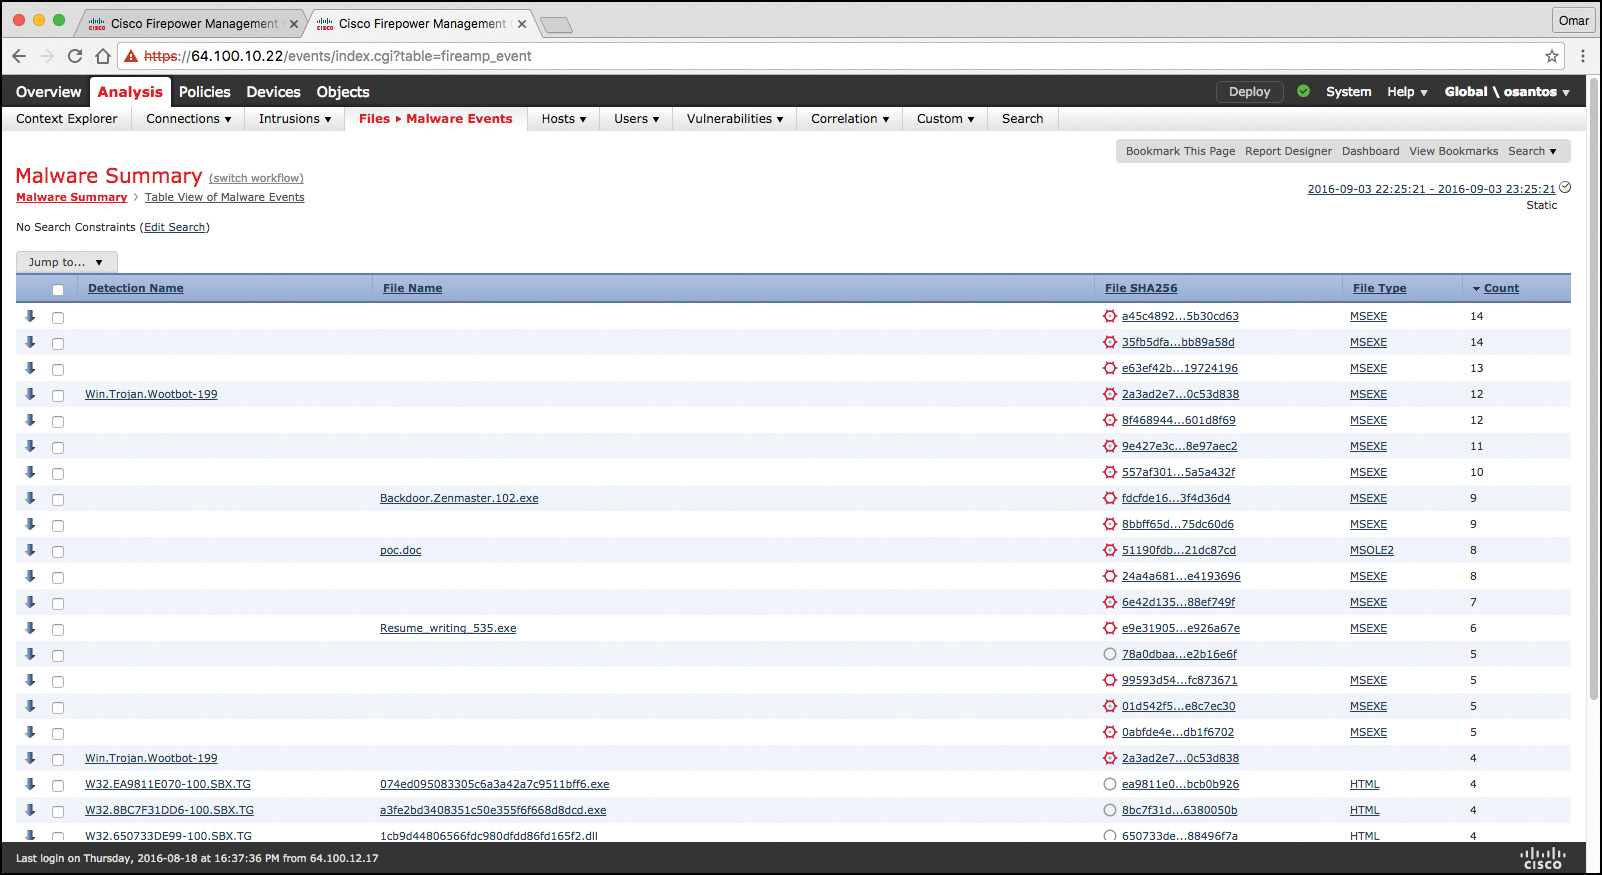
The FMC can log various types of file and malware events. The information available for any individual event can vary depending on how and why it was generated. Malware events represent malware detected by either AMP for Firepower or AMP for Endpoints; malware events can also record data other than threats from your AMP for Endpoints deployment, such as scans and quarantines. For instance, you can go to Analysis, Files, Malware Events to display all malware events, as shown in Figure 11-18.
Retrospective malware events represent files detected by AMP whose dispositions have changed. The network file trajectory feature maps how hosts transferred files, including malware files, across your network. A trajectory charts file transfer data, the disposition of the file, and if a file transfer was blocked or quarantined. You can determine which hosts may have transferred malware, which hosts are at risk, and observe file transfer trends. Figure 11-19 shows the Network File Trajectory screen for the detection name Win.Trojan.Wootbot-199 that was listed in Figure 11-18.

You can track the transmission of any file with an AMP cloud-assigned disposition. The system can use information related to detecting and blocking malware from both AMP for Firepower and AMP for Endpoints to build the trajectory. The Network File Trajectory List page displays the malware most recently detected on your network, as well as the files whose trajectory maps you have most recently viewed. From these lists, you can view when each file was most recently seen on the network, the file’s SHA-256 hash value, name, type, current file disposition, contents (for archive files), and the number of events associated with the file. The page also contains a search box that lets you locate files, either based on SHA-256 hash value or filename or based on the IP address of the host that transferred or received a file. After you locate a file, you can click the File SHA256 value to view the detailed trajectory map.
You can trace a file through the network by viewing the detailed network file trajectory. There are three components to a network file trajectory:
![]() Summary information: The summary information about the file, including file identification information, when the file was first seen and most recently seen on the network, the number of related events and hosts associated with the file, and the file’s current disposition. From this section, if the managed device stored the file, you can download it locally, submit the file for dynamic analysis, or add the file to a file list.
Summary information: The summary information about the file, including file identification information, when the file was first seen and most recently seen on the network, the number of related events and hosts associated with the file, and the file’s current disposition. From this section, if the managed device stored the file, you can download it locally, submit the file for dynamic analysis, or add the file to a file list.
![]() Trajectory map: Visually tracks a file from the first detection on your network to the most recent. The map shows when hosts transferred or received the file, how often they transferred the file, and when the file was blocked or quarantined. Vertical lines between data points represent file transfers between hosts. Horizontal lines connecting the data points show a host’s file activity over time.
Trajectory map: Visually tracks a file from the first detection on your network to the most recent. The map shows when hosts transferred or received the file, how often they transferred the file, and when the file was blocked or quarantined. Vertical lines between data points represent file transfers between hosts. Horizontal lines connecting the data points show a host’s file activity over time.
![]() Related events: You can select a data point in the map and highlight a path that traces back to the first instance the host transferred that file; this path also intersects with every occurrence involving the host as either sender or receiver of the file.
Related events: You can select a data point in the map and highlight a path that traces back to the first instance the host transferred that file; this path also intersects with every occurrence involving the host as either sender or receiver of the file.
The Events table lists event information for each data point in the map. Using the table and the map, you can pinpoint specific file events, hosts on the network that transferred or received this file, related events in the map, and other related events in a table constrained on selected values.
NetFlow Analysis
In Chapter 2, “Network Security Devices and Cloud Services,” you learned that NetFlow is a Cisco technology that provides comprehensive visibility into all network traffic that traverses a Cisco-supported device. NetFlow is used as a network security tool because its reporting capabilities provide nonrepudiation, anomaly detection, and investigative capabilities. As network traffic traverses a NetFlow-enabled device, the device collects traffic flow information and provides a network administrator or security professional with detailed information about such flows.
NetFlow provides detailed network telemetry that can be used to see what is actually happening across the entire network. You can use NetFlow to identify DoS attacks, quickly identify compromised endpoints and network infrastructure devices, and monitor network usage of employees, contractors, and partners. NetFlow is also often used to obtain network telemetry during security incident response and forensics. You can also take advantage of NetFlow to detect firewall misconfigurations and inappropriate access to corporate resources.
NetFlow provides detailed network telemetry that allows you to do the following:
![]() See what is actually happening across your entire network
See what is actually happening across your entire network
![]() Regain control of your network, in case of a denial-of-service (DoS) attack
Regain control of your network, in case of a denial-of-service (DoS) attack
![]() Quickly identify compromised endpoints and network infrastructure devices
Quickly identify compromised endpoints and network infrastructure devices
![]() Monitor network usage of employees, contractors, or partners
Monitor network usage of employees, contractors, or partners
![]() Obtain network telemetry during security incident response and forensics
Obtain network telemetry during security incident response and forensics
![]() Detect firewall misconfigurations and inappropriate access to corporate resources
Detect firewall misconfigurations and inappropriate access to corporate resources
NetFlow data can grow to tens of terabytes of data per day in large organizations, and it is expected to grow over the years to petabytes. However, many other telemetry sources can be used in conjunction with NetFlow to identify, classify, and mitigate potential threats in your network.
The Internet Protocol Flow Information Export (IPFIX) is a network flow standard led by the Internet Engineering Task Force (IETF). IPFIX was created to create a common, universal standard of export for flow information from routers, switches, firewalls, and other infrastructure devices. IPFIX defines how flow information should be formatted and transferred from an exporter to a collector. IPFIX is documented in RFC 7011 through RFC 7015 and RFC 5103. Cisco NetFlow Version 9 is the basis and main point of reference for IPFIX. IPFIX changes some of the terminologies of NetFlow, but in essence they are the same principles of NetFlow Version 9.
IPFIX is considered to be a push protocol. Each IPFIX-enabled device regularly sends IPFIX messages to configured collectors (receivers) without any interaction by the receiver. The sender controls most of the orchestration of the IPFIX data messages. IPFIX introduces the concept of templates, which make up these flow data messages to the receiver. IPFIX also allows the sender to use user-defined data types in its messages. IPFIX prefers the Stream Control Transmission Protocol (SCTP) as its transport layer protocol; however, it also supports the use of Transmission Control Protocol (TCP) or User Datagram Protocol (UDP) messages.
Traditional Cisco NetFlow records are usually exported via UDP messages. The IP address of the NetFlow collector and the destination UDP port must be configured on the sending device. The NetFlow standard (RFC 3954) does not specify a specific NetFlow listening port. The standard or most common UDP port used by NetFlow is UDP port 2055, but other ports such as 9555 or 9995, 9025, and 9026 can also be used. UDP port 4739 is the default port used by IPFIX.
NetFlow is supported in many different platforms, including the following:
![]() Numerous Cisco IOS and Cisco IOS-XE routers
Numerous Cisco IOS and Cisco IOS-XE routers
![]() Cisco ISR Generation 2 routers
Cisco ISR Generation 2 routers
![]() Cisco Catalyst switches
Cisco Catalyst switches
![]() Cisco ASR 1000 series routers
Cisco ASR 1000 series routers
![]() Cisco Carrier Routing System (CRS)
Cisco Carrier Routing System (CRS)
![]() Cisco Cloud Services Router (CSR)
Cisco Cloud Services Router (CSR)
![]() Cisco Network Convergence System (NCS)
Cisco Network Convergence System (NCS)
![]() Cisco ASA 5500-X series next-generation firewalls
Cisco ASA 5500-X series next-generation firewalls
![]() Cisco NetFlow Generation Appliances (NGAs)
Cisco NetFlow Generation Appliances (NGAs)
![]() Cisco Wireless LAN Controllers
Cisco Wireless LAN Controllers
Commercial NetFlow Analysis Tools
There are several commercial and open source NetFlow monitoring and analysis software packages in the industry. Two of the most popular commercial products are Lancope’s Stealthwatch solution and Plixer Scrutinizer. Cisco acquired a company called Lancope. The Cisco Lancope’s Stealthwatch solution is a key component of the Cisco Cyber Threat Defense (CTD) solution. One of the key benefits of Lancope’s Stealthwatch is its capability to scale in large enterprises. It also provides integration with the Cisco Identity Services Engine (ISE) for user identity information. Cisco ISE is a security policy management and control system that you can use for access control and security compliance for wired, wireless, and virtual private network (VPN) connections.
The following are the primary components of the Lancope Stealthwatch solution:
![]() Stealthwatch Management Console: Provides centralized management, configuration, and reporting of the other Stealthwatch components. It can be deployed in a physical server or a virtual machine (VM). The Stealthwatch Management Console provides high-availability features (failover).
Stealthwatch Management Console: Provides centralized management, configuration, and reporting of the other Stealthwatch components. It can be deployed in a physical server or a virtual machine (VM). The Stealthwatch Management Console provides high-availability features (failover).
![]() FlowCollector: A physical or virtual appliance that collects NetFlow data from infrastructure devices.
FlowCollector: A physical or virtual appliance that collects NetFlow data from infrastructure devices.
![]() FlowSensor: A physical or virtual appliance that can generate NetFlow data when legacy Cisco network infrastructure components are not capable of producing line-rate, unsampled NetFlow data. Alternatively, the Cisco NetFlow Generator Appliance (NGA) can be used.
FlowSensor: A physical or virtual appliance that can generate NetFlow data when legacy Cisco network infrastructure components are not capable of producing line-rate, unsampled NetFlow data. Alternatively, the Cisco NetFlow Generator Appliance (NGA) can be used.
![]() FlowReplicator: A physical appliance used to forward NetFlow data as a single data stream to other devices.
FlowReplicator: A physical appliance used to forward NetFlow data as a single data stream to other devices.
![]() Stealthwatch IDentity: Provides user identity monitoring capabilities. Administrators can search on usernames to obtain a specific user network activity. Identity data can be obtained from the Stealthwatch IDentity appliance or through integration with the Cisco ISE.
Stealthwatch IDentity: Provides user identity monitoring capabilities. Administrators can search on usernames to obtain a specific user network activity. Identity data can be obtained from the Stealthwatch IDentity appliance or through integration with the Cisco ISE.
NOTE
Lancope Stealthwatch also supports usernames within NetFlow records from Cisco ASA appliances.
Lancope’s Stealthwatch solution supports a feature called network address translation (NAT) stitching. NAT stitching uses data from network devices to combine NAT information from inside a firewall (or a NAT device) with information from outside the firewall (or a NAT device) to identify which IP addresses and users are part of a specific flow.
One other major benefit of Lancope’s Stealthwatch is its graphical interface, which includes great visualizations of network traffic, customized summary reports, and integrated security and network intelligence for drill-down analysis. Figure 11-20 shows the Security Insight Dashboard of Lancope’s Stealthwatch Management Center (SMC).

Lancope’s Stealthwatch allows you to drill into all the flows inspected by the system and search for policy violations, as demonstrated in Figure 11-21.

Figure 11-22 shows the detailed SMC’s reporting and configuration graphical unit interface (GUI).

Open Source NetFlow Analysis Tools
The number of open source NetFlow monitoring and analysis software packages is on the rise. You can use these open source tools to successfully identify security threats within your network. Here are a few examples of the most popular open source NetFlow collection and analysis toolkits:
![]() NFdump (sometimes used with NfSen or Stager)
NFdump (sometimes used with NfSen or Stager)
![]() SiLK
SiLK
![]() ELK
ELK
NFdump is a set of Linux-based tools that support NetFlow Versions 5, 7, and 9. You can download NFdump from http://nfdump.sourceforge.net and install it from source. Alternatively, you can easily install NFdump in multiple Linux distributions such as Ubuntu using sudo apt-get install nfdump.
Routers, firewalls, and any other NetFlow-enabled infrastructure devices can send NetFlow records to NFdump. The command to capture the NetFlow data is nfcapd. All processed NetFlow records are stored in one or more binary files. These binary files are read by NFdump and can be displayed in plaintext to standard output (stdout) or written to another file. Example 11-13 demonstrates how the nfcapd command is used to capture and store NetFlow data in a directory called netflow. The server is configured to listen to port 9996 for NetFlow communication.
Example 11-13 Using the nfcapd Command
omar@server1:~$ nfcapd -w -D -l netflow -p 9996
omar@server1:~$ cd netflow
omar@server1:~/netflow$ ls -l
total 544
-rw-r--r-- 1 omar omar 20772 Sep 18 00:45 nfcapd.201609180040
-rw-r--r-- 1 omar omar 94916 Sep 18 00:50 nfcapd.201609180045
-rw-r--r-- 1 omar omar 84108 Sep 18 00:55 nfcapd.201609180050
-rw-r--r-- 1 omar omar 78564 Sep 18 01:00 nfcapd.201609180055
-rw-r--r-- 1 omar omar 106732 Sep 18 01:05 nfcapd.201609180100
-rw-r--r-- 1 omar omar 73692 Sep 18 01:10 nfcapd.201609180105
-rw-r--r-- 1 omar omar 76996 Sep 18 01:15 nfcapd.201609180110
-rw-r--r-- 1 omar omar 276 Sep 18 01:15 nfcapd.current
Flows are read either from a single file or from a sequence of files. In Example 11-13, a series of files was created by the nfcapd daemon. Example 11-14 shows the command options of the nfcapd daemon command.
Example 11-14 nfcapd Daemon Command Options
omar@ server1:~$ nfcapd -h
usage nfcapd [options]
-h this text you see right here
-u userid Change user to username
-g groupid Change group to groupname
-w Sync file rotation with next 5min (default) interval
-t interval set the interval to rotate nfcapd files
-b host bind socket to host/IP addr
-j mcastgroup Join multicast group <mcastgroup>
-p portnum listen on port portnum
-l basdir set the output directory. (no default)
-S subdir Sub directory format. see nfcapd(1) for format
-I Ident set the ident string for stat file. (default 'none')
-H Add port histogram data to flow file.(default 'no')
-n Ident,IP,logdir Add this flow source - multiple streams
-P pidfile set the PID file
-R IP[/port] Repeat incoming packets to IP address/port
-s rate set default sampling rate (default 1)
-x process launch process after a new file becomes available
-z Compress flows in output file.
-B bufflen Set socket buffer to bufflen bytes
-e Expire data at each cycle.
-D Fork to background
-E Print extended format of netflow data. for debugging purpose only.
-T Include extension tags in records.
-4 Listen on IPv4 (default).
-6 Listen on IPv6.
-V Print version and exit.
Example 11-15 demonstrates how to use the nfdump command to process and analyze all files that were created by nfcapd in the netflow directory.
Example 11-15 Processing and Displaying the nfcapd Files with nfdump
omar@server1::~$ nfdump -R netflow -o extended -s srcip -s ip/flows
Top 10 Src IP Addr ordered by flows:
Date first seen Duration Proto Src IP Addr Flows(%)
Packets(%) Bytes(%) pps bps bpp
2016-09-11 22:35:10.805 2.353 any 192.168.1.140 1582(19.5)
0(-nan) 0(-nan) 0 0 0
2016-09-11 22:35:10.829 2.380 any 192.168.1.130 875(10.8)
0(-nan) 0(-nan) 0 0 0
2016-09-11 22:35:10.805 2.404 any 192.168.1.168 807( 9.9)
0(-nan) 0(-nan) 0 0 0
2016-09-11 22:35:11.219 1.839 any 192.168.1.142 679( 8.4)
0(-nan) 0(-nan) 0 0 0
2016-09-11 22:35:10.805 2.258 any 192.168.1.156 665( 8.2)
0(-nan) 0(-nan) 0 0 0
2016-09-11 22:35:10.805 2.297 any 192.168.1.205 562( 6.9)
0(-nan) 0(-nan) 0 0 0
2016-09-11 22:35:10.805 2.404 any 192.168.1.89 450( 5.5)
0(-nan) 0(-nan) 0 0 0
2016-09-11 22:35:11.050 1.989 any 10.248.91.231 248( 3.1)
0(-nan) 0(-nan) 0 0 0
2016-09-11 22:35:11.633 1.342 any 192.168.1.149 234( 2.9)
0(-nan) 0(-nan) 0 0 0
2016-09-11 22:35:11.040 2.118 any 192.168.1.157 213( 2.6)
0(-nan) 0(-nan) 0 0 0
Top 10 IP Addr ordered by flows:
Date first seen Duration Proto IP Addr Flows(%)
Packets(%) Bytes(%) pps bps bpp
2016-09-11 22:35:10.805 2.353 any 192.168.1.140 1582(19.5)
0(-nan) 0(-nan) 0 0 0
2016-09-11 22:35:10.805 2.353 any 10.8.8.8 1188(14.6)
0(-nan) 0(-nan) 0 0 0
2016-09-11 22:35:10.805 2.297 any 192.168.1.1 1041(12.8)
0(-nan) 0(-nan) 0 0 0
2016-09-11 22:35:10.829 2.380 any 192.168.1.130 875(10.8)
0(-nan) 0(-nan) 0 0 0
2016-09-11 22:35:10.805 2.404 any 192.168.1.168 807( 9.9)
0(-nan) 0(-nan) 0 0 0
2016-09-11 22:35:11.219 1.839 any 192.168.1.142 679( 8.4)
0(-nan) 0(-nan) 0 0 0
2016-09-11 22:35:10.805 2.258 any 192.168.1.156 665( 8.2)
0(-nan) 0(-nan) 0 0 0
2016-09-11 22:35:10.805 2.297 any 192.168.1.205 562( 6.9)
0(-nan) 0(-nan) 0 0 0
2016-09-11 22:35:10.825 2.277 any 10.190.38.99 467( 5.8)
0(-nan) 0(-nan) 0 0 0
2016-09-11 22:35:10.805 2.404 any 192.168.1.89 450( 5.5)
0(-nan) 0(-nan) 0 0 0
Summary: total flows: 8115, total bytes: 0, total packets: 0, avg bps: 0, avg
pps: 0, avg bpp: 0
Time window: 2016-09-11 22:35:10 - 2016-09-11 22:35:13
Total flows processed: 8115, Blocks skipped: 0, Bytes read: 457128
Sys: 0.009s flows/second: 829924.3 Wall: 0.008s flows/second: 967222.9
In Example 11-15, you can see the top talkers (top hosts that are sending the most traffic in the network). You can refer to the nfdump man pages for details about usage of the nfdump command (using the man nfdump command).
NfSen is the graphical web-based front end for NFdump. You can download and obtain more information about NfSen at http://nfsen.sourceforge.net.
The SiLK analysis suite is a very popular open source command-line Swiss army knife developed by CERT. Administrators and security professionals combine these tools in various ways to perform detailed NetFlow analysis. SiLK includes numerous tools and plug-ins.
The SiLK Packing System includes several applications (daemons) that collect NetFlow data and translate it into a more space-efficient format. SiLK stores these records into service-specific binary flat files for use by the analysis suite. Files are organized in a time-based directory hierarchy. The following are the SiLK daemons:
![]() flowcap: Listens to flow generators and stores the data in temporary files.
flowcap: Listens to flow generators and stores the data in temporary files.
![]() rwflowpack: Processes flow data either directly from a flow generator or from files generated by flowcap. Then it converts the data to the SiLK flow record format.
rwflowpack: Processes flow data either directly from a flow generator or from files generated by flowcap. Then it converts the data to the SiLK flow record format.
![]() rwflowappend: Appends flow records to hourly files organized in a time-based directory tree.
rwflowappend: Appends flow records to hourly files organized in a time-based directory tree.
![]() rwsender: Watches an incoming directory for files, moves the files into a processing directory, and transfers the files to one or more rwreceiver processes.
rwsender: Watches an incoming directory for files, moves the files into a processing directory, and transfers the files to one or more rwreceiver processes.
![]() rwreceiver: Receives and processes files transferred from one or more rwsender processes and stores them in a destination directory.
rwreceiver: Receives and processes files transferred from one or more rwsender processes and stores them in a destination directory.
![]() rwpollexec: Monitors a directory for incoming files and runs a user-specified command on each file.
rwpollexec: Monitors a directory for incoming files and runs a user-specified command on each file.
![]() rwpackchecker: Reads SiLK flow records and checks for unusual patterns that may indicate data file corruption.
rwpackchecker: Reads SiLK flow records and checks for unusual patterns that may indicate data file corruption.
![]() packlogic-twoway and packlogic-generic: Plug-ins that rwflowpack may use when categorizing flow records.
packlogic-twoway and packlogic-generic: Plug-ins that rwflowpack may use when categorizing flow records.
SiLK’s Python Extension (PySiLK) can be used to read, manipulate, and write SiLK NetFlow records in Python. PySiLK can be deployed as a standalone Python program or to write plug-ins for several SiLK applications. SiLK Python plug-in (silkpython.so) can be used by PySiLK to define new partitioning rules for rwfilter; new key fields for rwcut, rwgroup, and rwsort; and fields in rwstats and rwuniq.
Counting, Grouping, and Mating NetFlow Records with Silk
The following are the tools included in SiLK used for counting, grouping, and mating NetFlow records:
![]() rwcount: Used to count and summarize NetFlow records across time (referred to as time bins). Its output includes counts of bytes, packets, and flow records for each time bin.
rwcount: Used to count and summarize NetFlow records across time (referred to as time bins). Its output includes counts of bytes, packets, and flow records for each time bin.
![]() rwuniq: User-specified key unique record attributes. It can print columns for the total byte, packet, and/or flow counts for each bin. rwuniq can also count the number of individual values for a field.
rwuniq: User-specified key unique record attributes. It can print columns for the total byte, packet, and/or flow counts for each bin. rwuniq can also count the number of individual values for a field.
![]() rwstats: Summarizes NetFlow records just like rwuniq, but sorts the results by a value field to generate a Top-N or Bottom-N list and prints the results.
rwstats: Summarizes NetFlow records just like rwuniq, but sorts the results by a value field to generate a Top-N or Bottom-N list and prints the results.
![]() rwtotal: Summarizes NetFlow records by a specified key and prints the sum of the byte, packet, and flow counts for flows matching such a key. rwtotal is faster than rwuniq because it uses a fixed amount of memory; however, it has a limited set of keys.
rwtotal: Summarizes NetFlow records by a specified key and prints the sum of the byte, packet, and flow counts for flows matching such a key. rwtotal is faster than rwuniq because it uses a fixed amount of memory; however, it has a limited set of keys.
![]() rwaddrcount: Organizes NetFlow records by the source or destination IPv4 address and prints the byte, packet, and flow counts for each IP.
rwaddrcount: Organizes NetFlow records by the source or destination IPv4 address and prints the byte, packet, and flow counts for each IP.
![]() rwgroup: Groups NetFlow records by a user-specified key that includes record attributes, labels the records with a group ID that is stored in the Next-Hop IP field, and writes the resulting binary flows to a file or to standard output.
rwgroup: Groups NetFlow records by a user-specified key that includes record attributes, labels the records with a group ID that is stored in the Next-Hop IP field, and writes the resulting binary flows to a file or to standard output.
![]() rwmatch: Matches records as queries and responses, marks mated records with an identifier that is stored in the Next-Hop IP field, and writes the binary flow records to the output.
rwmatch: Matches records as queries and responses, marks mated records with an identifier that is stored in the Next-Hop IP field, and writes the binary flow records to the output.
Elasticsearch ELK stack is a very powerful open source NetFlow analytics platform. Previously in this chapter, you learned that ELK stands for Elasticsearch, Logstash, and Kibana.
Big Data Analytics for Cyber Security Network Telemetry
NetFlow data, syslog, SNMP logs, server and host logs, packet captures, and files (such as executables, malware, and exploits) can be parsed, formatted, and combined with threat intelligence information and other “enrichment data” (network metadata) to perform analytics. This process is not an easy one; this is why Cisco created an open source framework for big data analytics called Open Security Operations Center (OpenSOC). OpenSOC was later replaced by Apache Metron (Incubating). You can find additional information about Apache Metron at http://metron.incubator.apache.org/.
OpenSOC was created by Cisco to attack the “big data problem” for their Advanced Threat Analytics (ATA) offering, formerly known as Managed Threat Defense (MTD). Cisco has developed a fully managed service delivered by Cisco Security Solutions to help customers protect against known intrusions, zero-day attacks, and advanced persistent threats. Cisco has a global network of security operations centers (SOCs) ensuring constant awareness and on-demand analysis 24 hours a day, 7 days a week. They needed the ability to capture full packet-level data and extract protocol metadata to create a unique profile of the customer’s network and monitor it against Cisco threat intelligence. As you can imagine, performing big data analytics for one organization is a challenge; Cisco has to perform big data analytics for numerous customers, including very large enterprises. The goal with OpenSOC and now Apache Metron is to have a robust framework based on proven technologies to combine machine learning algorithms and predictive analytics to detect today’s security threats.
The following are some of the benefits of these frameworks:
![]() The ability to capture raw network packets, store those packets, and perform traffic reconstruction
The ability to capture raw network packets, store those packets, and perform traffic reconstruction
![]() Collect any network telemetry, perform enrichment, and generate real-time rules-based alerts
Collect any network telemetry, perform enrichment, and generate real-time rules-based alerts
![]() Perform real-time search and cross-telemetry matching
Perform real-time search and cross-telemetry matching
![]() Automated reports
Automated reports
![]() Anomaly detection and alerting
Anomaly detection and alerting
![]() Integration with existing analytics tools
Integration with existing analytics tools
NOTE
Metron is open sourced under the Apache license.
These frameworks use technologies such as the following:
![]() Hadoop
Hadoop
![]() Flume
Flume
![]() Kafka
Kafka
![]() Storm
Storm
![]() Hive
Hive
![]() Elasticsearch
Elasticsearch
![]() HBase
HBase
![]() Third-party analytic tool support (R, Python-based tools, Power Pivot, Tableau, and so on)
Third-party analytic tool support (R, Python-based tools, Power Pivot, Tableau, and so on)
The challenges of big data analytics include the following:
![]() Data capture capabilities
Data capture capabilities
![]() Data management (curation)
Data management (curation)
![]() Adequate and real-time search
Adequate and real-time search
![]() Sharing and transferring of information
Sharing and transferring of information
![]() Deep-dive and automated analysis
Deep-dive and automated analysis
![]() Adequate visualizations
Adequate visualizations
Big data has become a hot topic due to the overabundance of data sources inundating today’s data stores as applications proliferate. These challenges will become even bigger as the world moves to the Internet of Everything (IoE), a term coined by Cisco. IoE is based on the foundation of the Internet of Things (IoT) by adding network intelligence that allows convergence, orchestration, and visibility across previously disparate systems. IoT is the networked connection of physical objects. IoT is one of many technology transitions that enable the IoE.
The goal is to make networked connections more relevant by turning information into actions that create new capabilities. The IoE consists of many technology transitions, including the IoT. The key concepts are as follows:
![]() Machine-to-machine connections: Including things such as IoT sensors, remote monitoring, industrial control systems, and so on
Machine-to-machine connections: Including things such as IoT sensors, remote monitoring, industrial control systems, and so on
![]() People-to-people connections: Including collaboration technologies such as TelePresence, WebEx, and so on
People-to-people connections: Including collaboration technologies such as TelePresence, WebEx, and so on
![]() Machine-to-people connections: Including traditional and new applications
Machine-to-people connections: Including traditional and new applications
Big data analytics for cyber security in an IoE world will require substantial engineering to address the huge data sets. Scalability will be a huge challenge. In addition, the endless variety of IoT applications presents a security operational challenge. We are starting to experience these challenges nowadays. For instance, on the factory floor, embedded programmable logic controllers (PLCs) that operate manufacturing systems and robots can be a huge target for bad actors. Do we know all the potential true indicators of compromise so that we can perform deep-dive analysis and perform good incident response?
The need to combine threat intelligence and big data analytics will be paramount in this ever-changing world.
Configuring Flexible NetFlow in Cisco IOS and Cisco IOS-XE Devices
Flexible NetFlow provides enhanced optimization of the network infrastructure, reduces costs, and improves capacity planning and security detection beyond other flow-based technologies available today. Flexible NetFlow supports IPv6 and Network-Based Application Recognition (NBAR) 2 for IPv6 starting in Cisco IOS Software Version 15.2(1)T. It also supports IPv6 transition techniques (IPv6 inside IPv4).
Flexible NetFlow tracks different applications simultaneously. For instance, security monitoring, traffic analysis, and billing can be tracked separately, and the information customized per application.
Flexible NetFlow allows the network administrator or security professional to create multiple flow caches or information databases to track. Conventionally, NetFlow has a single cache, and all applications use the same cache information. Flexible NetFlow supports the collection of specific security information in one flow cache and traffic analysis in another. Subsequently, each NetFlow cache serves a different purpose. For instance, multicast and security information can be tracked separately and the results sent to two different collectors. Figure 11-23 shows the Flexible NetFlow model and how three different monitors are used. Monitor 1 exports Flexible NetFlow data to Exporter 1, Monitor 2 exports Flexible NetFlow data to Exporter 2, and Monitor 3 exports Flexible NetFlow data to Exporter 1 and Exporter 3.

The following are the Flexible NetFlow components:
![]() Records
Records
![]() Flow monitors
Flow monitors
![]() Flow exporters
Flow exporters
![]() Flow samplers
Flow samplers
In Flexible NetFlow, the administrator can specify what to track, resulting in fewer flows. This helps to scale in busy networks and use fewer resources that are already taxed by other features and services.
Records are a combination of key and non-key fields. In Flexible NetFlow, records are appointed to flow monitors to define the cache that is used for storing flow data. There are seven default attributes in the IP packet identity or “key fields” for a flow and for a device to determine whether the packet information is unique or similar to other packets sent over the network. Fields such as TCP flags, subnet masks, packets, and number of bytes are non-key fields. However, they are often collected and exported in NetFlow or in IPFIX.
There are several Flexible NetFlow key fields in each packet that is forwarded within a NetFlow-enabled device. The device looks for a set of IP packet attributes for the flow and determines whether the packet information is unique or similar to other packets. In Flexible NetFlow, key fields are configurable, which enables the administrator to conduct a more granular traffic analysis.
Table 11-3 lists the key fields related to the actual flow, device interface, and Layer 2 services.

Table 11-4 lists the IPv4- and IPv6-related key fields.

Table 11-5 lists the Layer 3 routing protocol–related key fields.

Table 11-6 lists the transport-related key fields.

Table 11-7 lists the Layer 3 routing protocol–related key fields.

Table 11-8 lists the multicast-related key fields.

There are several non-key Flexible NetFlow fields. Table 11-9 lists the non-key fields that are related to counters such as byte counts, number of packets, and more. Network administrators can use non-key fields for different purposes. For instance, the number of packets and amount of data (bytes) can be used for capacity planning and also to identify denial-of-service (DoS) attacks, in addition to other anomalies in the network.

Table 11-10 lists the timestamp-related non-key fields.

Table 11-11 lists the IPv4-only non-key fields.

Table 11-12 lists the IPv4 and IPv6 non-key fields.

Flexible NetFlow includes several predefined records that can help an administrator or security professional start deploying NetFlow within their organization. Alternatively, they can create their own customized records for more granular analysis. As Cisco evolves Flexible NetFlow, many popular user-defined flow records could be made available as predefined records to make them easier to implement.
The predefined records guarantee backward compatibility with legacy NetFlow collectors. Predefined records have a unique blend of key and non-key fields that allows network administrators and security professionals to monitor different types of traffic in their environment without any customization.
NOTE
Flexible NetFlow predefined records that are based on the aggregation cache schemes in legacy NetFlow do not perform aggregation. Alternatively, the predefined records track each flow separately.
As the name indicates, Flexible NetFlow gives network administrators and security professionals the flexibility to create their own records (user-defined records) by specifying key and non-key fields to customize the data collection. The values in non-key fields are added to flows to provide additional information about the traffic in the flows. A change in the value of a non-key field does not create a new flow. In most cases, the values for non-key fields are taken from only the first packet in the flow. Flexible NetFlow enables you to capture counter values such as the number of bytes and packets in a flow as non-key fields.
Flexible NetFlow adds a new NetFlow v9 export format field type for the header and packet section types. A device configured for Flexible NetFlow communicates with the collector using NetFlow v9 export template fields.
In Flexible NetFlow, flow monitors are applied to the network device interfaces to perform network traffic monitoring. Flow data is collected from the network traffic and added to the flow monitor cache during the monitoring process based on the key and non-key fields in the flow record.
The entities that export the data in the flow monitor cache to a remote system are called flow exporters. Flow exporters are configured as separate entities. Flow exporters are assigned to flow monitors. An administrator can create several flow exporters and assign them to one or more flow monitors. A flow exporter includes the destination address of the reporting server, the type of transport (User Datagram Protocol [UDP] or Stream Control Transmission Protocol [SCTP]), and the export format corresponding to the NetFlow version or IPFIX.
NOTE
You can configure up to eight flow exporters per flow monitor.
Flow samplers are created as separate components in a router’s configuration. Flow samplers are used to reduce the load on the device that is running Flexible NetFlow by limiting the number of packets that are selected for analysis.
Flow sampling exchanges monitoring accuracy for router performance. When you apply a sampler to a flow monitor, the overhead load on the router of running the flow monitor is reduced because the number of packets that the flow monitor must analyze is reduced. The reduction in the number of packets that are analyzed by the flow monitor causes a corresponding reduction in the accuracy of the information stored in the flow monitor’s cache.
The following is guidance for a step-by-step configuration for how to enable and configure Flexible NetFlow in Cisco IOS and Cisco IOS-XE devices. Figure 11-24 shows the configuration steps in a sequential graphical representation.

The configuration steps are as follows:
Step 1. Configure a flow record.
Step 2. Configure a flow monitor.
Step 3. Configure a flow exporter for the flow monitor.
Step 4. Apply the flow monitor to an interface.
The topology shown in Figure 11-25 is used in the following examples.

A Cisco router (R1) at the Raleigh, North Carolina branch office is configured for Flexible NetFlow. The outside network is 209.165.200.224/29, and the inside network is 10.10.10.0/24.
The following are the steps required to configure a customized flow record.
NOTE
There are hundreds of possible ways to configure customized flow records. The following steps can be followed to create one of the possible variations. You can create a customized flow record depending on your organization’s requirements.
Step 1. Log in to your router and enter into enable mode with the enable command:
R1>enable
Step 2. Enter into configuration mode with the configure terminal command:
R1#configure terminal
Enter configuration commands, one per line. End with CNTL/Z.
Step 3. Create a flow record with the flow record command. In this example, the record name is R1-FLOW-RECORD-1. After you enter the flow record command, the router enters flow record configuration mode. You can also use the flow record command to edit an existing flow record:
R1(config)# flow record R1-FLOW-RECORD-1
Step 4. (Optional) Enter a description for the new flow record:
R1(config-flow-record)# description FLOW RECORD 1 for basic traffic
analysis
Step 5. Configure a key field for the flow record using the match command. In this example, the IPv4 destination address is configured as a key field for the record:
R1(config-flow-record)# match ipv4 destination address
The output of the match ? command shows all the primary options for the key field categories that you learned earlier in this chapter:
R1(config-flow-record)# match ?
application Application fields
flow Flow identifying fields
interface Interface fields
ipv4 IPv4 fields
ipv6 IPv6 fields
routing Routing attributes
transport Transport layer fields
Step 6. Configure a non-key field with the collect command. In this example, the input interface is configured as a non-key field for the record:
R1(config-flow-record)#collect interface input
The output of the collect ? command shows all the options for the non-key field categories that you learned earlier in this chapter:
R1(config-flow-record)# collect ?
application Application fields
counter Counter fields
flow Flow identifying fields
interface Interface fields
ipv4 IPv4 fields
ipv6 IPv6 fields
routing Routing attributes
timestamp Timestamp fields
transport Transport layer fields
Step 7. Exit configuration mode with the end command and return to privileged EXEC mode:
R1(config-flow-record)# end
NOTE
You can configure Flexible NetFlow to support NBAR with the match application name command under Flexible NetFlow flow record configuration mode.
You can use the show flow record command to show the status and fields for the flow record. If multiple flow records are configured in the router, you can use the show flow record name command to show the output of a specific flow record, as shown in Example 11-16.
Example 11-16 show flow record Command Output
R1# show flow record R1-FLOW-RECORD-1
flow record R1-FLOW-RECORD-1:
Description: Used for basic traffic analysis
No. of users: 0
Total field space: 8 bytes
Fields:
match ipv4 destination address
collect interface input
Use the show running-config flow record command to show the flow record configuration in the running configuration, as shown in Example 11-17.
Example 11-17 show running-config flow record Command Output
R1# show running-config flow record
Current configuration:
!
flow record R1-FLO
W-RECORD-1
description Used for basic traffic analysis
match ipv4 destination address
collect interface input
!
The following are the steps required to configure a flow monitor for IPv4 or IPv6 implementations. In the following examples, a flow monitor is configured for the previously configured flow record.
Step 1. Log in to your router and enter into enable mode with the enable command:
R1>enable
Step 2. Enter into configuration mode with the configure terminal command:
R1# configure terminal
Enter configuration commands, one per line. End with CNTL/Z.
Step 3. Create a flow monitor with the flow monitor command. In this example, the flow monitor is called R1-FLOW-MON-1:
R1(config)# flow monitor R1-FLOW-MON-1
Step 4. (Optional) Enter a description for the new flow monitor:
R1(config-flow-monitor)# description monitor for IPv4 traffic in NY
Step 5. Identify the record for the flow monitor:
R1(config-flow-monitor)# record netflow R1-FLOW-RECORD-1
In the following example, the record ? command is used to see all the flow monitor record options:
R1(config-flow-monitor)# record ?
R1-FLOW-RECORD-1 Used for basic traffic analysis
netflow Traditional NetFlow collection schemes
netflow-original Traditional IPv4 input NetFlow with origin ASs
Step 6. Exit configuration mode with the end command and return to privileged EXEC mode:
R1(config-flow-record)# end
You can use the show flow monitor command to show the status and configured parameters for the flow monitor, as shown in Example 11-18.
Example 11-18 show flow monitor Command Output
R1# show flow monitor
Flow Monitor R1-FLOW-MON-1:
Description: monitor for IPv4 traffic in NY
Flow Record: R1-FLOW-RECORD-1
Cache:
Type: normal (Platform cache)
Status: not allocated
Size: 200000 entries
Inactive Timeout: 15 secs
Active Timeout: 1800 secs
Update Timeout: 1800 secs
Use the show running-config flow monitor command to display the flow monitor configuration in the running configuration, as shown in Example 11-19.
Example 11-19 show running-config flow monitor Command Output
R1# show running-config flow monitor
Current configuration:
!
flow monitor R1-FLOW-MON-1
description monitor for IPv4 traffic in NY
record R1-FLOW-RECORD-1
cache entries 200000
Complete the following steps to configure a flow exporter for the flow monitor to export the data that is collected by NetFlow to a remote system for further analysis and storage. This is an optional step. IPv4 and IPv6 are supported for flow exporters.
Flow exporters use UDP as the transport protocol and use the NetFlow v9 export format. Each flow exporter supports only one destination. If you want to export the data to multiple destinations, you must configure multiple flow exporters and assign them to the flow monitor.
Step 1. Log in to the router and enter into enable and configuration mode, as you learned in previous steps.
Step 2. Create a flow exporter with the flow exporter command. In this example, the exporter’s name is NC-EXPORTER-1:
R1(config)# flow exporter NC-EXPORTER-1
Step 3. (Optional) Enter a description for the exporter:
R1(config-flow-exporter)# description exports to North Carolina Collector
Step 4. Configure the export protocol using the export-protocol command. In this example, NetFlow v9 is used. You can also configure legacy NetFlow v5 with the netflow-v5 keyword or IPFIX with the ipfix keyword. IPFIX support was added in Cisco IOS Software Release 15.2(4)M and Cisco IOS XE Release 3.7S:
R1(config-flow-exporter)# export-protocol netflow-v9
Step 5. Enter the IP address of the destination host with the destination command. In this example, the destination host is 10.10.10.123:
R1(config-flow-exporter)# destination 10.10.10.123
Step 6. You can configure the UDP port used by the flow exporter with the transport udp command. The default is UDP port 9995.
Step 7. Exit the Flexible NetFlow flow monitor configuration mode with the exit command and specify the name of the exporter in the flow monitor:
R1(config)# flow monitor R1-FLOW-MON-1
R1(config-flow-monitor)# exporter NC-EXPORTER-1
You can use the show flow exporter command to view the configured options for the Flexible NetFlow exporter, as demonstrated in Example 11-20.
Example 11-20 show flow exporter Command Output
R1# show flow exporter
Flow Exporter NC-EXPORTER-1:
Description: exports to North Carolina Collector
Export protocol: NetFlow Version 9
Transport Configuration:
Destination IP address: 10.10.10.123
Source IP address: 209.165.200.225
Transport Protocol: UDP
Destination Port: 9995
Source Port: 55939
DSCP: 0x0
TTL: 255
Output Features: Used
You can use the show running-config flow exporter command to view the flow exporter configuration in the command-line interface (CLI), as demonstrated in Example 11-21.
Example 11-21 show running-config flow exporter Command Output
R1# show running-config flow exporter
Current configuration:
!
flow exporter NC-EXPORTER-1
description exports to North Carolina Collector
destination 10.10.10.123
You can use the show flow monitor name R1-FLOW-MON-1 cache format record command to display the status and flow data in the NetFlow cache for the flow monitor, as demonstrated in Example 11-22.
Example 11-22 show flow monitor name R1-FLOW-MON-1 cache format record Command Output
R1# show flow monitor name R1-FLOW-MON-1 cache format record
Cache type: Normal (Platform cache)
Cache size: 200000
Current entries: 4
High Watermark: 4
Flows added: 132
Flows aged: 42
- Active timeout ( 3600 secs) 3
- Inactive timeout ( 15 secs) 94
- Event aged 0
- Watermark aged 0
- Emergency aged 0
IPV4 DESTINATION ADDRESS: 10.10.20.5
ipv4 source address: 10.10.10.42
trns source port: 25
trns destination port: 25
counter bytes: 34320
counter packets: 1112
IPV4 DESTINATION ADDRESS: 10.10.1.2
ipv4 source address: 10.10.10.2
trns source port: 20
trns destination port: 20
counter bytes: 3914221
counter packets: 5124
IPV4 DESTINATION ADDRESS: 10.10.10.200
ipv4 source address: 10.20.10.6
trns source port: 32
trns destination port: 3073
counter bytes: 82723
counter packets: 8232
A flow monitor must be applied to at least one interface. To apply the flow monitor to an interface, use the ip flow monitor name input command in interface configuration mode, as demonstrated in Example 11-23.
Example 11-23 Applying the Flow Monitor to an Interface
R1(config)# interface GigabitEthernet0/0
R1(config-if)# ip flow monitor R1-FLOW-MON-1 input
In Example 11-23, the flow monitor R1-FLOW-MON-1 is applied to interface GigabitEthernet0/0.
Example 11-24 shows the complete configuration.
Example 11-24 Flexible NetFlow Configuration
flow record R1-FLOW-RECORD-1
description Used for basic traffic analysis
match ipv4 destination address
collect interface input
!
!
flow exporter NC-EXPORTER-1
description exports to North Carolina Collector
destination 10.10.10.123
!
!
flow monitor R1-FLOW-MON-1
description monitor for IPv4 traffic in NY
record R1-FLOW-RECORD-1
exporter NC-EXPORTER-1
cache entries 200000
!
interface GigabitEthernet0/0
ip address 209.165.200.233 255.255.255.248
ip flow monitor R1-FLOW-MON-1 input
Starting with Cisco IOS Software Version 15.2(4)M and Cisco IOS XE Software Version 3.7S, a feature was added to enable you to send export Flexible NetFlow packets using the IPFIX export protocol. This feature is enabled with the export-protocol ipfix subcommand under the flow exporter. Example 11-25 shows how the Flexible NetFlow IPFIX Export Format feature is enabled in the flow exporter configured in the previous example (Example 11-24).
Example 11-25 Flexible NetFlow Configuration
flow exporter NC-EXPORTER-1
description exports to North Carolina Collector
destination 10.10.10.123
export-protocol ipfix
Cisco Application Visibility and Control (AVC)
The Cisco Application Visibility and Control (AVC) solution is a collection of services available in several Cisco network infrastructure devices to provide application-level classification, monitoring, and traffic control. The Cisco AVC solution is supported by Cisco Integrated Services Routers Generation 2 (ISR G2), Cisco ASR 1000 Series Aggregation Service Routers (ASR 1000s), and Cisco Wireless LAN Controllers (WLCs). The following are the capabilities that Cisco AVC combines:
![]() Application recognition
Application recognition
![]() Metrics collection and exporting
Metrics collection and exporting
![]() Management and reporting systems
Management and reporting systems
![]() Network traffic control
Network traffic control
Cisco AVC uses existing Cisco Network-Based Application Recognition Version 2 (NBAR2) to provide deep packet inspection (DPI) technology to identify a wide variety of applications within the network traffic flow, using Layer 3 to Layer 7 data. NBAR works with QoS features to help ensure that the network bandwidth is best used to fulfill its main primary objectives. The benefits of combining these features include the ability to guarantee bandwidth to critical applications, limit bandwidth to other applications, drop selective packets to avoid congestion, and mark packets appropriately so that the network and the service provider’s network can provide QoS from end to end.
Cisco AVC includes an embedded monitoring agent that is combined with NetFlow to provide a wide variety of network metrics data. Examples of the type of metrics the monitoring agent collects include the following:
![]() TCP performance metrics such as bandwidth usage, response time, and latency
TCP performance metrics such as bandwidth usage, response time, and latency
![]() VoIP performance metrics such as packet loss and jitter
VoIP performance metrics such as packet loss and jitter
These metrics are collected and exported in NetFlow v9 or IPFIX format to a management and reporting system.
In Cisco IOS routers, metrics records are sent out directly from the data plane when possible to maximize system performance. However, if more complex processing is required on the Cisco AVC-enabled device, such as if the user requests that a router keep a history of exported records, the records may be exported from the route processor at a lower speed.
As previously mentioned, administrators can use QoS capabilities to control application prioritization. Protocol discovery features in Cisco AVC show you the mix of applications currently running on the network. This helps you define QoS classes and policies, such as how much bandwidth to provide to mission-critical applications and how to determine which protocols should be policed. Per-protocol bidirectional statistics are available, such as packet and byte counts, as well as bit rates.
After administrators classify the network traffic, they can apply the following QoS features:
![]() Class-based weighted fair queuing (CBWFQ) for guaranteed bandwidth
Class-based weighted fair queuing (CBWFQ) for guaranteed bandwidth
![]() Enforcing bandwidth limits using policing
Enforcing bandwidth limits using policing
![]() Marking for differentiated service downstream or from the service provider using the type of service (ToS) bits or DSCPs in the IP header
Marking for differentiated service downstream or from the service provider using the type of service (ToS) bits or DSCPs in the IP header
![]() Dropping policy to avoid congestion using weighted random early detection (WRED)
Dropping policy to avoid congestion using weighted random early detection (WRED)
Network Packet Capture
Full packet capture can be very useful to see exactly what’s happening on the network. In a perfect world, network security administrators would have full packet capture enabled everywhere. However, this is not possible because packet capture demands great system resources and engineering efforts, not only to collect the data and store it, but also to be able to analyze it. That is why, in many cases, it is better to obtain network metadata by using NetFlow, as previously discussed in this chapter.
Packet capture tools are called sniffers. Sometimes you hear the phrase “sniffer traces,” which means the same thing as “packet captures.” Packet captures are very helpful when someone wants to re-create an attack scenario or when doing network forensics. Logging all packets that come and leave the network may be possible with proper filtering, storage, indexing, and recall capabilities. You can also opt for a rolling or constant packet capture deployment, with the option of searching historical data in more long-term storage. Broadcast, multicast, and other chatty network protocols can also be filtered to reduce the total size packet captures.
Encryption can also cause problems when analyzing data in packet captures, because you cannot see the actual payload of the packet. The following are some pros and cons of full packet capture:
![]() Packet captures provide a full, historical record of a network transaction or an attack. It is important to recognize that no other data source offers this level of detail.
Packet captures provide a full, historical record of a network transaction or an attack. It is important to recognize that no other data source offers this level of detail.
![]() Packet capture data requires understanding and analysis capabilities.
Packet capture data requires understanding and analysis capabilities.
![]() Collecting and storing packet captures takes a lot of resources. Depending on your environment, this can be fairly expensive.
Collecting and storing packet captures takes a lot of resources. Depending on your environment, this can be fairly expensive.
The following are a few examples of the many commercial and open source packet capture utilities (sniffers) available:
![]() tcpdump, which is an open source packet capture utility that runs on Linux and Mac OS X systems
tcpdump, which is an open source packet capture utility that runs on Linux and Mac OS X systems
![]() Wireshark, which is one of the most popular open source packet capture utilities used by many professionals
Wireshark, which is one of the most popular open source packet capture utilities used by many professionals
![]() Netscout enterprise packet capture solutions
Netscout enterprise packet capture solutions
![]() Solarwinds Deep Packet Inspection and Analysis
Solarwinds Deep Packet Inspection and Analysis
tcpdump
tcpdump is an open source packet capture utility that runs on Linux and Mac OS X systems. It provides good capabilities for capturing traffic to and from a specific host.
In Example 11-26, tcpdump is invoked to capture packets to and from cisco.com. The system that is connecting to cisco.com is 192.168.78.3.
Example 11-26 Example of tcpdump to cisco.com
bash-3.2$ sudo tcpdump host cisco.com
tcpdump: data link type PKTAP
tcpdump: verbose output suppressed, use -v or -vv for full protocol decode
listening on pktap, link-type PKTAP (Packet Tap), capture size 262144 bytes
02:22:03.626075 IP 192.168.78.3.59133 > www1.cisco.com.http: Flags [S], seq
1685307965, win 65535, options [mss 1460,nop,wscale 5,nop,nop,TS val 29606499 ecr
0,sackOK,eol], length 0
02:22:03.655776 IP www1.cisco.com.http > 192.168.78.3.59133: Flags [S.], seq
1635859801, ack 1685307966, win 32768, options [mss 1380], length 0
02:22:03.655795 IP 192.168.78.3.59133 > www1.cisco.com.http: Flags [.], ack 1, win
65535, length 0
02:22:06.044472 IP 192.168.78.3.59133 > www1.cisco.com.http: Flags [P.], seq 1:6, ack
1, win 65535, length 5: HTTP: get
02:22:06.073700 IP www1.cisco.com.http > 192.168.78.3.59133: Flags [.], ack 6, win
32763, length 0
02:22:13.732096 IP 192.168.78.3.59133 > www1.cisco.com.http: Flags [P.], seq 6:8, ack
1, win 65535, length 2: HTTP
02:22:13.953418 IP www1.cisco.com.http > 192.168.78.3.59133: Flags [.], ack 8, win
32761, length 0
02:22:15.029650 IP 192.168.78.3.59133 > www1.cisco.com.http: Flags [P.], seq 8:9, ack
1, win 65535, length 1: HTTP
02:22:15.059947 IP www1.cisco.com.http > 192.168.78.3.59133: Flags [P.], seq 1:230,
ack 9, win 32768, length 229: HTTP
02:22:15.060017 IP 192.168.78.3.59133 > www1.cisco.com.http: Flags [.], ack 230, win
65535, length 0
02:22:15.089414 IP www1.cisco.com.http > 192.168.78.3.59133: Flags [F.], seq 230, ack
9, win 5840, length 0
02:22:15.089441 IP 192.168.78.3.59133 > www1.cisco.com.http: Flags [.], ack 231, win
65535, length 0
02:22:15.089527 IP 192.168.78.3.59133 > www1.cisco.com.http: Flags [F.], seq 9, ack
231, win 65535, length 0
02:22:15.119438 IP www1.cisco.com.http > 192.168.78.3.59133: Flags [.], ack 10, win
5840, length 0
In Example 11-26, you can see high-level information about each packet that was part of the transaction. On the other hand, you can obtain more detailed information by using the –nnvvXSs 1514 option, as demonstrated in Example 11-27.
Example 11-27 Example of tcpdump to cisco.com Collecting the Full Packet
bash-3.2$ sudo tcpdump -nnvvXSs 1514 host cisco.com
tcpdump: data link type PKTAP
tcpdump: listening on pktap, link-type PKTAP (Packet Tap), capture size 1514 bytes
02:29:32.277832 IP (tos 0x10, ttl 64, id 36161, offset 0, flags [DF], proto TCP (6),
length 64, bad cksum 0 (->5177)!)
192.168.78.3.59239 > 72.163.4.161.80: Flags [S], cksum 0x5c22 (incorrect ->
0x93ec), seq 1654599046, win 65535, options [mss 1460,nop,wscale 5,nop,nop,TS val
30002554 ecr 0,sackOK,eol], length 0
0x0000: 188b 9dad 79c4 ac87 a318 71e1 0800 4510 ....y.....q...E.
0x0010: 0040 8d41 4000 4006 0000 c0a8 4e03 48a3 [email protected]@[email protected].
0x0020: 04a1 e767 0050 629f 2d86 0000 0000 b002 ...g.Pb.-.......
0x0030: ffff 5c22 0000 0204 05b4 0103 0305 0101 .."............
0x0040: 080a 01c9 cd7a 0000 0000 0402 0000 .....z........
02:29:32.308046 IP (tos 0x0, ttl 243, id 28770, offset 0, flags [none], proto TCP (6),
length 44)
72.163.4.161.80 > 192.168.78.3.59239: Flags [S.], cksum 0xca59 (correct), seq
1699681519, ack 1654599047, win 32768, options [mss 1380], length 0
0x0000: ac87 a318 71e1 188b 9dad 79c4 0800 4500 ....q.....y...E.
0x0010: 002c 7062 0000 f306 fb79 48a3 04a1 c0a8 .,pb.....yH.....
0x0020: 4e03 0050 e767 654f 14ef 629f 2d87 6012 N..P.geO..b.-.'.
0x0030: 8000 ca59 0000 0204 0564 ...Y.....d
02:29:32.308080 IP (tos 0x10, ttl 64, id 62245, offset 0, flags [DF], proto TCP (6),
length 40, bad cksum 0 (->ebaa)!)
192.168.78.3.59239 > 72.163.4.161.80: Flags [.], cksum 0x5c0a (incorrect ->
0x61c7), seq 1654599047, ack 1699681520, win 65535, length 0
0x0000: 188b 9dad 79c4 ac87 a318 71e1 0800 4510 ....y.....q...E.
0x0010: 0028 f325 4000 4006 0000 c0a8 4e03 48a3 .(.%@[email protected].
0x0020: 04a1 e767 0050 629f 2d87 654f 14f0 5010 ...g.Pb.-.eO..P.
0x0030: ffff 5c0a 0000 .....
02:29:35.092892 IP (tos 0x10, ttl 64, id 42537, offset 0, flags [DF], proto TCP (6),
length 45, bad cksum 0 (->38a2)!)
192.168.78.3.59239 > 72.163.4.161.80: Flags [P.], cksum 0x5c0f (incorrect ->
0x7c47), seq 1654599047:1654599052, ack 1699681520, win 65535, length 5: HTTP, length: 5
get
0x0000: 188b 9dad 79c4 ac87 a318 71e1 0800 4510 ....y.....q...E.
0x0010: 002d a629 4000 4006 0000 c0a8 4e03 48a3 .-.)@[email protected].
0x0020: 04a1 e767 0050 629f 2d87 654f 14f0 5018 ...g.Pb.-.eO..P.
0x0030: ffff 5c0f 0000 6765 740d 0a .....get..
02:29:35.123164 IP (tos 0x0, ttl 243, id 34965, offset 0, flags [none], proto TCP (6),
length 40)
72.163.4.161.80 > 192.168.78.3.59239: Flags [.], cksum 0xe1c6 (correct), seq
1699681520, ack 1654599052, win 32763, length 0
0x0000: ac87 a318 71e1 188b 9dad 79c4 0800 4500 ....q.....y...E.
0x0010: 0028 8895 0000 f306 e34a 48a3 04a1 c0a8 .(.......JH.....
0x0020: 4e03 0050 e767 654f 14f0 629f 2d8c 5010 N..P.geO..b.-.P.
0x0030: 7ffb e1c6 0000 ......
***output omitted for brevity***
There are many different parameters and options in tcpdump, which you learn about in more detail in the tcpdump man page (which can be accessed by the man tcpdump command.)
TIP
The following site provides a good list of examples when using tcpdump: https://danielmiessler.com/study/tcpdump.
Wireshark
Wireshark is one of the most popular open source packet analyzers because it supports many features and a huge list of common and uncommon protocols with an easy-to-navigate GUI. Wireshark can be downloaded from http://www.wireshark.org. The installation setup is very simple, and within a few clicks, you will be up and running with Wireshark on a Mac OS X or Microsoft Windows machine.
Wireshark provides the user with really good filtering capability. Filters in Wireshark are like conditionals that software developers use while writing code. For example, you can filter by source or destination IP address, protocol, and so on. Wireshark provides the following two types of filtering options:
![]() Capture filters: Used before starting the capture.
Capture filters: Used before starting the capture.
![]() Display filters: Used during the analysis of captured packets. Display filters can also be used while capturing because they do not limit the packets being captured; they just restrict the visible number of packets.
Display filters: Used during the analysis of captured packets. Display filters can also be used while capturing because they do not limit the packets being captured; they just restrict the visible number of packets.
Figure 11-26 shows a screen capture of Wireshark.

TIP
If you are new to packet capture and sniffing, Wireshark’s website has several sample packet captures you can play with. Go to https://wiki.wireshark.org/SampleCaptures.
Cisco Prime Infrastructure
Cisco Prime Infrastructure is a network management platform that you can use to configure and monitor many network infrastructure devices in your network. It provides network administrators with a single solution for provisioning, monitoring, optimizing, and troubleshooting both wired and wireless devices. This platform comes with many dashboards and graphical interfaces that can be used to monitor anomalies in the network. It also provides a RESTful API so you can integrate it with other systems you may use in your network operations center (NOC) or security operations center (SOC).
The Prime Infrastructure platform is organized into a lifecycle workflow that includes the following high-level task areas:
![]() Dashboards: Provide a quick view of devices, performance information, and various incidents.
Dashboards: Provide a quick view of devices, performance information, and various incidents.
![]() Monitor area: Used to monitor your network on a daily basis and perform other day-to-day or ad hoc operations related to network device inventory and configuration management.
Monitor area: Used to monitor your network on a daily basis and perform other day-to-day or ad hoc operations related to network device inventory and configuration management.
![]() Configuration: Allows you to create reusable design patterns, such as configuration templates, in the Design area. You may use predefined templates or create your own. Patterns and templates are used in the deployment phase of the lifecycle.
Configuration: Allows you to create reusable design patterns, such as configuration templates, in the Design area. You may use predefined templates or create your own. Patterns and templates are used in the deployment phase of the lifecycle.
![]() Inventory: Allows you to perform all device management operations such as adding devices, running discovery, managing software images, configuring device archives, and auditing configuration changes on devices.
Inventory: Allows you to perform all device management operations such as adding devices, running discovery, managing software images, configuring device archives, and auditing configuration changes on devices.
![]() Maps: Allows you to display network topology and wireless maps.
Maps: Allows you to display network topology and wireless maps.
![]() Services: Allows you to access mobility services, AVC services, and IWAN features.
Services: Allows you to access mobility services, AVC services, and IWAN features.
![]() Report: Allows you to create reports, view saved report templates, and run scheduled reports.
Report: Allows you to create reports, view saved report templates, and run scheduled reports.
![]() Administration: Used for making system-wide configurations and data collection settings as well as managing access control.
Administration: Used for making system-wide configurations and data collection settings as well as managing access control.
Figure 11-27 shows the overview dashboard of Cisco Prime Infrastructure.

In Figure 11-27, you can see different widgets that include information about the overall network health and high-level statistics, including the following:
![]() Reachability metrics for ICMP, APs, and controllers
Reachability metrics for ICMP, APs, and controllers
![]() Summary metrics for all alarms and rogue alarms
Summary metrics for all alarms and rogue alarms
![]() Metrics for system health, WAN link health, and service health
Metrics for system health, WAN link health, and service health
![]() Coverage areas, including links to APs not assigned to a map
Coverage areas, including links to APs not assigned to a map
![]() Client counts by association/authentication
Client counts by association/authentication
![]() Top CPU, interface, and memory utilization
Top CPU, interface, and memory utilization
![]() Network topology
Network topology
![]() Summary metrics for all alarms and rogue alarms
Summary metrics for all alarms and rogue alarms
![]() Metrics for system health, WAN link health, and service health
Metrics for system health, WAN link health, and service health
![]() Alarms graph
Alarms graph
![]() Top alarm and event type graphs
Top alarm and event type graphs
![]() Top N applications
Top N applications
![]() Top N clients
Top N clients
![]() Top N devices with the most alarms
Top N devices with the most alarms
![]() Top N servers
Top N servers
Figure 11-28 shows the devices managed by the Cisco Prime Infrastructure platform.

Figure 11-29 shows the Cisco Prime Infrastructure incidents dashboard.

The Incidents dashboard illustrated in Figure 11-29 includes widgets that report the following:
![]() Alarm summary metrics for all alarms and rogue alarms
Alarm summary metrics for all alarms and rogue alarms
![]() Health metrics for system health, WAN link health, and service health
Health metrics for system health, WAN link health, and service health
![]() Alarms graphs
Alarms graphs
![]() Top alarm and event type graphs
Top alarm and event type graphs
In Cisco Prime Infrastructure, you can run a report to determine whether any Cisco device is affected by a vulnerability disclosed by the Cisco Product Security Incident Response Team (PSIRT) by going to Reports, PSIRT and EoX. On that screen, you can also see whether any field notices also affect any of your devices, as well as create reports about whether any Cisco device hardware or software in your network has reached its end of life (EoL). This can help you determine product upgrade and substitution options. In Figure 11-30, the PSIRT report shows many devices affected by many vulnerabilities published by the Cisco PSIRT. These types of reports accelerate the assessment of known vulnerabilities in an infrastructure in a very effective manner.

Host Telemetry
Telemetry from user endpoints, mobile devices, servers, and applications is also crucial when protecting, detecting, and reacting to security incidents and attacks. The following sections go over several examples of this type of telemetry and their use.
Logs from User Endpoints
Logs from user endpoints not only can help you for attribution if they are part of a malicious activity, but also for victim identification. However, how do you determine where an endpoint and user are located? If you do not have sophisticated host or network management systems, it’s very difficult to track every useful attribute about user endpoints. This is why it is important what type of telemetry and metadata you collect as well as how you keep such telemetry and metadata updated and how you perform checks against it.
The following are some useful attributes you should seek to collect:
![]() Location based on just the IP address of the endpoint or DNS hostname
Location based on just the IP address of the endpoint or DNS hostname
![]() Application logs
Application logs
![]() Processes running on the machine
Processes running on the machine
You can correlate those with VPN and DHCP logs. However, these can present their own challenges because of the rapid turnover of network addresses associated with dynamic addressing protocols. For example, a user may authenticate to a VPN server, drop his connection, re-authenticate, and end up with a completely new address.
The level of logs you want to collect from each and every user endpoint depends on many environmental factors, such as storage, network bandwidth, and also the ability to analyze such logs. In many cases, more detailed logs are used in forensics investigations.
For instance, let’s say you are doing a forensics investigation on an Apple Mac OS X device; in that case, you may need to collect hard evidence on everything that happened on that device. In the case of a daily monitoring of endpoint machines, you will not be able to inspect and collect information about the device and the user in the same manner you would when doing a forensics investigation. For example, for that same Mac OS X machine, you may want to take a top-down approach while investigating files, beginning at the root directory, and then move into the User directory, which may have a majority of the forensic evidence.
Another example is dumping all the account information on the system. Mac OS X contains a SQLite database for the accounts used on the system. This includes information such as email addresses, social media usernames, and descriptions of the items.
On Windows, events are collected and stored by the Event Logging Service. This keeps events from different sources in event logs and includes chronological information. On the other hand, the type of data that will be stored in an event log is dependent on system configuration and application settings. Windows event logs provide a lot of data for investigators. Some items of the event log record, such as Event ID and Event Category, help security professionals get information about a certain event. The Windows Event Logging Service can be configured to store very granular information about numerous objects on the system. Almost any resource of the system can be considered an object, thus allowing security professionals to detect any requests for unauthorized access to resources.
Typically, what you do in a security operations center (SOC) is monitor logs sent by endpoint systems to a security information management (SIM) and security event management (SEM) system—otherwise known as a SIEM system. You already learned one example of a SIEM: Splunk.
A SIM mainly provides a way to digest large amount of log data, making it easy to search through collected data. SEMs are designed to consolidate and correlate large amounts of event data so that the security analyst or network administrator can prioritize events and react appropriately. Numerous SIEM vendors tend to specialize in SIM or SEM despite the fact that they may offer both event and information management features. SIEM solutions can collect logs from popular host security products, including the following:
![]() Personal firewalls
Personal firewalls
![]() Intrusion detection/prevention systems
Intrusion detection/prevention systems
![]() Antivirus or antimalware
Antivirus or antimalware
![]() Web security logs (from a web security appliance)
Web security logs (from a web security appliance)
![]() Email security logs (from an email security appliance)
Email security logs (from an email security appliance)
![]() Advanced malware protection logs
Advanced malware protection logs
There are many other host security features, such as data-loss prevention and VPN clients. For example, the Cisco AnyConnect Secure Mobility Client includes the Network Visibility Module (NVM), which is designed to monitor application use by generating IPFIX flow information.
The AnyConnect NVM collects the endpoint telemetry information, including the following:
![]() The endpoint device, irrespective of its location
The endpoint device, irrespective of its location
![]() The user logged in to the endpoint
The user logged in to the endpoint
![]() The application that generates the traffic
The application that generates the traffic
![]() The network location the traffic was generated on
The network location the traffic was generated on
![]() The destination (FQDN) to which this traffic was intended
The destination (FQDN) to which this traffic was intended
The AnyConnect NVM exports the flow records to a collector (such as the Cisco Lancope Stealthwatch system). You can also configure NVM to get notified when the VPN state changes to connected and when the endpoint is in a trusted network. NVM collects and exports the following information:
![]() Source IP address
Source IP address
![]() Source port
Source port
![]() Destination IP address
Destination IP address
![]() Destination port
Destination port
![]() A Universally Unique Identifier (UDID) that uniquely identifies the endpoint corresponding to each flow
A Universally Unique Identifier (UDID) that uniquely identifies the endpoint corresponding to each flow
![]() Operating system (OS) name
Operating system (OS) name
![]() OS version
OS version
![]() System manufacturer
System manufacturer
![]() System type (x86 or x64)
System type (x86 or x64)
![]() Process account, including the authority/username of the process associated with the flow
Process account, including the authority/username of the process associated with the flow
![]() Parent process associated with the flow
Parent process associated with the flow
![]() The name of the process associated with the flow
The name of the process associated with the flow
![]() A SHA-256 hash of the process image associated with the flow
A SHA-256 hash of the process image associated with the flow
![]() A SHA-256 hash of the image of the parent process associated with the flow
A SHA-256 hash of the image of the parent process associated with the flow
![]() The DNS suffix configured on the interface associated with the flow on the endpoint
The DNS suffix configured on the interface associated with the flow on the endpoint
![]() The FQDN or hostname that resolved to the destination IP on the endpoint
The FQDN or hostname that resolved to the destination IP on the endpoint
![]() The total number of incoming and outgoing bytes on that flow at Layer 4 (payload only)
The total number of incoming and outgoing bytes on that flow at Layer 4 (payload only)
Mobile devices in some cases are treated differently because of their dynamic nature and limitations such as system resources and restrictions. Many organizations use Mobile Device Management (MDM) platforms to manage policies on mobile devices and to monitor such devices. The policies can be applied using different techniques—for example, by using a sandbox that creates an isolated environment that limits what applications can be accessed and controls how systems gain access to the environment. In other scenarios, organizations install an agent on the mobile device to control applications and to issue commands (for example, to remotely wipe sensitive data). Typically, MDM systems include the following features:
![]() Mandatory password protection
Mandatory password protection
![]() Jailbreak detection
Jailbreak detection
![]() Remote wipe
Remote wipe
![]() Remote lock
Remote lock
![]() Device encryption
Device encryption
![]() Data encryption
Data encryption
![]() Geolocation
Geolocation
![]() Malware detection
Malware detection
![]() VPN configuration and management
VPN configuration and management
![]() Wi-Fi configuration and management
Wi-Fi configuration and management
The following are a few MDM vendors:
![]() AirWatch
AirWatch
![]() MobileIron
MobileIron
![]() Citrix
Citrix
![]() Good Technology
Good Technology
MDM solutions from these vendors typically have the ability to export logs natively to Splunk or other third-party reporting tools such as Tableau, Crystal Reports, and QlikView.
You can also monitor user activity using the Cisco Identity Services Engine (ISE). The Cisco ISE reports are used with monitoring and troubleshooting features to analyze trends and to monitor user activities from a central location. Think about it: Identity management systems such as the Cisco ISE keep the keys to the kingdom. It is very important to monitor not only user activity, but also the activity on the Cisco ISE itself.
The following are a few examples of user and endpoint reports you can run on the Cisco ISE:
![]() AAA Diagnostics reports provide details of all network sessions between Cisco ISE and users. For example, you can use user authentication attempts.
AAA Diagnostics reports provide details of all network sessions between Cisco ISE and users. For example, you can use user authentication attempts.
![]() The RADIUS Authentications report enables a security analyst to obtain the history of authentication failures and successes.
The RADIUS Authentications report enables a security analyst to obtain the history of authentication failures and successes.
![]() The RADIUS Errors report enables security analysts to check for RADIUS requests dropped by the system.
The RADIUS Errors report enables security analysts to check for RADIUS requests dropped by the system.
![]() The RADIUS Accounting report tells you how long users have been on the network.
The RADIUS Accounting report tells you how long users have been on the network.
![]() The Authentication Summary report is based on the RADIUS authentications. It tells the administrator or security analyst about the most common authentications and the reason for any authentication failures.
The Authentication Summary report is based on the RADIUS authentications. It tells the administrator or security analyst about the most common authentications and the reason for any authentication failures.
![]() The OCSP Monitoring Report allows you to get the status of the Online Certificate Status Protocol (OCSP) services and provides a summary of all the OCSP certificate validation operations performed by Cisco ISE.
The OCSP Monitoring Report allows you to get the status of the Online Certificate Status Protocol (OCSP) services and provides a summary of all the OCSP certificate validation operations performed by Cisco ISE.
![]() The Administrator Logins report provides an audit trail of all administrator logins. This can be used in conjunction with the Internal Administrator Summary report to verify the entitlement of administrator users.
The Administrator Logins report provides an audit trail of all administrator logins. This can be used in conjunction with the Internal Administrator Summary report to verify the entitlement of administrator users.
![]() The Change Configuration Audit report provides details about configuration changes within a specified time period. If you need to troubleshoot a feature, this report can help you determine if a recent configuration change contributed to the problem.
The Change Configuration Audit report provides details about configuration changes within a specified time period. If you need to troubleshoot a feature, this report can help you determine if a recent configuration change contributed to the problem.
![]() The Client Provisioning report indicates the client-provisioning agents applied to particular endpoints. You can use this report to verify the policies applied to each endpoint to verify whether the endpoints have been correctly provisioned.
The Client Provisioning report indicates the client-provisioning agents applied to particular endpoints. You can use this report to verify the policies applied to each endpoint to verify whether the endpoints have been correctly provisioned.
![]() The Current Active Sessions report enables you to export a report with details about who was currently on the network within a specified time period.
The Current Active Sessions report enables you to export a report with details about who was currently on the network within a specified time period.
![]() The Guest Activity report provides details about the websites that guest users are visiting. You can use this report for security-auditing purposes to demonstrate when guest users accessed the network and what they did on it.
The Guest Activity report provides details about the websites that guest users are visiting. You can use this report for security-auditing purposes to demonstrate when guest users accessed the network and what they did on it.
![]() The Guest Accounting report is a subset of the RADIUS Accounting report. All users assigned to the Activated Guest or Guest Identity group appear in this report.
The Guest Accounting report is a subset of the RADIUS Accounting report. All users assigned to the Activated Guest or Guest Identity group appear in this report.
![]() The Endpoint Protection Service Audit report is based on the RADIUS accounting. It displays historical reporting of all network sessions for each endpoint.
The Endpoint Protection Service Audit report is based on the RADIUS accounting. It displays historical reporting of all network sessions for each endpoint.
![]() The Mobile Device Management report provides details about integration between Cisco ISE and the external Mobile Device Management (MDM) server.
The Mobile Device Management report provides details about integration between Cisco ISE and the external Mobile Device Management (MDM) server.
![]() The Posture Detail Assessment report provides details about posture compliancy for a particular endpoint. If an endpoint previously had network access and then suddenly was unable to access the network, you can use this report to determine whether a posture violation occurred.
The Posture Detail Assessment report provides details about posture compliancy for a particular endpoint. If an endpoint previously had network access and then suddenly was unable to access the network, you can use this report to determine whether a posture violation occurred.
![]() The Profiled Endpoint Summary report provides profiling details about endpoints that are accessing the network.
The Profiled Endpoint Summary report provides profiling details about endpoints that are accessing the network.
Logs from Servers
Just like with endpoints, it is very important that you analyze server logs. This can be done by analyzing simple syslog messages, or more specific web or file server logs. It does not matter whether the server is a physical device or a virtual machine.
For instance, on Linux/UNIX-based systems, you can review and monitor logs stored under /var/log. Example 11-28 shows a snippet of the syslog of a Linux-based system where you can see postfix database messages on a system running the gitlab code repository.
Example 11-28 Syslog on a Linux system
Sep 4 17:12:43 odin postfix/qmgr[2757]: 78B9C1120595: from=<gitlab@odin>, size=1610,
nrcpt=1 (queue active)
Sep 4 17:13:13 odin postfix/smtp[5812]: connect to gmail-smtp-in.l.google.
com[173.194.204.27]:25: Connection timed out
Sep 4 17:13:13 odin postfix/smtp[5812]: connect to gmail-smtp-in.l.google.
com[2607:f8b0:400d:c07::1a]:25: Network is unreachable
Sep 4 17:13:43 odin postfix/smtp[5812]: connect to alt1.gmail-smtp-in.l.google.
com[64.233.190.27]:25: Connection timed out
Sep 4 17:13:43 odin postfix/smtp[5812]: connect to alt1.gmail-smtp-in.l.google.
com[2800:3f0:4003:c01::1a]:25: Network is unreachable
Sep 4 17:13:43 odin postfix/smtp[5812]: connect to alt2.gmail-smtp-in.l.google.
com[2a00:1450:400b:c02::1a]:25: Network is unreachable
You can also check the audit.log for authentication and user session information. Example 11-29 shows a snippet of the auth.log on a Linux system, where the user (omar) initially typed his password incorrectly while attempting to connect to the server (odin) via SSH.
Example 11-29 audit.log on a Linux System
Sep 4 17:21:32 odin sshd[6414]: Failed password for omar from 192.168.78.3 port 52523
ssh2
Sep 4 17:21:35 odin sshd[6422]: pam_ecryptfs: Passphrase file wrapped
Sep 4 17:21:36 odin sshd[6414]: Accepted password for omar from 192.168.78.3 port
52523 ssh2
Sep 4 17:21:36 odin sshd[6414]: pam_unix(sshd:session): session opened for user omar
by (uid=0)
Sep 4 17:21:36 odin systemd: pam_unix(systemd-user:session): session opened for user
omar by (uid=0)
Web server logs are also important and should be monitored. Of course, the amount of activity on these logs can be very overwhelming—thus the need for robust SIEM and log management platforms such as Splunk, Naggios, and others. Example 11-30 shows a snippet of a web server (Apache httpd) log.
Example 11-30 Apache httpd Log on a Linux System
192.168.78.167 - - [02/Apr/2016:23:32:46 -0400] "GET / HTTP/1.1" 200 3525 "-"
"Mozilla/5.0 (Macintosh; Intel Mac OS X 10_11_3) AppleWebKit/537.36 (KHTML, like
Gecko) Chrome/48.0.2564.116 Safari/537.36"
192.168.78.167 - - [02/Apr/2016:23:32:46 -0400] "GET /icons/ubuntu-logo.png HTTP/1.1"
200 3689 "http://192.168.78.8/" "Mozilla/5.0 (Macintosh; Intel Mac OS X 10_11_3)
AppleWebKit/537.36 (KHTML, like Gecko) Chrome/48.0.2564.116 Safari/537.36"
192.168.78.167 - - [02/Apr/2016:23:32:47 -0400] "GET /favicon.ico HTTP/1.1" 404 503
"http://192.168.78.8/" "Mozilla/5.0 (Macintosh; Intel Mac OS X 10_11_3) AppleWeb
Kit/537.36 (KHTML, like Gecko) Chrome/48.0.2564.116 Safari/537.36"
192.168.78.167 - - [03/Apr/2016:00:37:11 -0400] "GET / HTTP/1.1" 200 3525 "-"
"Mozilla/5.0 (Macintosh; Intel Mac OS X 10_11_3) AppleWebKit/537.36 (KHTML, like
Gecko) Chrome/48.0.2564.116 Safari/537.36"
Exam Preparation Tasks
Review All Key Topics
Review the most important topics in the chapter, noted with the Key Topic icon in the outer margin of the page. Table 11-13 lists these key topics and the page numbers on which each is found.

Complete Tables and Lists from Memory
Print a copy of Appendix B, “Memory Tables,” (found on the book website), or at least the section for this chapter, and complete the tables and lists from memory. Appendix C, “Memory Tables Answer Key,” also on the website, includes completed tables and lists to check your work.
Define Key Terms
Define the following key terms from this chapter, and check your answers in the glossary:
NetFlow
tcpdump
Wireshark
Q&A
The answers to these questions appear in Appendix A, “Answers to the ‘Do I Know This Already?’ Quizzes and Q&A Questions.” For more practice with exam format questions, use the exam engine on the website.
1. Which of the following are open source packet-capture software? (Select all that apply.)
a. WireMark
b. Wireshark
c. tcpdump
d. udpdump
2. Which of the following is a big data analytics technology that’s used by several frameworks in security operation centers?
a. Hadoop
b. Next-generation firewalls
c. Next-generation IPS
d. IPFIX
3. Which of the following is not a host-based telemetry source?
a. Personal firewalls
b. Intrusion detection/prevention
c. Antivirus or antimalware
d. Router syslogs
4. Why can encryption cause problems when you’re analyzing data in packet captures?
a. Because encryption causes fragmentation
b. Because encryption causes packet loss
c. Because you cannot see the actual payload of the packet
d. Because encryption adds overhead to the network, and infrastructure devices cannot scale
5. What is Cisco Prime Infrastructure?
a. A next-generation firewall
b. A network management platform you can use to configure and monitor many network infrastructure devices in your network
c. A NetFlow generation appliance
d. A next-generation IPS solution
6. In what location (directory) do Linux-based systems store most of their logs, including syslog?
a. /opt/logs
b. /var/log
c. /etc/log
d. /dev/log
7. Cisco AVC uses which of the following technologies to provide deep packet inspection (DPI) technology to identify a wide variety of applications within the network traffic flow, using Layer 3 to Layer 7 data?
a. Cisco NetFlow
b. IPFIX
c. Cisco AMP
d. Cisco Network-Based Application Recognition Version 2 (NBAR2)
8. NBAR works with which of the following technologies to help ensure that the network bandwidth is best used to fulfill its main primary objectives?
a. Quality of Service (QoS)
b. IPFIX
c. Snort
d. Antimalware software
9. Traditional Cisco NetFlow records are usually exported via which of the following methods?
a. IPFIX records
b. TLS packets
c. UDP packets
d. HTTPS packets
10. Which of the following is not a NetFlow version?
a. Version 5
b. Version 7
c. Version 9
d. IPFIX