
15
Early Detection of Type 2 Diabetes Mellitus Using Deep Neural Network–Based Model
Varun Sapra1 and Luxmi Sapra2*
1Department of Systemics, University of Petroleum and Energy Studies, Dehradun, India
2Dev Bhoomi Institute of Technology, Dehradun, India
Abstract
According to International Diabetes Federation, 463 million people are diabetic worldwide. Due to change in lifestyle, the disease has effected many people drastically affecting the quality of life and now considered as a global threat. Diabetes is aggravated over time if not treated properly. People with diabetes are more vulnerable to the severe effects of the COVID-19. It can lead to more disease such as kidney disease, stroke, heart disease, and many more. It is essential to identify the disease in its early stage so that preventive steps can be taken. Early detection can recommend the lifestyle changes and medication, hence delay its progression and further complication. Due to digital revolution, health sector produces enormous amount of data in the form of patient history, pathological reports, images, prescription and health insurance claims, etc. Extracting knowledge from these kinds of data is still a challenge. Advancement in computation methods enables researches to uncover the hidden, interesting, and complex pattern from data. One of such computational method is machine learning. Different intelligent computational methods have been explored by researchers in last one decade. This chapter focuses on implementing deep neural network for early identification of diabetes mellitus. For this purpose, benchmark datasets available on UCI machine repository and Kaggle are explored. In this chapter, a deep neural network–based framework is suggested for early detection of disease. This framework can be an adjunct tool in clinical practices.
Keywords: Machine learning, diabetes, artificial intelligence, computational intelligence, UCI machine repository
15.1 Introduction
Diabetes is one of the most common diseases that is escalating at an alarming rate. As per one of the reports of the World Health Organization, it is one of the foremost causes of mortality and morbidity in the world and about 422 million people worldwide are suffering from diabetes and around 1.6 million people died in 2016 [1]. Diabetes is classified as type 1 and type 2 diabetes, where 5% to 10% of all diabetes cases that belong to type 1 and type 2 account for more than 90% of all cases with higher risks for people over age of 45 and overweight people [2]. Type 2 diabetes is considered as a chronic disease which arises due to the inability of the body to use insulin properly, which results in unusual blood sugar levels. In one of the reports published by India Today, almost 98 million people will suffer with type 2 diabetes by 2030 in India [3, 4], and according to the survey conducted by American Diabetes Foundation in 2015, diabetes mellitus (DM) was considered as one of the top 10 causes of death in the US [5].
There are no obvious clinical indications for the early identification of type 2 diabetes which is the main reason for ignorance and patients are not able to get medications at right times. Therefore, it is important to detect the disease early to prevent and treat type 2 DM. As per the medical experts, if the disease is discovered at an early stage, the chances of recovery will be greater and people can live happy and healthy life [6, 7]. Due to digital revolution and advancements in computation methods, various intelligent learning schemes have been used for early detection of disease.
Krishnan et al. [8] conducted a methodical review to predict the risk of DM after gestational DM (GDM). The authors used prognostic machine learning techniques and identified predisposing factors that can be considered as input variables to the applied methods to predict the risk of DM. Bayu et al. [9] in their research applied different machine learning methods like C4.5, naïve Bayes, IBk, and decision tree to obtain information from historical data. For experimental purpose, they have collected data from Mohammad Hoesin public hospital in Southern Sumatera. During their study, they identified few major attributes like smoker, gestational history, and plasma insulin that contribute significantly to the study. Dewangan and Pragati [10], in their study, implemented hybrid methods by combining two different techniques. They have implemented hybrid method with C4.5 and random forest and second method with multi-layer perceptron (MLP) and Bayes net classification model. They also emphasized on data partitioning for training and testing data, and how performance indicators changed a lot on the basis of the ratio of training and testing data size. In their study, they have used 85:15 ratio for training and testing. Their study revealed that the hybrid model with MLP and Bayes net classification performed better with accuracy of 81.89% than the other models used by them. Ban et al. in their study examined the importance of gene-gene interactions. The author investigated data from Korean cohort studies with 408 single-nucleotide polymorphisms (SNPs) in 87 genes. They used support vector machine (SVM) to evaluate the association between SNPs and type 2 diabetes with 10-fold cross-validation. With radial basis function (RBF) with 14 SNPs and 12 genes, they were able to achieve the prediction rate of 65.3%. Similarly, they achieved the prediction rate of 70.9% and 70.6% on subpopulation datasets of men and women with different SNP combinations [11]. Mohebbi et al. in their study proposed a novel algorithm based on simulated Continuous Glucose Monitoring (CGM) signals for the early detection of type 2 diabetes. They further implemented different machine learning techniques on the CGM signals. They implemented MLP, logistic regression, and convolutional neural network (CNN) and were able to achieve 77.5% accuracy with CNN [12]. Faruqui et al. in their work used deep learning-based model for the forecasting of next day glucose levels of the patients. They have used mobile tools for the collection of data from 10 obese type 2 diabetic patients over 6 months. Their proposed model was able to achieve a considerable accuracy of ±10% of the actual values [13]. Frimpong et al. suggested a feed forward network for the detection of type 2 diabetes. They have used Pima Indian diabetes dataset for the experimental purpose and their proposed model was able to achieve 97.27% and 96.09% accuracy for training and testing data, respectively [14].
15.2 Data Set
In this work, a deep neural network machine learning model has been suggested for early detection of DM. The data set used for experimental purpose is obtained from UCI machine repository [15].
There are a total of 520 number of instances and 17 features such as age, gender (Gen), polydipsia (POLYD), sudden weight loss (SWL), weakness (WK), polyphagia (POLYP), polyuria (PLOY), genital thrush (GT), itching (ITC), irritability (IRT), partial paresis (PR), muscle stiffness (MS), alopecia (AP), visual blurring (VB), delayed healing (DH), and obesity (OB), as shown in Table 15.1.
Table 15.1 Description of the dataset.
| S. no. | Attribute | Description | Value |
| 1. | AGE | Age of the subject in years | Min – 16, Max - 90 |
| 2. | GEN | Gender of the subject | Male (0), Female (1) |
| 3. | PLOY | Polyuria : frequent urination | (yes), (no) |
| 4. | POLYD | Polydipsia : excessive thirst | (yes), (no) |
| 5. | AP | Alopecia | (yes), (no) |
| 6. | SWL | Sudden weight loss | (yes), (no) |
| 7. | POLYP | Polyphagia : extreme hunger | (yes), (no) |
| 8. | GT | Genital thrush | (yes), (no) |
| 9. | WK | Weakness | (yes), (no) |
| 10. | VB | Visual blurring | (yes), (no) |
| 11. | PR | Partial paresis | (yes), (no) |
| 12. | IRT | Irritability | (yes), (no) |
| 13. | DH | Delayed healing | (yes), (no) |
| 14. | MS | Muscle stiffness | (yes), (no) |
| 15. | ITC | Itching | (yes), (no) |
| 16. | OB | Obesity | (yes), (no) |
| 17. | Class | Positive - 1 Negative - 0 |
15.2.1 Data Insights
The dataset contains records of 520 patients, out of which 328 were males and 192 were females. Figure 15.1 shows the ratio of males and females having type 2 diabetes. It is evident from the data under consideration that females are more prone to diabetes than men.
Figure 15.2 shows the ratio of obese and non-obese males and females having type 2 diabetes. It is clear from the data that obesity does not play a significant role in type 2 diabetes.
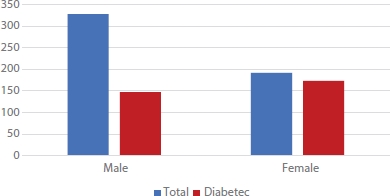
Figure 15.1 Ratio of number of males and females with type 2 diabetes.

Figure 15.2 Number of obese and non-obese males and females with type 2 diabetes.

Figure 15.3 Ratio of males and females having polyuria and suffering from type 2 diabetes.
Polyuria is considered as one of the most evident factor for the type 2 diabetes. It is considered as one of the key attributes that contributes maximum for the occurrence of type 2 diabetes in patients [16, 17]. Figure 15.3 shows the ratio of males and females with polyuria and positive for type 2 diabetes.
15.3 Feature Engineering
In medical domain, all the features are not relevant to the analysis and may contain redundancy. Large feature space may increase the computation time and complexity. It may contain a false correlation that hinders the learning process of an algorithm. Hence, choosing relevant features that contribute more to accurate prediction results in faster and accurate diagnosis of the disease [18]. Most of the researches used ranking methods because of its simplicity and their ability to rank features that has an influence on the target class. Information gain is widely used method for feature selection. It is a filter method that can be used for attribute selection [19]. It is based on evaluation of the gain of each feature with the perspective of the target class. It is defined as the amount of information provided by the attribute. In order to compute the information gain of the variable, entropy of the target variable is computed which requires frequency count of the target class. We implemented ranking by using information gain criteria. Table 15.2 presents the ranking of attributes obtained by information gain measure. Top 10 features are selected to construct the model. The features selected for modeling are polyuria, polydipsia, gender, sudden weight loss, partial paralysis, polyphagia, irritability, alopecia, visual blurring, and weakness.
Table 15.2 Weights of features with information gain measure.
| S. no. | Weight | Features |
| 1 | 0.362251 | Polyuria |
| 2 | 0.359056 | Polydipsia |
| 3 | 0.16342 | Gender |
| 4 | 0.148772 | Sudden weight loss |
| 5 | 0.144653 | Partial paresis |
| 6 | 0.087842 | Polyphagia |
| 7 | 0.072873 | Irritability |
| 8 | 0.051163 | Alopecia |
| 9 | 0.046606 | Visual blurring |
| 10 | 0.042666 | Weakness |
| 11 | 0.022394 | Age |
| 12 | 0.010973 | Muscle stiffness |
| 13 | 0.009046 | Genital thrush |
| 14 | 0.003851 | Obesity |
| 15 | 0.001595 | Delayed healing |
| 16 | 0.000129 | Itching |
The feature polyuria has the highest weightage and itching has the lowest weightage. As shown in Figure 15.4.
The correlation matrix displays the relationship between different attributes. The value in negative depicts negative correlation and in positive depicts positive correlation and zero depicts no correlation. We used Pearson’s correlation coefficient formula to compute the correlation matrix. Figure 15.5 shows the correlation matrix [20, 21] of the features. Covariance matrix depicts covariance between each pair of features as well as the extent to which corresponding variables are moving in the same direction. Variance is defined as the degree of variability in data. Figure 15.6 shows the covariance matrix.

Figure 15.4 Ranking of attributes.

Figure 15.5 Correlation matrix.
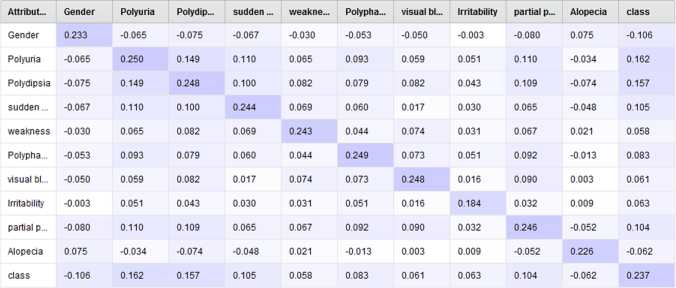
Figure 15.6 Covariance matrix.
- 15.6 shows the covariance matrix.
15.4 Framework for Early Detection of Disease
The framework is developed for early detection of the diabetes. The framework consists of different modules such as feature engineering modules where feature reduction is done with the help of filtering out the low ranking attributes with the help of information gain filter method. The neural network model is then trained using deep learning neural network. The performance measures such as accuracy, precision, recall, and F-score are used to evaluate the deep learning model. Figure 15.7 presents the proposed framework for early detection of the disease.

Figure 15.7 Machine learning framework for identification of diabetic.
15.4.1 Deep Neural Network
It is an artificial neural network with one input, one output, and multiple inner layers or hidden layers for computation. The more the number of layers of computation, the deeper the network is considered. These networks are widely used for recognizing complex relationships between inputs and outputs and for the processing of information that contains a number of layered interconnected elements [22, 23]. Deep neural network has the ability to combine low-level features layer by layer to form high-level features, and hence, it has better feature expression and ability to find complex relationships between vast dataset [24, 25].
In the proposed model, deep learning model is trained by using 70% of data and tested using 30% data with 400 epochs. ReLU activation function is used with Adam optimizer. We trained the deep learning model with four layers.
15.5 Result
The model when implemented on complete dataset achieved the accuracy of 97% as shown in Figure 15.8 and when implemented on reduced dataset with 10 features achieved the accuracy of 98.9% as shown in Figure 15.9. Diabetes data set is used for analysis purpose. Reducing the dimensionality of the data set is proved efficient. Table 15.4 shows the 1.9% improvement of accuracy. Other performance parameters such as value of precision is also improved in case of non-diabetic subjects as well as diabetic subjects.

Figure 15.8 Accuracy of deep learning-based neural network without dimensionality reduction.
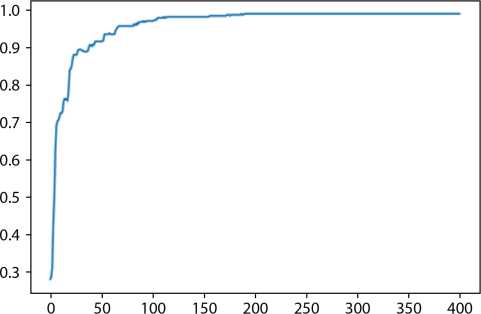
Figure 15.9 Accuracy of deep learning–based neural network with dimensionality reduction.
Table 15.3 Performance parameters of deep learning-based model without dimensionality reduction.
| Precision | Recall | F1 score | Accuracy | |
| Non-diabetic | 0.94 | 0.99 | 0.96 |
97% |
| Diabetic | 0.99 | 0.97 | 0.98 |
Table 15.4 Performance parameters of deep learning-based model with dimensionality reduction.
| Precision | Recall | F1 score | Accuracy | |
| Non-diabetic | 0.98 | 0.99 | 0.99 |
98.9% |
| Diabetic | 1.00 | 0.99 | 0.99 |
Tables 15.3 and 15.4 show the value of performance parameters. Recall and F1score for diabetic patients are improved by 2% and 1%, respectively.
15.6 Conclusion
Nowadays, researchers are using artificial neural network approaches to solve complex problems. Even in medical domain, artificial neural network-based methods are popular. Early diagnosis of disease is essential in order to take the proper course of action so that fatalities can be reduced. Machine learning–based framework is proposed for early detection of diabetes. The results show that deep learning-based approach leads to promising results by using routine clinical parameters. These parameters can be easily obtained from the hospitals. The proposed method uses feature engineering to reduce the feature space by filtering out the redundant and irrelevant variables. Feature engineering improves the computational time and accuracy of the algorithms. The framework can be considered an aid to medical practitioners for fast and accurate identification of disease.
References
1. Swapna, G., Vinayakumar, R., Soman, K.P., Diabetes detection using deep learning algorithms. ICT Express, 4, 4, 243–246, 2018.
2. Marshall, M.C., Diabetes in African Americans. Postgrad. Med. J., 81, 962, 734–740, 2005.
3. Chang, X. and Lilly, J.H., Evolutionary design of a fuzzy classifier from data. IEEE Trans. Syst. Man Cybern. Part B (Cybern.), 34, 4, 1894–1906, 2004.
4. Ampofo, A.G. and Boateng, E.B., Beyond 2020: Modelling obesity and diabetes prevalence. Diabetes Res. Clin. Pract., 167, 108362, 2020.
5. Li, H.X., Wang, Y., Zhang, G., Probabilistic fuzzy classification for stochastic data. IEEE Trans. Fuzzy Syst., 25, 6, 1391–1402, 2017.
6. Akula, R., Nguyen, N., Garibay, I., Supervised Machine Learning based Ensemble Model for Accurate Prediction of Type 2 Diabetes, in: 2019 SoutheastCon, pp. 1–8, IEEE, 2019, April.
7. Carrier, M.A. and Beverly, E.A., Focus on the Positive: A Qualitative Study of Positive Experiences Living With Type 1 or Type 2 Diabetes. Clin. Diabetes, Vol 39, 2, 176–187, 2021.
8. Krishnan, D.R., Menakath, G.P., Radhakrishnan, A., Himavarshini, Y., Aparna, A., Mukundan, K., Maddipati, C., Evaluation of predisposing factors of diabetes mellitus post gestational diabetes mellitus using machine learning techniques, in: 2019 IEEE Student Conference on Research and Development (SCOReD), IEEE, pp. 81–85, 2019, October.
9. Tama, B.A., An early detection method of type-2 diabetes mellitus in public hospital. Telkomnika, 9, 2, 287–294, 2011.
10. Kumar Dewangan, A. and Agrawal, P., Classification of diabetes mellitus using machine learning techniques. Int. J. Eng. Appl. Sci., 2, 5, 257905, 2015.
11. Ban, H.J., Heo, J.Y., Oh, K.S., Park, K.J., Identification of type 2 diabetes-associated combination of SNPs using support vector machine. BMC Genet., 11, 1, 1–11, 2010.
12. Mohebbi, A., Aradóttir, T.B., Johansen, A.R., Bengtsson, H., Fraccaro, M., Morup, M., A deep learning approach to adherence detection for type 2 diabetics, in: 2017 39th Annual International Conference of the IEEE Engineering in Medicine and Biology Society (EMBC), 2017, IEEE, pp. 2896–2899, 2017, July.
13. Faruqui, S.H.A., Du, Y., Meka, R., Alaeddini, A., Li, C., Shirinkam, S., Wang, J., Development of a deep learning model for dynamic forecasting of blood glucose level for type 2 diabetes mellitus: secondary analysis of a randomized controlled trial. JMIR mHealth uHealth, 7, 11, e14452, 2019.
14. Frimpong, E.A., Oluwasanmi, A., Baagyere, E.Y., Zhiguang, Q., A feedforward artificial neural network model for classification and detection of type 2 diabetes. J. Phys.: Conf. Ser., 1734, 1, 012026, 2021, January, IOP Publishing.
15. https://archive.ics.uci.edu/ml/datasets/Early+stage+diabetes+risk+prediction+dataset.#
16. Pawar, S.D., Thakur, P., Radhe, B.K., Jadhav, H., Behere, V., Pagar, V., The accuracy of polyuria, polydipsia, polyphagia, and Indian Diabetes Risk Score in adults screened for diabetes mellitus type-II. Med. J. Dr. DY Patil Univ., 10, 3, 263, 2017.
17. Nigro, N., Grossmann, M., Chiang, C., Inder, W.J., Polyuria-polydipsia syndrome: a diagnostic challenge. Intern. Med. J., 48, 3, 244–253, 2018.
18. Nargesian, F., Samulowitz, H., Khurana, U., Khalil, E.B., Turaga, D.S., Learning Feature Engineering for Classification, in: Ijcai, pp. 2529–2535., 2017, August.
19. Azhagusundari, B. and Thanamani, A.S., Feature selection based on information gain. Int. J. Innov. Technol. Exploring Eng. (IJITEE), 2, 2, 18–21, 2013.
20. Kijsipongse, E., Suriya, U., Ngamphiw, C., Tongsima, S., Efficient large pearson correlation matrix computing using hybrid mpi/cuda, in: 2011 Eighth International Joint Conference on Computer Science and Software Engineering (JCSSE), 2011, IEEE, pp. 237–241, 2011, May.
21. Langfelder, P. and Horvath, S., Fast R functions for robust correlations and hierarchical clustering. J. Stat. Software, 46, 11, pp. 1–17, 2012.
22. Samek, W., Binder, A., Montavon, G., Lapuschkin, S., Müller, K.R., Evaluating the visualization of what a deep neural network has learned. IEEE Trans. Neural Networks Learn. Syst., 28, 11, 2660–2673, 2016.
23. Bau, D., Zhu, J.Y., Strobelt, H., Lapedriza, A., Zhou, B., Torralba, A., Understanding the role of individual units in a deep neural network. Proc. Natl. Acad. Sci., 117, 48, 30071–30078, 2020.
24. Nadesh, R.K. and Arivuselvan, K., Type 2: Diabetes mellitus prediction using Deep Neural Networks classifier. Int. J. Cognit. Comput. Eng., 1, 55–61, 2020.
25. Bengion, Y. and Delalleau, O., On the expressive power of deep architectures. Proc. of the 14th International Conference on Discovery Science, pp. 18–36, Springer-Verlag, Berlin, 2011.
- * Corresponding author: [email protected]