
10 Incident response and remediation
- Using a SIEM or posture management tool to aggregate, track, and analyze security events across multiple sources
- Writing playbooks as part of an incident response plan to mitigate threats quickly
- Automating responses to attacks and vulnerabilities to respond quicker, reduce mistakes, and save time
In the last chapter we looked at many different types of monitoring and how to detect when there’s a potential attack or vulnerability in your system. There are many additional ways of detecting these kinds of security issues as well. You might conduct penetration tests on your applications to find potential weaknesses. You might get reports from external security researchers. You might subscribe to a feed of new vulnerabilities. There are many ways in which you will be alerted to security threats. The problem now is, how do you respond to them?
There are so many different attacks and vulnerabilities that you can’t possibly write down an appropriate response to all of them, and the appropriate response depends on your situation, so what works for one organization might not work for another. For that reason, rather than try to list out some incident responses, I’ll instead give some tips for how to make an incident response program more manageable.
The first tip is to create a process for tracking security events. If you’re getting alerts from a dozen different places, it’s hard to ensure that they’re all being taken care of appropriately. Each tool or service with its own process adds more complexity to tracking your events. How do you know if all of the open events are being handled? How do you know what the progress is for remediating an issue? How do you know which alerts are resolved and which ones are still open? How do you know what classes of issues come up the most? A good system for tracking security events makes it easy to answer all of these questions. Section 10.1 goes over how to set up such a tracking system.
The next tip is to work on incident response plans. Attacks have the potential to do a lot of damage to your organization. To minimize impact, you need to respond quickly and take the appropriate actions. However, it’s not so easy to figure out what those appropriate actions are when you’re in the middle of an attack. It can be a nerve-wracking experience, and you might not have a lot of time to think about what to do. So the best thing you can do is come up with plans for how to handle security events ahead of time. In section 10.2 we’ll talk about different kinds of plans and how to write them.
The last tip is about automation in incident response. Section 10.3 covers a couple of the ways we can introduce some automation into our incident response process. We already said that it is important to respond quickly and appropriately to threats. Automation can help to speed up and reduce errors in our response. We’ll look at scripting some of our incident response plans as well as how to run them automatically when alerts are generated.
10.1 Tracking security events
If you were to follow all of the recommendations from the last chapter, you would start getting alerts about threats and vulnerabilities from different AWS services, like Amazon Inspector, AWS Security Hub Standards, and Amazon GuardDuty. You would also surface issues from manual runs of scanning tools, like Prowler. If you want to respond to all of these alerts, you need to go check each of these services separately to see what’s new. And if you have multiple people working on these issues, you need another way to tell who’s working on what and whether it’s been fixed.
There are many tools we can use to simplify this process. The features we want from a tool are to be able to aggregate alerts from many different sources, to be able to track the actions that were taken for an alert, and to be able to analyze the data afterwards to get additional insight into our security posture. One category of tools we can use are posture management tools like CloudGuard from Check Point or AWS Security Hub. Alternatively, we could use a security incident and event management (SIEM). Datadog Security Monitoring and Splunk Enterprise Security are popular SIEMs used with AWS. SIEMs typically have many more features than just what we’ve talked about here. Other common features of SIEMs include the following:
-
Log collection, in addition to the alerts generated from other applications
-
Correlation and analysis, on top of aggregated data and alerts
In this section we’ll stick with a simple posture management tool to demonstrate how you might use a tool like this, though you have many options. Let’s start with aggregating alerts into one place.
10.1.1 Centralizing alerts
Suppose you’re using Inspector, GuardDuty, and Prowler in the ways that were talked about in chapter 9. Inspector is running periodic scans of your hosts looking for vulnerabilities. GuardDuty is monitoring your network traffic, and CloudTrail logs checking for threats. And you’re running Prowler once a day to find any misconfiguration of resources. To find your Inspector findings, you have to go to the Inspector console. GuardDuty findings are in the GuardDuty console, and findings from Prowler are in a JSON report. You have to go to a different place to find all of these issues, and they’re all in a different format. Figure 10.1 shows the difference between the alerts from the three different tools.

Figure 10.1 Security findings from different providers (e.g., GuardDuty, Inspector, and Prowler) all have their own format and storage systems.
If we could put all of these alerts in one place, it would save time in finding the alerts, and it would help ensure we don’t miss anything. There are many tools we can use to do this. We could send all of the alerts to tools, like Elasticsearch or Grafana. But as mentioned earlier, another one of the tools we can use for centralizing these alerts is AWS Security Hub. In the last chapter we used a feature of Security Hub, called Standards, that evaluates your account against different compliance standards. Here we’re going to use the core functionality of Security Hub, which is to collect alerts from many different sources and show them in a single dashboard.
To get started with Security Hub, we need to enable the service, if we haven’t already. The easiest way to do this is through the Security Hub Console. If you click the Get Started button in the console, you’ll see the steps you need to take to get up and running. The first one is to enable AWS Config, if it isn’t already. The steps to enable Config are the following:
-
Specify an Amazon S3 bucket to receive configuration information.
-
Add AWS Config managed rules to evaluate the resource types.
Once Config is enabled, you can select the standards you want to enable to start with, though they can be changed later. After that, click the Enable button, and you’re good to go. Figure 10.2 depicts the process for enabling Security Hub.

Once Security Hub is enabled, findings from certain AWS services will automatically start flowing in. Inspector and GuardDuty are two of the services that automatically import their findings into Security Hub, so there’s nothing we need to do for that. When new findings are generated in either of those two services, you should see them in your Security Hub dashboard, like in figure 10.3.
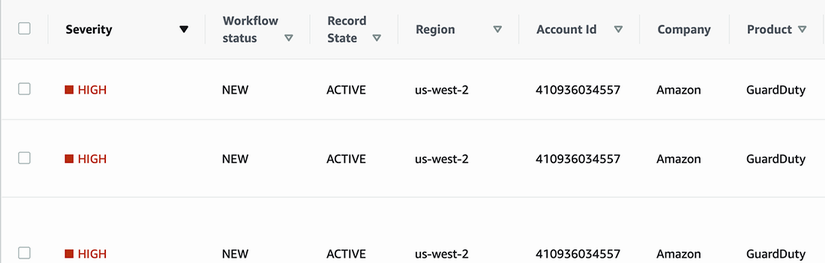
Figure 10.3 The Security Hub console shows findings from other AWS security services, like GuardDuty.
Prowler does not automatically add its findings to Security Hub, but it does have an official integration to make it very easy to import findings. The first step is to allow importing findings from Prowler. This can be done with the command shown in the following listing.
Listing 10.1 Enabling importing Prowler findings to Security Hub
aws securityhub enable-import-findings-for-product      ①
--region <region>                                       ②
--product-arn arn:aws:securityhub:<region>::product/
➥ prowler/prowler                                      ③
① This command allows a provider (like Prowler) to import findings into your account.
② Replace with the region in which you want to import the findings.
③ This is the regionalized ARN for Prowler. Each tool will have its own product ARN.
Then, you can run the following command to execute Prowler and send the findings directly to Security Hub.
Listing 10.2 Running a Prowler scan and sending the findings to Security Hub
① This sets the output format to the (JSON) AWS Security Finding Format.
② The -q option tells Prowler to only show failures.
③ The -S option tells Prowler to send the findings to Security Hub.
④ The -f option lets you select the region to run in.
Now, when you open up your Security Hub dashboard, you should see findings from Prowler as well, as in figure 10.4.

Figure 10.4 Findings from third-party security tools, like Prowler, can be imported into Security Hub.
10.1.2 Status tracking
Another useful feature we want is status tracking. If we have a long list of alerts, how do we differentiate between what’s new, what’s being worked on, and what has already been resolved? In Security Hub, we can set the workflow status field of a finding. The workflow status can be any of the following:
-
NEW—Indicating that no action has been taken on the finding yet
-
NOTIFIED—Indicating that the finding is actively being worked on
-
SUPPRESSED—Telling Security Hub to no longer alert on this type of finding
With these workflow statuses, we can easily track the progress of all of our findings. To change the workflow status of a finding in the Security Hub console, you can use the option in the Findings page, shown in figure 10.5.

Figure 10.5 Security Hub findings have an associated workflow status for tracking purposes that can be updated in the console.
Alternatively, you can use the AWS CLI to update a finding status if you know the ARN of the finding that you want to update, as shown in the following listing.
Listing 10.3 Manually updating a Security Hub finding from the CLI
    $ aws security-hub batch-update-findings            ①
--finding-identifiers Id=abc123,ProductArn=arn:aws:     ②
    ➥ securityhub:us-west-2::product/prowler/prowler
--workflow Status="RESOLVED"                            ③
① The BatchUpdateFindings method is used to update workflow status, even for one finding.
② Findings are identified by their unique combination of ID and product ARN.
③ Replace with the workflow status you want to set.
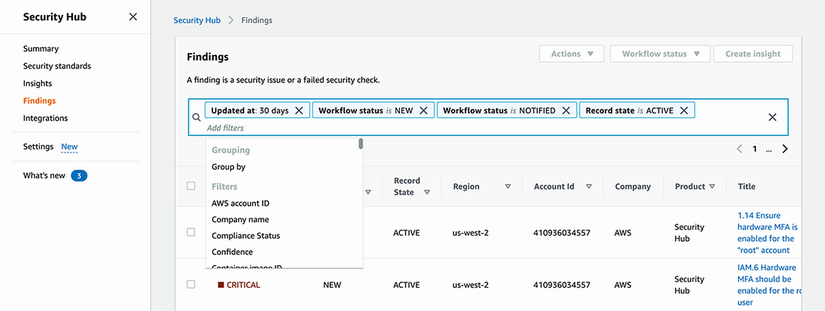
In addition to being able to check the status of any finding, we can also use the search filters in Security Hub to get a list of new findings that need action or findings that have been in the NOTIFIED state for a long time without resolution and that might need a follow-up. Figure 10.6 shows a search in the Security Hub console for findings older than 30 days that are not resolved.
10.1.3 Data analysis
Once you’ve been generating findings and taking actions on them for a while, you’ll start to have a lot of data about security issues in your application. If there are easy ways to access this data and perform some analysis, you can identify trends and potential areas for improvement. For example, if you’re seeing a lot of GuardDuty findings for network attacks against one of your resources, you might consider more restrictive network controls or isolating the resource if possible. Or if you are getting frequent alerts about missing patches on your hosts, you might consider reevaluating your patch management process.
One way you can do some analysis like this in Security Hub is with a feature called Insights. Insights show interesting collections of findings. One insight, for example, shows the top Amazon Machine Images (AMIs) with the most findings. This can be useful for finding an AMI that needs to be hardened. In the console, this insight looks like figure 10.7.
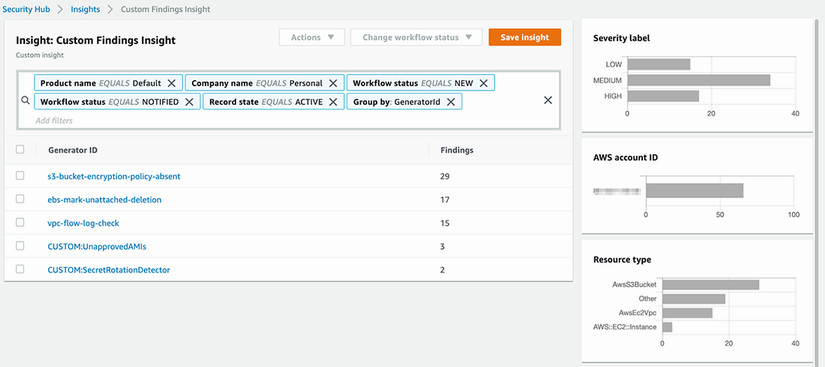
There are many more predefined insights, called managed insights, that come with Security Hub. You can also create your own insights if you wish. Figure 10.8 shows a custom insight that displays the top IAM roles that have the most critical findings associated with them.

This custom insight can be created in the UI or through the AWS CLI, as shown in the following listing.
Listing 10.4 Creating a Security Hub insight from the CLI
$ aws securityhub create-insight
            --filters ‘{                             ①
                "ResourceType": [{                   ②
                    "Comparison": "EQUALS",
                    "Value": "AwsIamRole"
                }],
                "SeverityLabel": [{                  ③
                    "Comparison": "EQUALS",
                    "Value": "CRITICAL"
                }]
            }’
            --group-by-attribute "ResourceId"        ④
            --name "Roles with Critical Findings"
① Filters the findings that apply to this insight rule
② Used to restrict to only findings that apply to IAM roles
③ Used to restrict to only findings that are of CRITICAL severity
④ The GroupBy attribute determines how findings should be grouped in the result.
10.2 Incident response planning
When a security event occurs, it’s imperative that you mitigate the threat as quickly as possible. The longer it takes to fix, the more time the attacker has to exfiltrate data, or tear down resources, or whatever it is they’re doing that you would prefer they weren’t. To act quickly during an attack, everyone involved needs to know ahead of time exactly what they’re expected to do. This means you need a plan.
You cannot plan for every possible situation that could occur, but you should plan for the threats that you think are most likely and the ones that would have the largest impact. Recall that these are the same types of threats we were concerned with when creating a threat model in chapter 4. Additionally, you should have a plan for responding to any alerts that come from your security monitoring, like those in chapter 9. If you have security monitoring that generates alerts, but you don’t have a plan for how to respond, you risk no action being taken at all and the monitoring going to waste. These two categories should give you a good starting point for what your incident response plan should cover.
Incident response plans can take any form, and, ultimately, you should use what works best for your organization. But I’ll recommend one style that’s very common: playbooks. The next section goes into what playbooks are and how they’re used.
10.2.1 Playbooks
Playbooks are like recipes for incident response scenarios. They detail the steps that should be taken in order to remediate an issue. It shouldn’t require an expert in order to implement the steps. Anyone on your incident response team should be able to pick up a playbook they haven’t read before and use it. Figure 10.9 shows a sample playbook for resolving a potential phishing attempt.

The playbook is depicted as a flowchart, which is how they’re commonly shown. Playbooks are also typically accompanied by some documentation, with at least the steps detailed enough that anyone running this playbook should have all of the information they need. However, you can define playbooks in whatever way works best for you, as long as it helps you react to security events in a structured way.
As an example, let’s define a playbook for a security finding we’ve talked about previously in this book: encryption at rest for S3. Suppose we get an alert that an S3 bucket does not have default encryption enabled. What would we do next?
First, we should determine whether the bucket actually needs to be encrypted or not. All S3 buckets should probably use encryption at rest, but let’s say for this example that we only need encryption for buckets that have sensitive data. Assume that we’re tagging buckets that contain sensitive data with the tag: DataClassification= Sensitive. Our first step in our playbook will be to check whether the offending bucket has the sensitive-data classification tag. If not, we can stop, as it’s a false alarm. If so, then we can start the process of encrypting the bucket.
Once we’ve determined that we need to encrypt the bucket, the next step is to enable default encryption. Default encryption can be enabled with the PutBucketEncryption command in the S3 API, or it can be enabled in the S3 console. Once we’ve enabled default encryption, we’re finished, and we’ve remediated the security alert.
Let’s put all of that together into a very simple playbook:
-
Start when we receive an alert that a bucket does not have default encryption enabled.
-
Check whether the S3 bucket has the
key=DataClassification,value=Sensitivetag. -
If so, turn on encryption by default for the S3 bucket in the S3 console.
Writing playbooks doesn’t have to be difficult, and like most documentation, you’ll thank yourself for having written them when you need to refer back to it later.
10.3 Automating incident response
Once we’re tracking all of our findings, and we have a good set of playbooks for responding to them, we can look at how to improve our incident response process even further. One way is through automation. By automating some of our incident response, we can speed up resolution. If we can script part or all of a playbook, it can run faster than an operator would and reduce the odds of skipping steps or making mistakes. Taking it even further, if we can automate our playbooks, we can also trigger them to run automatically when the right kinds of findings come in. This would make our incident response almost instantaneous or at least as fast as we detect issues. In the next section we’ll look at how to script a sample playbook and how to execute it directly within AWS Security Hub.
10.3.1 Scripting playbooks
Let’s start with a simple example, slightly modified from the S3 bucket encryption playbook we discussed earlier. Suppose we are running the Security Hub Standard for Payment Card Industry Data Security Standard (PCI DSS). One of the checks in that standard is this: [PCI.S3.4] S3 buckets should have server-side encryption enabled. This check is noncompliant whenever it detects an S3 bucket without default encryption enabled. It’s specifically related to a PCI standard for protecting cardholder data, though it’s a good idea to enable server-side encryption for just about any S3 bucket. In this case, however, we’re just concerned with buckets that contain cardholder data (identified by resource tags), so we’ll only act if that’s the case. Figure 10.10 shows a flowchart of the playbook for remediating violations of this control.
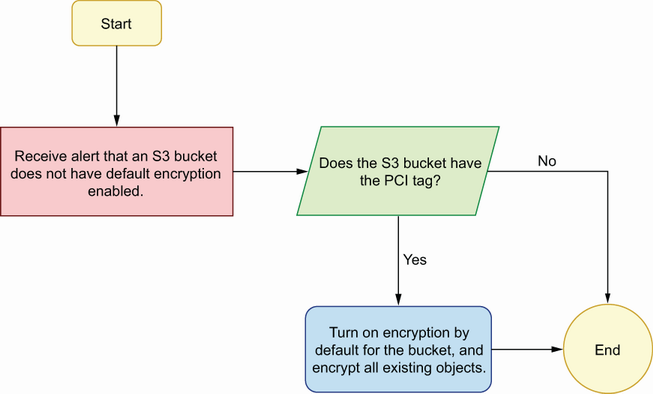
As we can see in the figure, the steps in our playbook include the following:
-
Start when we receive an alert that a bucket does not have default encryption enabled.
-
Check whether the S3 bucket has the
key=PCI, value=Truetag. -
If so, turn on encryption by default for the S3 bucket, and encrypt any existing objects that aren’t encrypted. Then, stop.
This is a relatively easy playbook for us to automate. We can write a quick Python script to run this and execute it on AWS Lambda to test. Let’s start with the Python code. The first thing we need is a handler function:
Here we just have a shell of our automated playbook, and we’re assuming that the ARN of the bucket in question is passed in the event argument. The event argument will depend on the event pattern from the caller of this function. We’ll define that event pattern later in listing 10.7. Next, we need to add the check to see whether the bucket has the PCI=True tag. That looks like the following:
tag_set = s3_client.get_bucket_tagging(bucket=s3_bucket_arn)[‘TagSet’]
is_pci = ‘PCI’ in tag_set and tag_set[‘PCI’] === ‘True’
After we have that logic, we can conditionally enable default encryption on the bucket:
if is_pci:
  s3_client.put_bucket_encryption(
    Bucket=s3_bucket_arn,
    ServerSideEncryptionConfiguration={
      ‘Rules’: [{
        ‘ApplyServerSideEncryptionByDefault’: {
          ‘SSEAlgorithm’: ‘AES256’,
        },
      },]
    }
  )
And finally, the last thing we have to do is encrypt any objects that might have been added to the bucket while encryption by default was disabled. This is done by iterating through the objects in the bucket and copying them in place with an encryption config specified. That code looks like the following:
    objects = s3_client.list_objects_v2(
        Bucket=s3_bucket_arn,
    )
    for obj in objects[‘Contents’]:
        s3_client.copy_object(
            Bucket=s3_bucket_arn,
            Key=obj[‘Key’],
            SSECustomerAlgorithm=‘AES256’
        )
If we put all of this together, the AWS Lambda function code looks like that shown in the following listing.
Listing 10.5 Lambda function code for Security Hub custom action to encrypt an S3 bucket
import boto3
s3_client = boto3.client(‘s3’)

def handler(event):                                   ①
    s3_bucket_arn = event[‘context’][‘resources’][0]
    tag_set = s3_client.get_bucket_tagging
    ➥ (bucket=s3_bucket_arn)[‘TagSet’]
    is_pci = tag_set.get(‘PCI’) === ‘True’            ②
    if is_pci:
        s3_client.put_bucket_encryption(              ③
            Bucket=s3_bucket_arn,
            ServerSideEncryptionConfiguration={
                ‘Rules’: [
                    {
                        ‘ApplyServerSideEncryptionByDefault’: {
                            ‘SSEAlgorithm’: ‘AES256’,
                            ‘KMSMasterKeyID’: ‘string’
                         },
                    },
                ]
            }
        )
        objects = s3_client.list_objects_v2(
            Bucket=s3_bucket_arn,
    )
    for obj in objects[‘Contents’]:
            s3_client.copy_object(                    ④
                Bucket=s3_bucket_arn,
                Key=obj[‘Key’],
                SSECustomerAlgorithm=‘AES256’
            )
① This handler getting called represents the first step in the playbook, receiving the alert.
② The second step in the playbook is checking whether the PCI tag is set.
③ Part of the third step is enabling default encryption for the S3 bucket.
④ The rest of the third step is encryption of all existing objects in the bucket.
We can copy that code into a new Lambda function and hit the test button. Use the following test input:
If you run this against a new S3 bucket without default encryption enabled, nothing should happen because it doesn’t have the PCI tag. If you add a tag to the S3 bucket with a key of PCI and a value of True and then test the Lambda function again, your bucket should have encryption by default enabled.
Now, we could do this manually whenever we get the PCI finding about an S3 bucket without default encryption. However, Security Hub has a feature to make this a little easier. We can use custom actions to quickly trigger a Lambda function directly from the Security Hub console. To create a custom action, we just have to run a few commands to set up the connections.
Listing 10.6 Creating an action target in Security Hub
aws securityhub create-action-target                   ①
    --name "Encrypt S3 Bucket"                         ②
    --description "Action to encrypt the S3 bucket"
    --id "Encrypt"
① Command to create a custom action
② Name of the custom action that will show up in the UI
Listing 10.7 Creating an EventBridge rule to trigger on a Security Hub custom action
$ aws events put-rule --name SecurityHubTrigger
  --event-pattern
  {
    "source": [
      "aws.securityhub"
    ],
    "detail-type": [
      "Security Hub Findings - Custom Action"
    ],
    "resources": [
      "arn:aws:securityhub:us-west-2:123456789012:action/custom/test-action1"
    ]
  }
That’s it! Everything is hooked up to run this custom action from the Security Hub console. Click on a finding for an S3 bucket without default encryption. Click on the custom action dropdown menu, and select the Encrypt S3 Bucket action, as shown in figure 10.11. This sends the noncompliant bucket information to EventBridge, which forwards it to your Lambda function. The Lambda function encrypts the offending bucket, and everything is good to go!

In the next section we’ll take this one step even further. Instead of viewing the finding in the console and clicking on a custom action, we’ll just automatically run our Lambda function whenever the right type of finding comes in. Let’s see how that works.
10.3.2 Automated response
Earlier, we used a custom action that sent the finding to EventBridge, which further sent the finding to the Lambda function. Now, we want to bypass the custom action altogether and go straight to EventBridge when we have a finding that can be automatically remediated. For this we’re going to make use of the Security Hub feature that sends all findings that come in to EventBridge.
This means that from EventBridge, all we need to do is create a rule that will send a specific type of finding to our Lambda function. The rule for this particular finding is shown in the following listing.
Listing 10.8 EventBridge rule to trigger on a specific Security Hub finding type
{
  "source": [
    "aws.securityhub"                     ①
  ],
  "detail-type": [
    "Security Hub Findings - Imported"    ②
  ],
  "detail": {
    "findings": {
      "type": [
        "PCI.S3.4"                        ③
      ]
    }
  }
}
① Indicates that the rule should run on an event from Security Hub
② Indicates that the rule should run when findings are imported
③ Restricts the rule to run only when the finding type is “PCI.S3.4”
This rule will trigger on all PCI.S3.4 findings. You can test it out by creating an S3 bucket with the PCI tag and without default encryption enabled. You’ll notice that, in a few minutes, the bucket will have default encryption enabled automatically.
This is just the beginning of automated response. You can build all kinds of complex remediation scenarios that will be automatically triggered and run whenever findings come in. The benefits of an automated approach like this are numerous. The remediations are applied immediately, rather than having to wait for an operator to perform them. The remediations are scripted and less prone to error than an operator. The remediations save operators tons of time they would otherwise spend working through playbooks. This last piece is critical, as the time savings allows you to scale your incident program to larger applications without needing to hire more people. If you’re interested in researching more about incident response automation, the group of tools to look for is called Security Orchestration, Automation, and Response (SOAR).
We’ll explore more with automated responses in the next chapter. Chapter 11 takes a realistic scenario with a public web application and walks through some of the steps you might take to make it secure.
Answers to exercises
10.3 B. Detecting issues faster
10.4 Free-form exercise on your own
10.5 Free-form exercise on your own
Summary
-
Posture management tools and SIEMs help you aggregate, track, and analyze security events to ensure you don’t miss any critical security issues.
-
Playbooks help operators to respond quickly and accurately to threats, which helps to minimize any potential impact.
-
Automating your security playbooks saves you time, reduces mistakes, and mitigates your security issues as soon as they’re detected.