
Chapter 3: Understanding How to Predict Industry-Wide Trends Using Big Data
Forecasting is a tricky business; no one is sure why it is that some forecasts are right and others are wrong, but two main factors contribute to forecast accuracy:
- Which data and models are used
- What assumptions are made about the variables being forecasted
Unfortunately, as this chapter will show, most traditional methods of forecasting suffer from low predictive accuracy because they do not take these important factors into account properly. Here, we will explore how big data changes all that by enabling better predictions.
Our goal is not to present you with yet another prediction tool (though we are going to discuss a few). Instead, we want to share some insights about why conventional methods fail and how we might harness big data to make better predictions ourselves. These insights will set product teams up for success since accurate forecasts of market demand and sentiment, across product segments, are crucial for a successful launch.
To that end, this chapter will cover the following topics:
- Why traditional forecasts fail
- Using big data to enable better forecasts
- Gaining value from data-driven forecasts
Technical requirements
You can download the latest code samples for this chapter from this book's official GitHub repository at https://github.com/PacktPublishing/AI-Powered-Commerce/tree/main/Chapter03.
Why traditional forecasts fail
Traditional methods of generating forecasts are based on the idea that you need expert knowledge and intuition of different products and services to model their future behavior. However, this approach has fundamental limitations, as follows:
- It's impossible to know everything about all products and services.
- Knowing how products perform today is not a good guide for predicting how they will perform tomorrow.
- The behaviors of many products are highly correlated and can be difficult to disentangle.
- Traditional models get overwhelmed by today's big data.
- The data itself keeps changing.
To address these challenges, we need new forecasting methods that can handle large amounts of heterogeneous data while producing forecasts that are more reliable, more accurate, easier to interpret and explain, and more useful for decision makers.
Let's explore these limitations in detail to lay the groundwork for why new forecasting methods are needed.
It's impossible to know everything about all products and services
In a forecast, you either assume that all the relevant data was captured, or you will build in room for error. On the other hand, if you're going to try to capture everything about a product or service with machine learning models, then why not do it right from the start?
When we try to model things such as market demand for a product at a granular level using traditional statistical methods, we run into two fundamental problems:
- Statistical methods are very weak at modeling interactions between variables.
- Statistical methods are very good at capturing correlations among variables.
Conventional statistical methods simply don't cope well with the fact that many products or services interact in complex ways and share properties across different products and services (this is the basis for the popular notion of intermediate goods).
A prime example is airline travel: the market for flights between cities might be thought of as a series of markets within larger markets. There are flights between cities, but also flights within regions, continents, and so on. Within each market, there are many different options. This allows airlines to segment their markets into niches and then price accordingly, which explains why they often offer low fares on some routes but very high fares on others.
Most statistical models assume that all relevant variables (for example, flight duration or the number of stops) are independently distributed; they ignore how interrelated variables influence each other. As a result, they underpredict what will happen next because the statistical model assumes that customers will choose products and services based on their idiosyncratic preferences rather than on a myriad of interacting data points, including the behavior of other customers. For instance, the idea of bandwagon consumption behavior refers to customers with collective, conformist purchase habits across brands.
It's no wonder traditional statistical methods fail when it comes to predicting what customers will want in the future and how companies should respond to changing conditions to maintain relevance. This is particularly true today when there is more product data out there than ever before. So long as we accept these unrealistic assumptions, and build forecasts based on small datasets, our predictions will always be less accurate than reality allows us to be.
Knowing how products perform today is not a good guide for predicting how they will perform tomorrow
This is because products, like all economic variables, don't react in a simple linear fashion. Consider the traditional approach of forecasting product sales using linear regression. In this approach, you forecast product demand based on historical sales data, with minimal (or no) additional knowledge built into the model. But if your demand forecast changes because something about the market (for example, competitors entering an industry or consumers shifting their spending patterns) changes in a significant way, you end up with actual and predicted sales that are off by a large amount.
The behaviors of many products are highly correlated and can be difficult to disentangle
This is problematic for traditional forecasting because we're essentially trying to predict the future behavior of many products at once, but we still need to understand what makes any given product or feature likely to succeed or fail in the market. This is why there are so few successful product forecasts. We've seen this time and again in the media: a company releases a new product, it becomes popular for a brief period (perhaps because of some marketing campaign), and then later on we see that sales declined or that it was a niche product.
However, due to how people respond to products, the reasons behind these declines are often unclear. It could be that the product itself was no longer useful because its competitors improved their products; alternatively, it could be that consumers got bored with it and moved on to something else.
Traditional models get overwhelmed by today's big data
Traditional models weren't made to handle the modern commerce world – there's just far too much data to try to predict with simple models. In a traditional forecast, you have a bunch of different inputs (for example, sales in the past year, customer loyalty scores from surveys, and so on) and then you churn out a prediction about the future based on assumptions about these variables. The problem is: there's way too much data that goes into market success than what gets captured by these models.
This is why traditional forecasting models perform poorly at capturing big trends, whether it's the rise of e-commerce or social media or the decline of physical media: they simply can't handle today's real-time, unstructured big data from a myriad of sources.
The data itself keeps changing
As our data becomes more complex, it becomes even harder to make accurate predictions. These problems are compounded by the fact that there is no single source of data on consumer spending, nor even on consumption patterns. The US government and Federal Reserve provide some tabulations of personal income and expenditures, but those are not a complete picture. Retail stores report sales figures, but not what kinds of goods customers bought or how much they paid for them; credit card companies and banks might report high-level spending patterns, but not with granular detail.
And then there's another problem: as businesses continue to grow their online presence, it becomes harder than ever to track exactly what people buy online, as well as in physical stores. As a result, your ability to forecast is compromised by limitations in the available data that you can manually select.
Big data can help us overcome the previously outlined challenges and understand how products and services will perform over time.
Using big data to enable better forecasts
Because AI learns from big data, we can use it to uncover hidden patterns in large sets of data about separate products or entire markets and overcome the biggest challenges with traditional forecasts.
For example, with Commerce.AI, we scan billions of product data points across over 100 sources to find trending product categories, showing product teams what market opportunities are worth pursuing. The following diagram shows some trending product categories that were found using the Commerce.AI data engine. Product teams can select any category to dive deeper and find leading brands, top products, product reviews, and more.

Figure 3.1 – Trending market segments
This data enables insights on specific market categories, as well as larger market segments. For instance, in the preceding diagram, we can see that markets such as computers and accessories, vitamins, and kitchen and dining are particularly large opportunities. The following diagram shows the result of an analysis that's been done on e-commerce as a whole, showing that the industry experienced 10 years' worth of growth in 3 months during the first COVID-19 pandemic lockdowns:
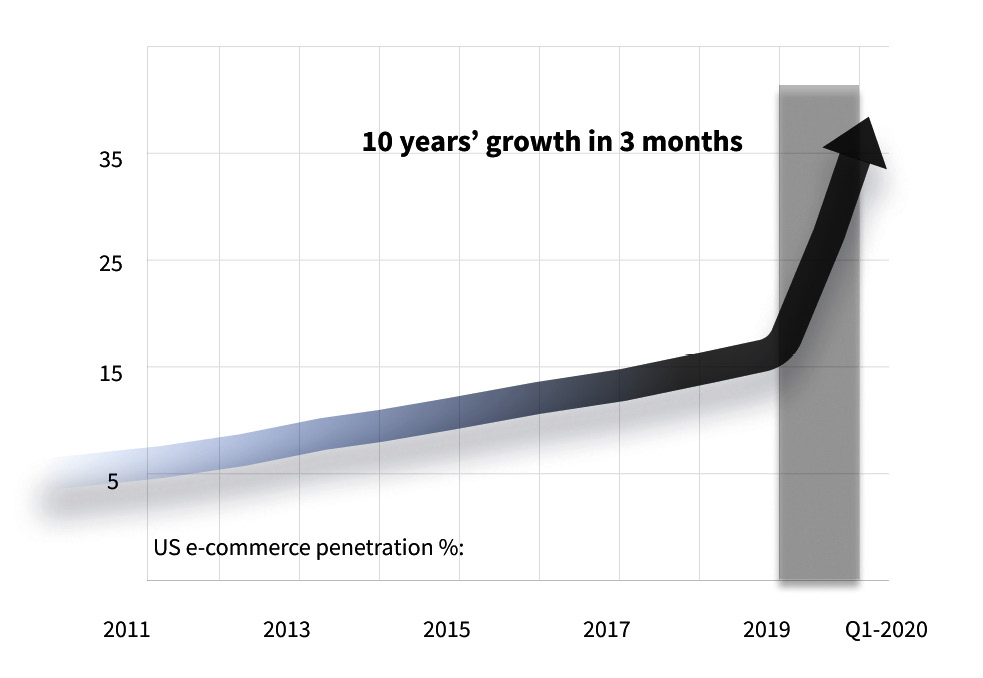
Figure 3.2 – US e-commerce penetration growth
In the case of Amazon, as an example, you might want to know which books sell best in different seasons, but also which books are popular with readers who buy other books related to food and cookery. Or you could look at historical sales volumes for different kinds of cars and wonder what factors drive consumer choices between them. With enough data, AI can yield a wealth of insights about individual products and their performance in different scenarios (for example, What happens if I promote my new smartphone app during the Super Bowl?).
Algorithms may even reveal correlations between particular features or distinct behaviors within a category (for example, Which models that sold well last year share certain design characteristics?). These insights allow us to make more informed decisions as business managers: we now have better tools than ever before for predicting the success of one product among others based on specific attributes or similar features (for example, Do people like our latest smartphone app compared to other apps such as Uber or Lyft?).
In particular, big data fuels an emerging, rapidly growing category of AI, known as deep learning, which has big implications for product teams looking to forecast industry trends.
Understanding deep learning
Deep learning is a subset of machine learning, which is the field that describes how computers can learn without being explicitly programmed. Machine learning has been around since the 1960s and has been used in many different applications, from playing video games to recognizing photos.
However, it wasn't until the 2010s that deep learning took off. That's when businesses began deploying machine learning techniques for highly complex problems such as object recognition, language translation, and computer vision using big data. Deep learning is a good fit for these more complex tasks because large neural networks have layers of artificial neurons with multiple connections between them, which helps them identify patterns in virtually anything.
Each layer learns some feature of the dataset, image, or part of speech by looking at examples and then adjusting the weights of its connections so that they more effectively detect similar features in future examples. The result is an extremely powerful pattern recognition algorithm: if you show it lots of examples from one category (say, cat photos), it learns to recognize cats; if you show it lots of examples from another category (say, dog photos), it learns to recognize dogs; if you show it a bunch of sales data, it'll learn to predict that too. This allows the network to generalize far beyond what any human programmer could manage on their own. So, why didn't product teams make use of this kind of technology before? It turns out that there were a couple of big obstacles researchers had to overcome to make deep neural networks work as intended.
The success of deep neural networks is due to a couple of key factors: increasing computational power and vast amounts of data.
One major challenge when it comes to making progress in machine learning is finding enough relevant data samples so that we can train our models effectively. If we look at supervised machine learning problems where labels are associated with training examples (for example, images containing dog or cat labels), then the quality and quantity of labeled training data become an issue when trying to solve any complex problem. It's common to see situations where a single dataset only covers a minuscule percentage of all possible training examples (for example, images of a certain object) in the world. It's also important to remember that training data is only one part of the machine learning pipeline – we also need to have some way of validating our machine learning models on unseen data so that we can improve their performance.
At the same time, getting this huge amount of data is vital, as AI accuracy generally increases with more data. The following diagram shows that the accuracy of natural language models increases as the number of model parameters, or, more simply, the model's size, increases. The same phenomenon is true with other types of neural networks, including those related to forecasting.

Figure 3.3 – ImageNet accuracy versus model size
However, before deep learning could be applied to huge datasets, it faced another major challenge: computational power. When we think about how computers work, we usually think about a bunch of logic gates (ANDs, ORs, and NOTs) that perform computations. But that's not how neural networks work, which attempt to model our brain. Our brain performs millions of calculations every second on billions of neurons – all while we're walking around or talking to someone!
So, how do we accomplish this via a computer? We need lots of computing power. And not just any kind – we need a lot of specialized hardware that can perform many different calculations at once, such as Graphical Processing Unit (GPU) clusters, or more recently, Tensor Processing Units (TPUs). This is because machine learning models have very computationally intensive training processes that use techniques such as backpropagation. All this is needed because AI, much like us, learns from examples.
Learning from examples
Given large amounts of training data, AI systems improve their ability to make accurate predictions over time as they learn more from experience. And due mostly to recent improvements in deep learning technology, AI has gotten quite good at predicting trends based on large amounts of examples. Because it can take massive amounts of training data and build increasingly complex models using hundreds or thousands of variables, an AI system can produce very detailed forecasts that look quite realistic compared to traditional forecasts built by humans using heaps upon heaps of historical market data.
As such, machine learning platforms have been gaining popularity, and they are now widely in use among product teams, from start-ups to the Fortune 500.
Demand forecasting with a practical example
Product market fit (PMF) is an important milestone for product teams – it means that your product or service has achieved sufficient customer adoption and engagement so that it can sustain itself without additional funding from investors. PMF is usually reached when customers are sufficiently engaged with your product, have become repeat customers, and continue to purchase more of your product as their needs change over time.
To achieve PMF, you must be able to forecast demand for new products based on changing customer needs and preferences, so that you can decide whether or not it makes sense for you to invest in developing a new version of your existing product or launching a completely new one.
Demand forecasting involves determining how much demand there will be for any type of feature at any given point in time (for example, during the next quarter).
Let's walk through a practical example of forecasting demand for Adidas Yeezy sneakers:
- First, we'll import the libraries that we need, which are Python's pandas for data manipulation and Facebook's Prophet, an AI forecasting library:
import pandas as pd
from fbprophet import Prophet
- Next, we'll import our data – 5 years of worldwide search history for the term Yeezy, retrieved using Google Trends (https://trends.google.com/):
df = pd.read_csv("multiTimeline.csv")
Here's what the associated data looks like:
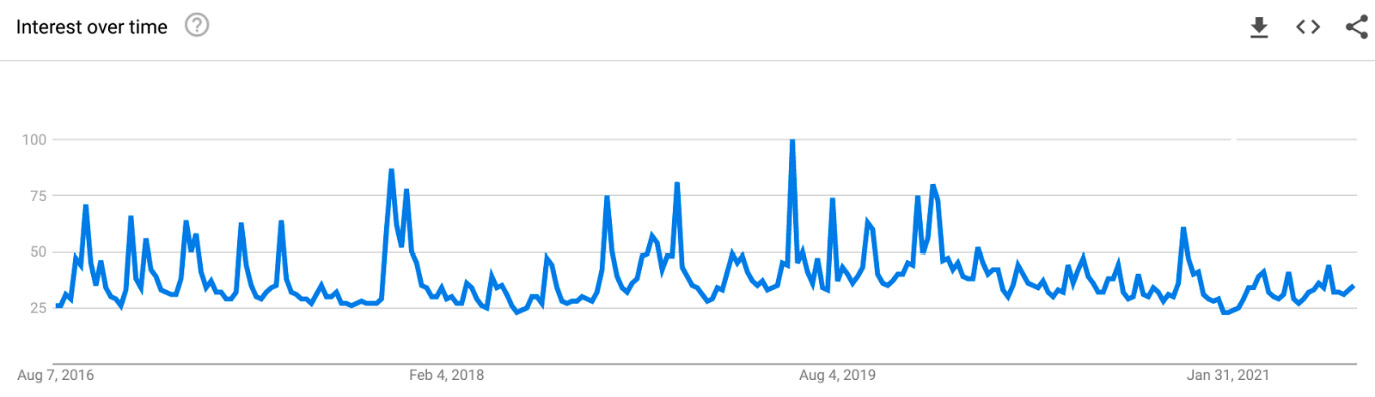
Figure 3.4 – Google Trends interest over time for the search term Yeezy
- The preceding graph shows us search trends for the term Yeezy, which we now have to turn into a format that we can forecast from. Prophet requires that the datetime column is named ds and that the observation column is named y, so we'll rename both columns:
df = df.rename(columns = {"Week": "ds", "yeezy:
(Worldwide)": "y"})
- Building an out-of-the-box model is just two lines of code, where we first instantiate the model and then fit it to the data:
m = Prophet()
m.fit(df)
- Now that we've built a forecasting model, it's time to make a forecast. We'll make an empty DataFrame to store forecasted values, and then fill that DataFrame with the predicted values:
future = m.make_future_dataframe(periods=52, freq='W')
forecast = m.predict(future)
- Now, we can plot our forecast with a single line of code:
fig1 = m.plot(forecast)
With that, we've successfully predicted demand for a given product. Here's what the resulting forecast graph looks like:

Figure 3.5 – A Facebook Prophet 1-year forecast of search demand for Yeezy
The preceding graph shows a 1-year forecast of Google Search interest for the product Yeezy. The same steps could be replicated for any product and any timespan or scaled to forecast demand across entire product lines or even market segments.
A similar method could be used to predict the sentiment of products and features over time. Combined with demand forecasts, product teams would then know the sweet spot of when new products and features should be released.
Sentiment forecasting with a practical example
Let's follow similar steps for forecast sentiment. After all, a product launch can only succeed if there's positive customer sentiment, and the sentiment is constantly changing, so it's crucial to be able to accurately forecast customer sentiment. If there's both positive customer sentiment and high forecasted demand, there's a potentially lucrative market opportunity at hand.
While Commerce.AI's sentiment forecasts are based on billions of data points and large, deep neural networks, we can take a simple example based on just a few data points.
Hugging Face is a leading natural language processing firm that offers a wide range of natural language libraries. With just a few lines of code, we can use Hugging Face to analyze the sentiment of the text. To provide an example of a Hugging Face sentiment analysis model in practice, we only need to provide two arguments: task and model.
We can implement the bert-base-multilingual-uncashed-sentiment model concerning sentiment analysis like so:
from transformers import pipeline
st = f"I like Yeezy"
seq = pipeline(task="text-classification", model='nlptown/bert-base-multilingual-uncased-sentiment')
print(f"Result: { seq(st) }")
This model is already fine-tuned to perform sentiment analysis on product reviews in six languages: English, Dutch, German, French, Spanish, and Italian. It predicts the sentiment of the product review as several stars (between 1 and 5). Fine-tuning means that the model was pre-trained on a large number of product reviews, and can now be used on new product data more accurately than a general-purpose language model.
AI can be used to improve our understanding of customer feedback by automatically identifying how customers feel about products they've purchased online. This allows us to understand what drives customer satisfaction within business lines – it could help us identify negative features before they become big issues for our customers, or identify areas of opportunity for new features. Another simple sentiment classification library is provided by TextBlob, which lets us run sentiment analysis in just four lines of code:
from textblob import TextBlob
text = "I just bought Yeezys and am absolutely in love!"
blob = TextBlob(text)
print(blob.sentiment)
TextBlob is an open source Python library for processing textual data. It lets you perform different operations on textual data such as noun phrase extraction, sentiment analysis, classification, and translation. By calculating sentiment on many data points, such as product reviews with a timestamp, we can graph sentiment over time.
The following diagram shows an example of the sentiment of Yeezy sneaker reviews over 1 year (the upper line is the frequency of neutral reviews, the middle line is the frequency of positive reviews, and the bottom line is the frequency of negative reviews):

Figure 3.6 – Sentiment of Yeezy sneaker reviews over time
Now that we've looked at how to predict demand and sentiment, let's explore how businesses can gain real value from these forecasts.
Gaining value from data-driven forecasts
Product teams can gain value from any kind of forecast, whether it's a simple Google search that gives you an idea of how popular a certain product is, or something more complex, such as Commerce.AI, which allows you to look at trends based on billions of data points. Let's look at how AI can be used to provide value for product development pipelines, forecasts, and roadmaps. Pipeline refers to a list of all the products currently being worked on by a company or team in its product management system (PMS), such as Jira Software or Trello.
The problem with pipelines is that they can become useless if they do not change frequently enough to reflect market shifts and changing customer needs. Let's say you have 20 products in your pipeline; however, because the market might shift 2 months into the future, those products may not get shipped by then due to lack of demand. With forecasts from Commerce.AI, you can make sure that any changes are reflected immediately in your pipeline and you don't miss out on opportunities that were previously available. You can also address competitive threats as they arise, based on larger market trends. Our analysis of consumer data shows, for instance, that three-quarters of consumers tried new brands during COVID. This indicates an unprecedented threat to the market share of established brands. The following diagram shows consumer statistics extracted from the Commerce.AI data engine:

Figure 3.7 – Consumer statistics
Using Commerce.AI also provides insight into how well launches will perform, enabling teams to create product roadmaps that are better timed, based on historical data from tens of thousands of product categories.
In short, whether it's managing pipelines or planning forecasts, having up-to-date information about current trends is essential to making high-quality decisions. Unlike traditional methods, where product teams would wait until sufficient data became available after months, such as from offline surveys using paper questionnaires, businesses can now tap into real-time insights. With today's technology, we're also no longer limited by the sources of data. AI can access many product data sources, from Amazon to Walmart to Target to YouTube video reviews.
Moreover, given that AI can scale to analyze any amount of data, product teams can find insights from data sources around the world, and they're no longer geographically limited. With these insights, they can find the perfect geographical location to launch in, and in our globalized world, that may very well be far from home.

Figure 3.8 – Map of major commerce data sources
Summary
In short, the issue with traditional forecasting is that any attempts to forecast a complex system, such as a market or economy, generally fail since there are too many variables and interactions among them for any simple model to capture them all. Not only does AI deliver better predictions within a product segment, but it's also more effective across industries, as it can scale to learn from any amount of data, anywhere in the world. With knowledge of how to forecast industry-wide trends, product professionals can ensure that they don't waste time on market opportunities that won't pan out, and instead focus on the red-hot opportunities that will drive business success.
In the next chapter, we'll dig into practical examples in the industry, and look specifically at how top luxury goods brands are using data and AI to power product success.