The Visual Basic code editor described in Chapter 6, "Visual Basic Code Editor," provides tools that make writing Visual Basic applications relatively easy. Features such as error indicators, tooltips, and IntelliSense help you write code that obeys the rules of Visual Basic syntax.
No code editor or any other tool can guarantee that the code you write actually does what you want it to do. Debugging is the process of modifying the code to make it run and produce correct results.
Depending on the application's complexity, debugging can be extremely difficult. Although Visual Studio cannot do your debugging for you, it does include features that make debugging easier. It allows you to stop execution while the program is running so you can examine and modify variables, explore data structures, and step through the code to follow its execution path.
This chapter explains Visual Basic's most important debugging tools. It describes the tools available in the Debug menu and the other IDE windows that are most useful for debugging.
The Debug menu contains commands that help you debug a program. These commands help you run the program in the debugger, move through the code, set and clear breakpoints, and generally follow the code's execution to see what it's doing and hopefully what it's doing wrong.
Effectively using these debugging tools can make finding problems in the code much easier, so you should spend some time learning how to use them. They can mean the difference between finding a tricky error in minutes, hours, or days.
The commands visible in the Debug window change depending on several conditions, such as the type of file you have open, whether the program is running, the line of code that contains the cursor, and whether that line contains a breakpoint. The following list briefly describes the most important menu items available while execution is stopped at a line of code that contains a breakpoint:
Windows — This submenu's commands display other debugging-related windows. This submenu is described in more detail in the following section, "The Debug

Continue — This command resumes program execution. The program runs until it finishes, it reaches another breakpoint, it encounters an error, or you stop it.
Break All — This command stops execution of all programs running within the debugger. This may include more than one program if you are debugging more than one application at the same time. This can be useful, for example, if two programs work closely together.
Stop Debugging — This command halts the program's execution and ends its debugging session. The program stops immediately, so it does not get a chance to execute any cleanup code that it may contain.
Step Into — This command makes the debugger execute the current line of code. If that code invokes a function, subroutine, or some other procedure, the point of execution moves into that procedure. It is not always obvious whether a line of code invokes a procedure. For example, a line of code that sets an object's property may be simply setting a value or it may be invoking a property procedure.
Step Over — This command makes the debugger execute the current line of code. If that code invokes a function, subroutine, or some other procedure, the debugger calls that routine but does not step into it, so you don't need to step through its code. However, if a breakpoint is set inside that routine, execution will stop at the breakpoint.
Step Out — This command makes the debugger run until it leaves the routine it is currently executing. Execution pauses when the program reaches the line of code that called this routine.
QuickWatch — This command displays a dialog box that gives information about the selected code object. Figure 7-1 shows the dialog box displaying information about a TextBox control named txtDirectory. If you look closely, you can see some of the control's properties including TabIndex, TabStop, Tag, and Text.
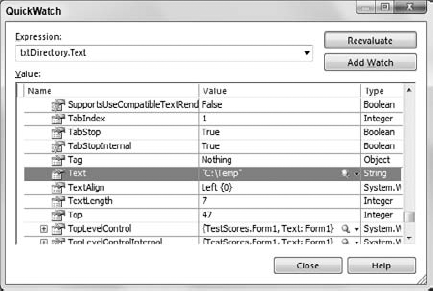
Figure 7.1. The QuickWatch dialog box lets you examine an object's properties and optionally set a new watch on it.
If you right-click a property's value and select Edit Value, you can change it within the dialog box. If you click the Add Watch button, the debugger adds the expression to the Watch window shown in Figure 7-2. You can also highlight a variable's name in the code and drag and drop it into a Watch window to create a watch very quickly. Right-click a watch in this window and select Delete Watch to remove it.
Exceptions — This command displays the dialog box shown in Figure 7-3. When you select a Thrown check box, the debugger stops whenever the selected type of error occurs. If you select a User-unhandled check box, the debugger stops when the selected type of error occurs and the program does not catch it with error-handling code.
For example, suppose that your code calls a subroutine that causes a divide-by-zero exception. Use the dialog box to select Common Language Runtime Exceptions/System/System.
DivideByZeroException (use the Find button to find it quickly). When you select the Thrown check box, the debugger stops in the subroutine when the divide-by-zero exception occurs, even if the code is protected by an error handler. When you select the User-unhandled check box, the debugger stops only if no error handler is active when the error occurs.
Toggle Breakpoint — This command toggles whether the current code line contains a breakpoint. When execution reaches a line with an active breakpoint, execution pauses so you can examine the code and program variables. You can also toggle a line's breakpoint by clicking the margin to the left of the line in the code editor or by placing the cursor in the line of code and pressing F9.
New Breakpoint — This submenu contains the Break At Function command. This command displays a dialog box that lets you specify a function where the program should break.
Delete All Breakpoints — This command removes all breakpoints from the entire solution.

The Debug menu's Windows submenu contains commands that display debugging-related windows. The following list briefly describes the most useful of these commands. The two sections that follow this one provide more detail about the Breakpoints, Command, and Immediate windows.
Immediate — This command displays the Immediate window, where you can type and execute ad hoc Visual Basic statements. The section "The Command and Immediate Windows" later in this chapter describes this window in a bit more detail.
Locals — This command displays the Locals window shown in Figure 7-4. The Locals window displays the values of variables defined in the local context. To change a value, click it and enter the new value. Click the plus and minus signs to the left of a value to expand or collapse it. For example, the Me entry shown in Figure 7-4 is an object with lots of properties that have their own values. Click the plus sign to expand the object's entry and view its properties. Those properties may also be objects, so you may be able to expand them further.
Breakpoints — This command displays the Breakpoints window shown in Figure 7-5. This dialog box shows the breakpoints, their locations, and their conditions. Select or clear the check boxes on the left to enable or disable breakpoints. Right-click a breakpoint to edit its location, condition, hit count, and action.
Use the dialog box's toolbar to create a new function breakpoint, delete a breakpoint, delete all breakpoints, enable or disable all breakpoints, go to a breakpoint's source code, and change the columns displayed by the dialog. Right-click a breakpoint to change its condition (a condition that determines whether the breakpoint is activated), hit count (a count that determines whether the breakpoint is activated), and When Hit (action to take when activated). See the section "The Breakpoints Window" later in this chapter for more detail.
Output — This command displays the Output window. This window displays compilation results and output produced by Debug and Trace statements.
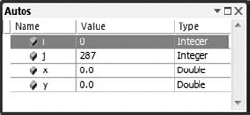
Autos — This command displays the Autos window shown in Figure 7-6. This window displays the values of local and global variables used in the current line of code and in the previous line.
Call Stack — This command displays the Call Stack window shown in Figure 7-7. This window lists the routines that have called other routines to reach the program's current point of execution. In Figure 7-7 the program is at line 49 in the function FindEmployee. That function was called by function SearchDatabase at line 36, and that function was called by the btnLocals_Click event handler.
Double-click a line to jump to the corresponding code in the program's call stack. This technique lets you move up the call stack to examine the code that called the routines that are running.
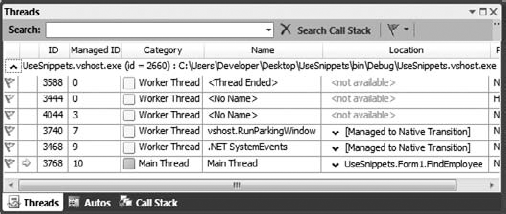
Threads — This command displays the Threads window shown in Figure 7-8. A thread is a separate execution path that is running. A multi-threaded application can have several threads running to perform more than one task at the same time. The Threads window lets you control the threads' priority and suspended status.
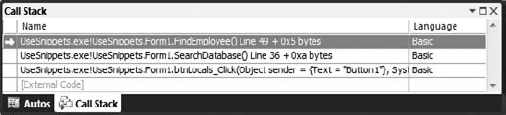
Figure 7.7. The Call Stack window shows which routines have called which to get to the program's current point of execution.
The last line in Figure 7-8 has the location WindowsApplication1.Form1.FindEmployee, indicating that this thread is executing the FindEmployee routine in the Form1 module in program WindowsApplication1. The arrow on the left indicates that this is the currently active thread.
Right-click a thread and select Freeze to suspend it. Right-click the thread again and select Thaw to make it resume execution. Double-click a thread or right-click it and select Switch To Thread to activate that thread.
Parallel Tasks — This command lists all of the application's running tasks. This is useful for debugging parallel applications.
Parallel Stacks — This command shows the call stacks for tasks running in parallel.
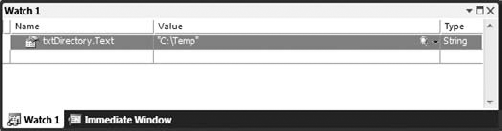
Watch — The Watch submenu contains the commands Watch 1, Watch 2, Watch 3, and Watch 4. These commands display four different watch windows that let you easily keep track of variable values. When you create a watch using the Debug menu's QuickWatch command described earlier, the new watch is placed in the Watch 1 window (shown in Figure 7-2). You can click and drag watches from one watch window to another to make a copy of the watch in the second window.
You can also click the Name column in the empty line at the bottom of a watch window and enter an expression to watch.
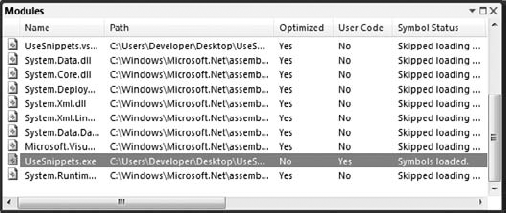
Modules — This command displays the Modules window shown in Figure 7-9. This window displays information about the DLL and EXE files used by the program. It shows each module's file name and path. It indicates whether the module is optimized, whether it is your code (rather than an installed library), and whether debugging symbols are loaded. The window shows each module's load order (lower-numbered modules are loaded first), the version, and timestamp. Click a column to sort the modules by that column.
Processes — This window lists processes that are attached to the Visual Studio session. This includes any programs launched by Visual Studio and processes that you attached to using the Debug menu's Attach to Process command.


Usually, when these debug windows are visible at runtime, they occupy separate tabs in the same area at the bottom of the IDE. That lets you switch between them quickly and easily without them taking up too much space.
A breakpoint is a line of code that you have flagged to stop execution. When the program reaches that line, execution stops and Visual Studio displays the code in a code editor window. This lets you examine or set variables, see which routine called the one containing the code, and otherwise try to figure out what the code is doing.
The Breakpoints window lists all the breakpoints you have defined for the program. This is useful for a couple of reasons. First, if you define a lot of breakpoints, it can be hard to find them all later. Although other commands let you disable, enable, or remove all of the breakpoints at once, there are times when you may need to find a particular breakpoint.
A common debugging strategy is to comment out broken code, add new code, and set a breakpoint near the modification so that you can see how the new code works. When you have finished testing the code, you probably want to remove either the old or new code, so you don't want to blindly remove all of the program's breakpoints.
The Breakpoints window lists all of the breakpoints and, if you double-click a breakpoint in the list, you can easily jump to the code that holds it.
Note
Source code control systems such as Visual SourceSafe track the entire change history of your code. Later, if you find a problem with the code, you can compare the current version to previous versions to see what has changed. In the worst case, you can back out the changes and recover an earlier version. This can be a lot easier than manually trying to remember and remove the changes.
The Breakpoints window also lets you modify the breakpoints you have defined. Select or clear the boxes on the left to enable or disable breakpoints. Use the dialog's toolbar to enable or disable all breakpoints, clear all breakpoints, or jump to a breakpoint's location in the source code.
Right-click a breakpoint and select Condition to display the dialog shown in Figure 7-10. By default, a breakpoint stops execution whenever it is reached. You can use this dialog box to add an additional condition that determines whether the breakpoint activates when reached. In this example, the breakpoint stops execution only if the expression (i = j) And (i > 20) is True when the code reaches the breakpoint.
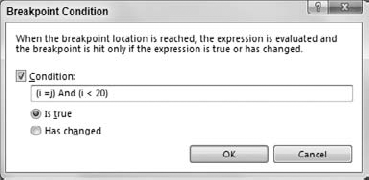
Figure 7.10. The Breakpoint Condition dialog box lets you specify a condition that determines whether Visual Studio stops at the breakpoint.
Right-click a breakpoint and select Hit Count to display the Breakpoint Hit Count dialog box shown in Figure 7-11. Each time the code reaches a breakpoint, it increments the breakpoint's hit count. You can use this dialog box to make the breakpoint's activation depend on the hit count's value.

Figure 7.11. The Breakpoint Hit Count dialog box lets you make a breakpoint's activation depend on the number of times the code has reached it.
From the drop-down list you can select one of the following options:
break always
break when the hit count is equal to
break when the hit count is a multiple of
break when the hit count is greater than or equal to
If you select any but the first option, you can enter a value in the text box and the program will pause execution when the breakpoint has been reached the appropriate number of times. For example, if you select the option "break when the hit count is a multiple of" and enter 2 into the text box, execution will pause every second time it reaches the breakpoint.
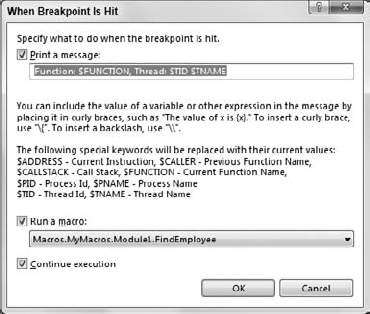
Right-click a breakpoint and select When Hit to display the When Breakpoint Is Hit dialog box shown in Figure 7-12. This dialog box lets you specify the actions that Visual Basic takes when the breakpoint is activated. Select the "Print a message" check box to make the program display a message in the Output window. Select the "Run a macro" check box to make the program execute a VBA macro. Select the "Continue execution" check box to make the program continue running without stopping.
The Command and Immediate windows enable you to execute commands while the program is stopped in the debugger. One of the more useful commands in each of these windows is the Debug.Print statement. For example, the command Debug.Print x displays the value of the variable x.
You can use a question mark as an abbreviation for Debug.Print. The following text shows how the command might appear in the Command window. Here the > symbol is the command prompt provided by the window and 123 is the result: the value of variable x. In the Immediate window, the statement would not include the > character.
>? x
123
The command >immed tells the Command window to open the Immediate window. Conversely, the command >cmd (you need to type the > in the Immediate window) tells the Immediate window to open the Command window.
Although there is some overlap between these two windows, they serve two mostly different purposes. The Command window can issue commands to the Visual Studio IDE. Typically, these are commands that appear in menus or toolbars, or that could appear in menus and toolbars. For example, the following command uses the Debug menu's QuickWatch command to open a QuickWatch window for the variable first_name:
>Debug.QuickWatch first_name
One particularly useful command is Tools.Alias. This command lists command aliases defined by the IDE. For example, it indicates that ? is the alias for Debug.Print and that ?? is the alias for Debug.QuickWatch.
The Command window includes some IntelliSense support. If you type the name of a menu, for example Debug or Tools, IntelliSense will display the commands available within that menu.
While the Command window issues commands to the IDE, the Immediate window executes Visual Basic statements. For example, suppose that you have written a subroutine named CheckPrinter. Then the following statement in the Immediate window executes that subroutine:
CheckPrinter
You can execute subroutines in the Immediate window to quickly and easily test routines without writing user interface code to handle all possible situations. You can call a subroutine or function, passing it different parameters to see what happens. If you set breakpoints within the routine, the debugger will pause there.
You can also set the values of global variables and then call routines that use them. The following Immediate window commands set the value of the m_PrinterName variable and then call the CheckPrinter subroutine:
m_PrinterName = "LP_REMOTE"
CheckPrinter
You can execute much more complex statements in the Command and Immediate windows. For example, suppose that your program uses the following statement to open a file for reading:
Dim fs As FileStream = File.OpenRead( _
 "C:Program FilesCustomer OrdersSummary" & _
  DateTime.Now().ToString("yymmdd") & ".dat")
Suppose that the program is failing because some other part of the program is deleting the file. You can type the following code (all on one line) into the Immediate window to see if the file exists. As you step through different pieces of the code, you can use this statement again to see if the file has been deleted.
?System.IO.File.Exists("C:Program FilesCustomer OrdersSummary" &
  DateTime.Now().ToString("yymmdd") & ".dat")
The window evaluates the complicated string expression to produce a file name. It then uses the System.IO.File.Exists command to determine whether the file exists and displays True or False accordingly.
Although Visual Basic cannot debug your applications for you, it provides all of the tools you need to get the job done. By using the tools in the Debug menu and the IDE's debugging-related windows, you can get a good idea about what your program is doing or doing wrong.
The chapters in the first part of the book describe the basic pieces of the development environment. They describe the windows, menus, and toolbars that you use to build and debug Visual Basic applications.
The next part of the book provides more detail about the steps you follow to build an application before you debug it. Chapter 8, "Selecting Windows Forms Controls," describes the most common controls that you can use to build Windows Forms applications.