DATE ACQUIRED | NO. OF SHARES | SECURITY | PRICE | TOTAL COST | PAPER PROFITS | PAPER LOSSES |
|---|---|---|---|---|---|---|
DATE ACQUIRED | NO. OF SHARES | SECURITY | PRICE | TOTAL COST | REASON FOR PURCHASE PRIME OBJECTIVE, ETC. |
|---|---|---|---|---|---|
Pages 175–178 can accompany next year's income tax return (Schedule D). Enter transactions as completed to avoid last-minute pressures.

Pages 175–178 can accompany next year's income tax return (Schedule D). Enter transactions as completed to avoid last-minute pressures.

SHARESX | STOCK/BOND | FIRST QUARTER | SECOND QUARTER | THIRD QUARTER | FOURTH QUARTER | ||||
|---|---|---|---|---|---|---|---|---|---|
$ | $ | $ | $ | ||||||
BROKERAGE ACCOUNT DATA 2010
MARGIN INTEREST | TRANSFER TAXES | CAPITAL ADDED | CAPITAL WITHDRAWN | |
|---|---|---|---|---|
JAN | ||||
FEB | ||||
MAR | ||||
APR | ||||
MAY | ||||
JUN | ||||
JUL | ||||
AUG | ||||
SEP | ||||
OCT | ||||
NOV | ||||
DEC |
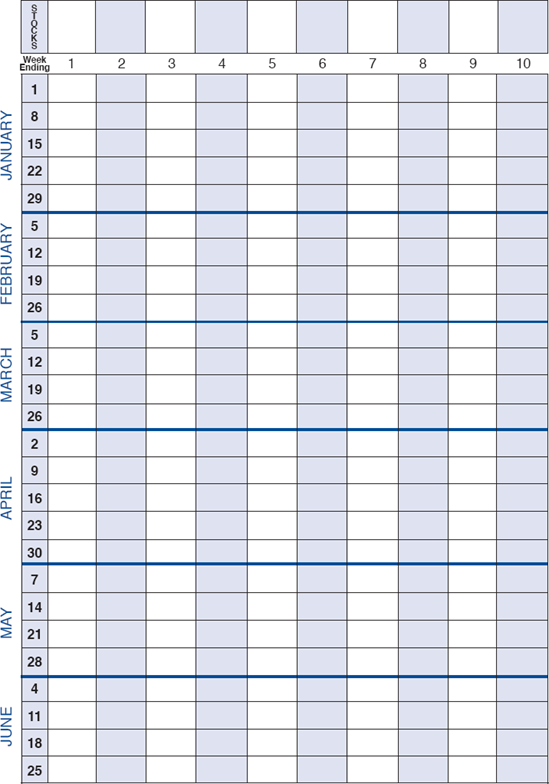
PORTFOLIO PRICE RECORD 2010 (FIRST HALF)
Place purchase price above stock name and weekly closes below.
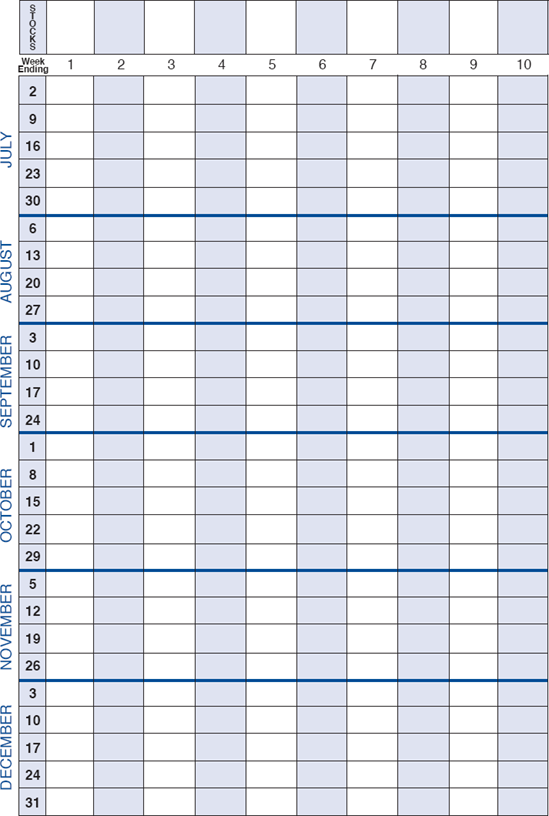
PORTFOLIO PRICE RECORD 2010 (SECOND HALF)
Place purchase price above stock name and weekly closes below.
DJIA% Last 3+ 1st 2 Days | DJIA% 9th to 11th Change Trading Days | DJIA% Change Rest of Month | DJIA% Change Whole Your | % Change Your Stocks | Gross Domestic Product | Prime Rate | Trade Deficit $ Billion | CPI % Change | % Unemployment Rate | |
|---|---|---|---|---|---|---|---|---|---|---|
JAN | ||||||||||
FEB | ||||||||||
MAR | ||||||||||
APR | ||||||||||
MAY | ||||||||||
JUN | ||||||||||
JUL | ||||||||||
AUG | ||||||||||
SEP | ||||||||||
OCT | ||||||||||
NOV | ||||||||||
DEC |
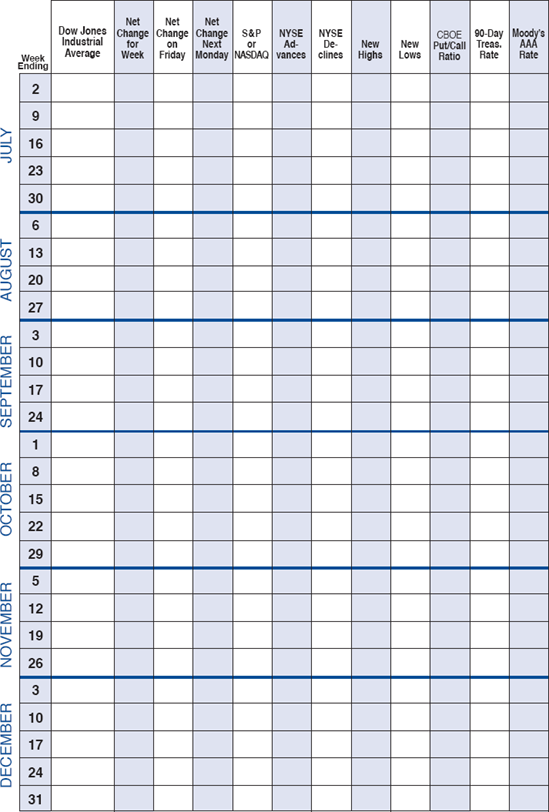
INSTRUCTIONS:
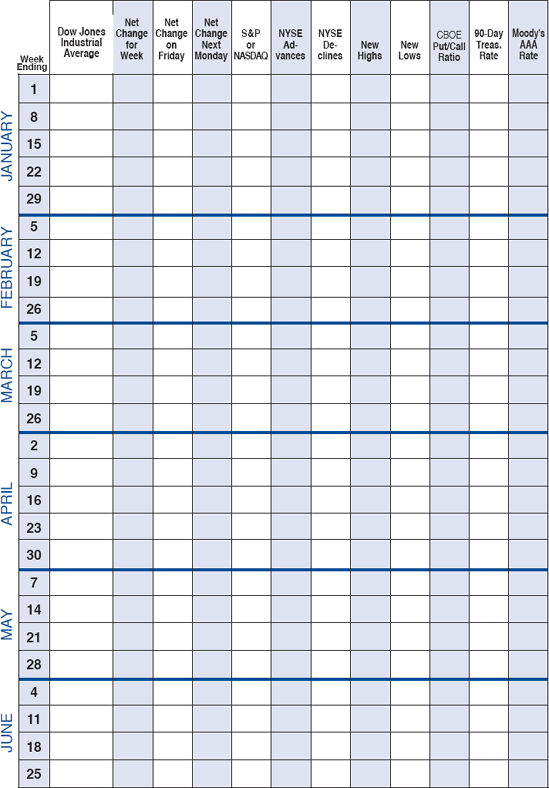
Weekly Indicator Data (pages 182–183). Keeping data on several indicators may give you a better feel of the market. In addition to the closing DJIA and its net change for the week, post the net change for Friday's Dow and also the following Monday's. A series of "down Fridays" followed by "down Mondays" often precedes a downswing. Tracking either the S&P or NASDAQ composite, and advances and declines, will help prevent the Dow from misleading you. New highs and lows and put/call ratios (www.cboe.com) are also useful indicators. All these weekly figures appear in weekend papers or Barron's. Data for 90-day Treasury Rate and Moody's AAA Bond Rate are quite important to track short- and long-term interest rates. These figures are available from:
Weekly U.S. Financial Data
Federal Reserve Bank of St. Louis
P.O. Box 442
St. Louis MO 63166
http://research.stlouisfed.org
Monthly Indicator Data. The purpose of the first three columns is to enable you to track the market's bullish bias near the end, beginning and middle of the month, which has been shifting lately (see pages 88, 145, and 146). Market direction, performance of your stocks, gross domestic product, prime rate, trade deficit, Consumer Price Index, and unemployment rate are worthwhile indicators to follow. Or, readers may wish to gauge other data.
No matter how much we may deny it, almost every successful person in Wall Street pays a great deal of attention to trading suggestions—especially when they come from "the right sources."
One of the hardest things to learn is to distinguish between good tips and bad ones. Usually, the best tips have a logical reason in back of them, which accompanies the tip. Poor tips usually have no reason to support them.
The important thing to remember is that the market discounts. It does not review, it does not reflect. The Street's real interest in "tips," inside information, buying and selling suggestions, and everything else of this kind emanates from a desire to find out just what the market has on hand to discount. The process of finding out involves separating the wheat from the chaff—and there is plenty of chaff.
PERFORMANCE RECORD OF RECOMMENDATIONS
STOCK RECOMMENDED | BY WHOM | DATE | PRICE | REASON FOR RECOMMENDATION | SUBSEQUENT ACTION OF STOCK |
|---|---|---|---|---|---|
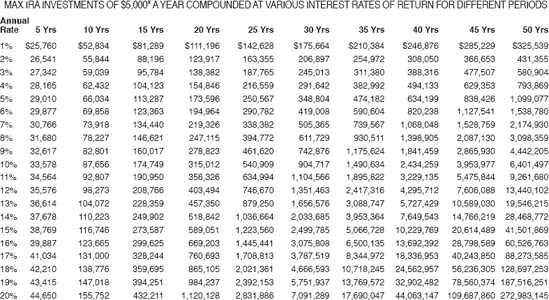
* At press time, 2010 Contribution Limit will be indexed to inflation.
By Average Daily Volume. See pages 114 and 116, Almanac Investor and stocktradersalmanac.com for more.

The Basics:
Options symbols contain a security's ticker symbol, an expiration month code, and a strike (exercise) price code.
For NASDAQ stocks with more than three letters in the stock code, the option ticker symbol is shortened to three letters, usually ending in Q. For example, Microsoft's stock symbol is MSFT, so its option ticker symbol is MSQ.
Each expiration month has a separate code for both calls and puts. Also, each strike price has a separate code, which is identical for calls and puts. In an option listing, the ticker symbol is first, followed by the expiration month code, and then the strike price code. For example, the Microsoft January 25 call would have the code MSQAE, and the Microsoft January 25 put would have the code MSQME.

Single Letter Strike Prices and Wraps:
Expanding equity and ETF markets in recent years have mushroomed, creating problems for single-letter strike price codes. So we consulted with options guru, Larry McMillan at www.optionstrategist.com. Stocks and ETFs that have option strike prices spaced less than five points apart and LEAPS (long-term options) often use up all the codes. In this case, the Options Clearing Corporation (OCC) rather arbitrarily assigns the letters that correspond to the striking prices. It might be H = 60, I = 61, J = 62, K = 63, L = 64, and so forth. Each stock or ETF is frequently different.
Once all 26 available letters have been assigned, a new base symbol is created by the OCC, called a wrap symbol. These newly created wrap symbols often have little in common with the stock or ETF itself. The OCC can use any three-character designation that is not already in use. For example, the current symbol for the Microsoft January 2010 25 Call is WMFAE.
Now, more than ever, any potential option trade requires a comprehensive review to ensure that the symbol actually represents the trade to be executed. Additional information can be found online at www.cboe.com, and www.amex.com provides excellent data on ETFs and ETF options.
Sources: Larry McMillan, cboe.com, and amex.com
LIFE IS CHANGE: Nothing can ever be the same a minute from now as it was a minute ago. Everything you own is changing in price and value. You can find that last price of an active security on the stock ticker, but you cannot find the next price anywhere. The value of your money is changing. Even the value of your home is changing, though no one walks in front of it with a sandwich board consistently posting the changes.
RECOGNIZE CHANGE: Your basic objective should be to profit from change. The art of investing is being able to recognize change and to adjust investment goals accordingly.
WRITE THINGS DOWN: You will score more investment success and avoid more investment failures if you write things down. Very few investors have the drive and inclination to do this.
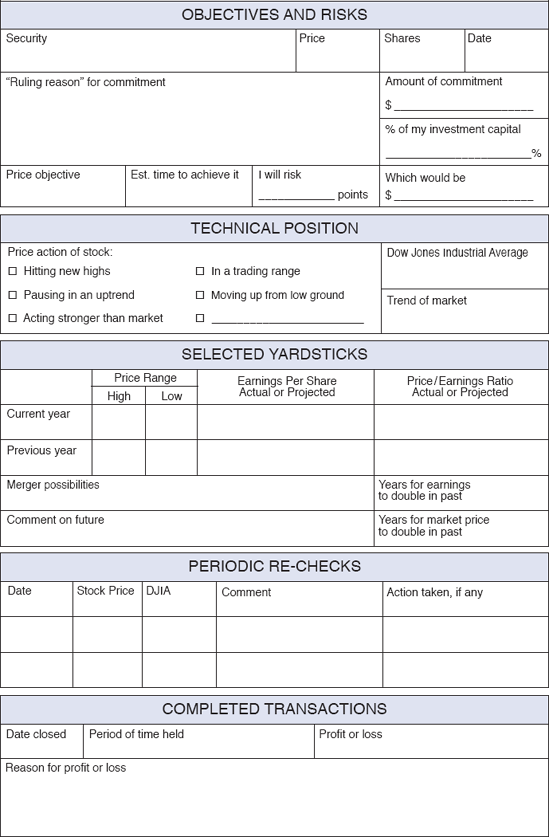
KEEP A CHECKLIST: If you aim to improve your investment results, get into the habit of keeping a checklist on every issue you consider buying. Before making a commitment, it will pay you to write down the answers to at least some of the basic questions—How much am I investing in this company? How much do I think I can make? How much do I have to risk? How long do I expect to take to reach my goal?
HAVE A SINGLE RULING REASON: Above all, writing things down is the best way to find "the ruling reason." When all is said and done, there is invariably a single reason that stands out above all others why a particular security transaction can be expected to show a profit. All too often, many relatively unimportant statistics are allowed to obscure this single important point.
Any one of a dozen factors may be the point of a particular purchase or sale. It could be a technical reason—an increase in earnings or dividend not yet discounted in the market price—a change of management—a promising new product—an expected improvement in the market's valuation of earnings—or many others. But, in any given case, one of these factors will almost certainly be more important than all the rest put together.
CLOSING OUT A COMMITMENT: If you have a loss, the solution is automatic, provided you decide what to do at the time you buy. Otherwise, the question divides itself into two parts. Are we in a bull or bear market? Few of us really know until it is too late. For the sake of the record, if you think it is a bear market, just put that consideration first and sell as much as your conviction suggests and your nature allows.
If you think it is a bull market, or at least a market where some stocks move up, some mark time, and only a few decline, do not sell unless:
You see a bear market ahead.
You see trouble for a particular company in which you own shares.
Time and circumstances have turned up a new and seemingly far better buy than the issue you like least in your list.
Your shares stop going up and start going down.
A subsidiary question is, which stock to sell first? Two further observations may help:
Do not sell solely because you think a stock is "overvalued."
If you want to sell some of your stocks and not all, in most cases it is better to go against your emotional inclinations and sell first the issues with losses, small profits or none at all, the weakest, the most disappointing, etc.
Mr. Loeb is the author of The Battle for Investment Survival, John Wiley & Sons.