

Published by OpenTask, Republic of Ireland
Copyright © 2013 by OpenTask
Copyright © 2013 by Software Diagnostics Services
Copyright © 2013 by Dmitry Vostokov
All rights reserved. No part of this book may be reproduced, stored in a retrieval system, or transmitted, in any form or by any means, without the prior written permission of the publisher.
You must not circulate this book in any other binding or cover and you must impose the same condition on any acquirer.
Product and company names mentioned in this book may be trademarks of their owners.
OpenTask books and magazines are available through booksellers and distributors worldwide. For further information or comments send requests to [email protected].
A CIP catalogue record for this book is available from the British Library.
ISBN-13: 978-1-908043-48-1 (Paperback)
First printing, 2013
Hello Everyone, my name is Dmitry Vostokov and I introduce today a software narratological approach to malware analysis of software traces and logs. I decided to keep this presentation short and as simple as possible. If anything needs to be added or modified in the future I create another version of it.
Facebook:
http://www.facebook.com/SoftwareDiagnosticsServices
Linkedin:
http://www.linkedin.com/company/software-diagnostics-services
Twitter:
http://twitter.com/DumpAnalysis

These prerequisites are very simple and I suppose you all like me enjoy diagnosing malware and often going side-by-side corresponding software problems.
Why we advocate a different approach to traditional log analysis? First, we need a unified communication language in the context of general software diagnostics, and second, an approach to tackle big DA+TA that is in our context means memory dump and trace artifacts. The proliferation of mobile technologies might seem making memory dump analysis redundant but the size of memory is ever increasing for mobile and embedded devices and software traces ad logs are just a form of memory dumps.
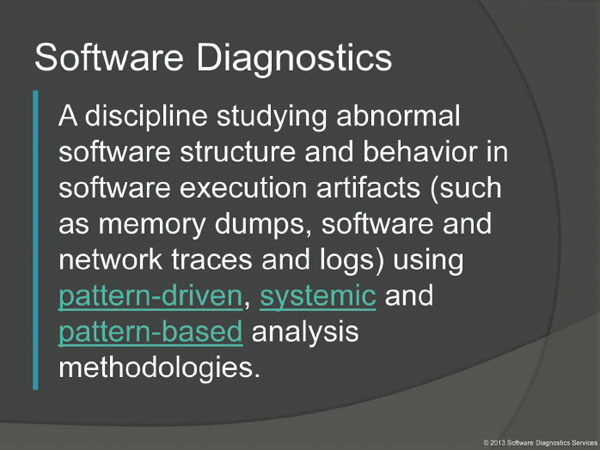
First, I would like to remind you a definition of software diagnostics we put forward in one of our previous webinars. We also use words such as “trace” and “log” interchangeably. So you see that malware detection and associated software behavior fall under the definition of software diagnostics.
Pattern-driven:
http://www.patterndiagnostics.com/Introduction-Software-Diagnostics-materials
Systemic:
http://www.patterndiagnostics.com/systemic-diagnostics-materials
Pattern-based:
http://www.dumpanalysis.org/pattern-based-software-diagnostics

Next we would like to mention a definition of a software diagnostics pattern. There are some differences with a usual definition of a pattern from software construction such as architectural and design patterns. The difference is that often upon a diagnostic encounter we provide recommendations and possible solutions instead of just problem solutions. Recommendations may include immediate actions, for example, upon the detection of suspicious activity.
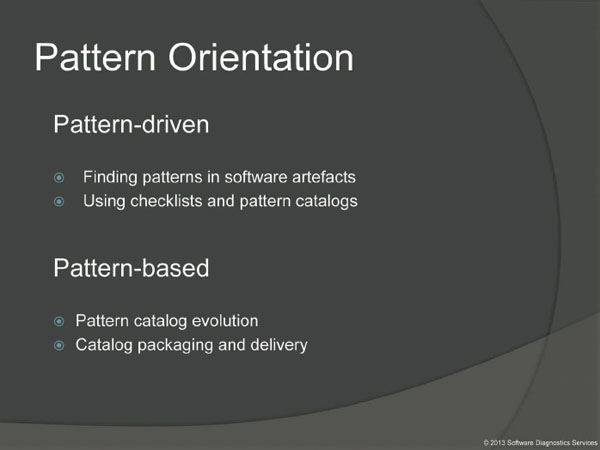
So you see that software diagnostics is about patterns and pattern recognition. Let's say it is pattern-oriented and includes pattern-based and pattern-driven parts. Pattern-driven is about diagnostics process and pattern-based is about pattern life cycle. We first start with the pattern-driven part first.

In pattern-driven analysis we use pattern catalogs. Catalogs can be classified by abstraction, for example, as software diagnostics meta-patterns which are patterns of software diagnostics itself, by the type of software execution artifacts, such as software traces and logs, memory dumps and network traces, by story type, such as by problem descriptions, by software disruptions, and by user interface problems. Also we can separate patterns by intention such as malware (with unintentional patterns, the rest, all grouped as Victimware). In this presentation we only consider software logs and network traces.
Meta-patterns:
http://www.dumpanalysis.org/blog/index.php/2012/06/09/patterns-of-software-diagnostics-part-1/
Software Log:
http://www.dumpanalysis.org/blog/index.php/trace-analysis-patterns/
Memory Dump:
http://www.dumpanalysis.org/blog/index.php/crash-dump-analysis-patterns/
Network Trace:
http://www.dumpanalysis.org/blog/index.php/2012/07/19/network-trace-analysis-patterns-part-1/
Problem Description:
http://www.dumpanalysis.org/blog/index.php/2012/03/11/software-problem-description-patterns-part-1/
Software Disruption:
http://www.dumpanalysis.org/blog/index.php/2013/01/12/software-disruption-patterns-part-1/
UI Problem:
http://www.dumpanalysis.org/blog/index.php/user-interface-problem-analysis-patterns/
Malware:
http://www.dumpanalysis.org/blog/index.php/malware-analysis-patterns/
Because our presentation is related to malware we provide its definition: software that uses planned alteration of structure and behavior of software to serve malicious purposes. Notice the recursive character of that definition that includes self-modifying malware and also rootkits where a malicious purpose is to conceal.

Before we proceed to software traces and logs I would like to say a few words about memory and memory dumps. Some time ago we created a separate malware pattern catalog for memory analysis. Due to intentional nature of malware there is only a partial overlap of them, for example, Out-of-Module Pointer (a pointer in a structure is considered malicious if it points outside the module code range) is considered to be malware specific.

In addition to live memory and memory snapshot artifacts software diagnostics also analyses various software traces and logs. There are so many of them with different formats, OS and product specific information.

A unifying approach was needed for a pattern catalog. The needed solution would use the common structure of all these logs and associated patterns.

We, therefore, considered using narratology, the discipline that studies various narrative forms such as stories, novels, movies because all these logs have the same unified narrative structure such as events ordered by time.

There are several types of narrative related to malware analysis. In this presentation we only limit ourselves to software traces and logs as stories of software execution and communication.
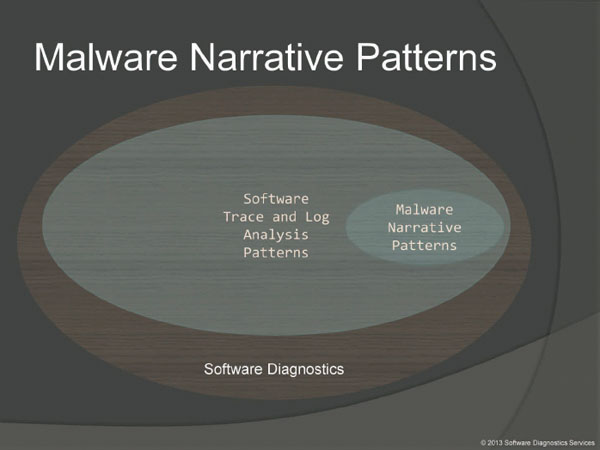
By malware narrative patterns we consider a subset of software trace and log analysis patterns because the same logs can also be used for the analysis of abnormal software behaviour, troubleshooting and debugging, and they all have the same underlying narratological structure.
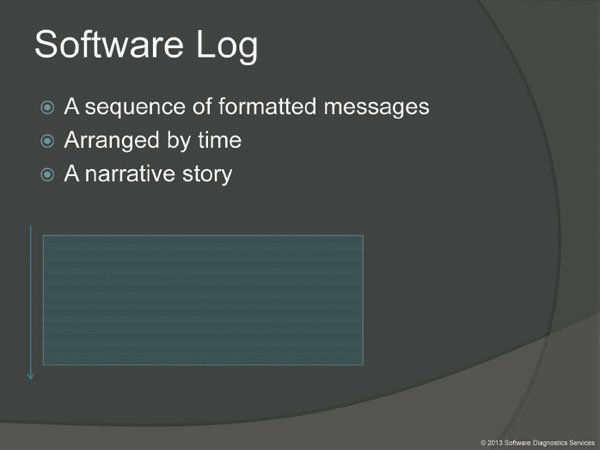
What is a software trace or log actually? For our purposes it is just a sequence of formatted messages sent from running software, for example, an event log or intercepted and formatted API requests such as a log from Process Monitor tool or even a network trace. They are usually arranged by time and can be considered as a software narrative story.
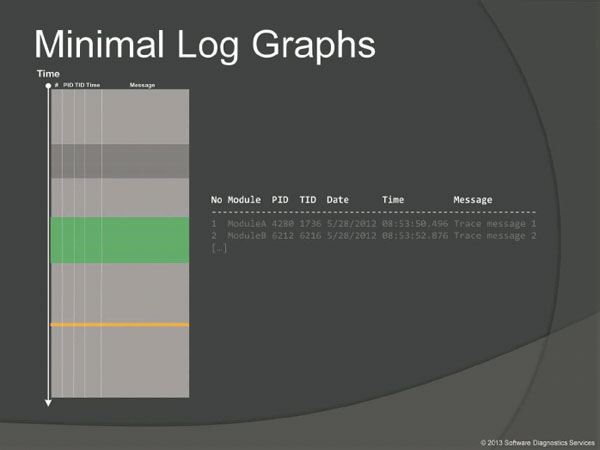
In order to illustrate log analysis patterns graphically we use the simplified abstracted pictorial representation of a typical software log. It has all essential features such as message number, time, PID, TID, and message text itself.
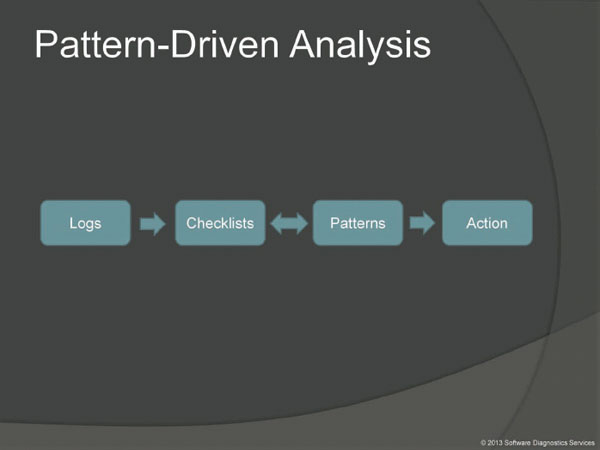
A few words about logs, checklists, and patterns. Software log analysis is usually an analysis of a text for the presence of patterns. Here checklists can be very useful.

Pattern catalogs are rarely fixed. New patterns are constantly discerned or refined. For example, while preparing for this webinar I found yet another missing pattern and added it to the trace analysis pattern catalog.
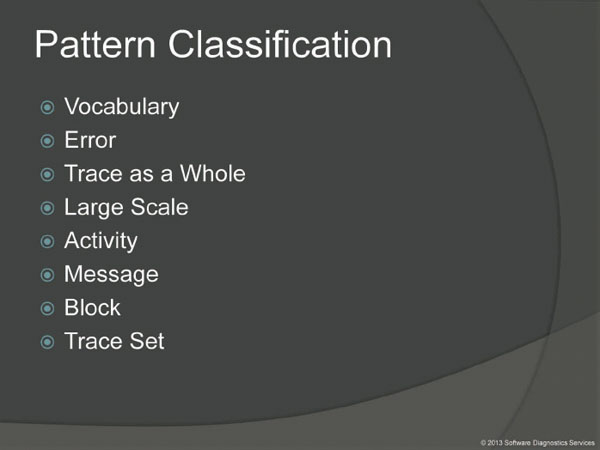
Recently all software trace and log analysis patterns (which are now numbered almost 70 at the time of this writing) were classified into several categories. Vocabulary category consists of patterns related to problem description. Error category covers general error distribution patterns. This classification also considers traces as wholes, their large scale structure, activity patterns, patterns related to individual trace message structure, patterns related to collection of messages (the so called blocks) and finally patterns related to several traces and logs as a collection of artifacts from software incident. Because malware detection and analysis is only a part of general software diagnostics we selected only a few patterns from these categories as relevant. Of course, all this selection will be revised in the future version of this classification.

Most of patterns are very intuitive if you analyse logs and traces. Here I provided a few links and after you download a presentation you can follow them. Although most pattern examples are for Windows platform they are really platform and product independent.
Software Log Analysis Patterns1:
http://www.dumpanalysis.org/blog/index.php/trace-analysis-patterns/
Free reference graphical slides:
http://www.patterndiagnostics.com/Training/Accelerated-Windows-Software-Trace-Analysis-Public.pdf
Training course:
http://www.patterndiagnostics.com/accelerated-software-trace-analysis
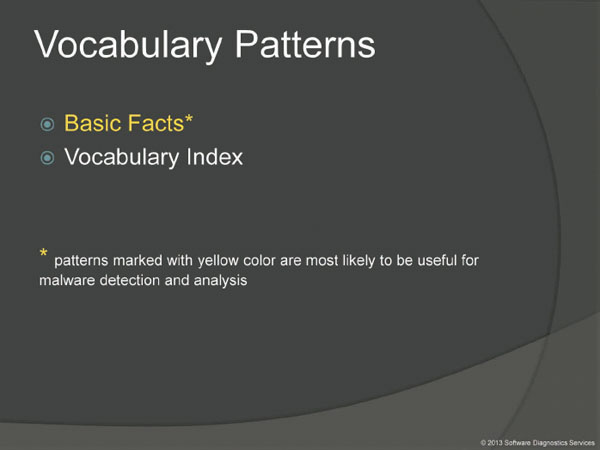
The first block of patterns are vocabulary patterns related to an incident description from a user point of view. A typical log is a detailed software narrative that might include lots of irrelevant information with useful messages like needles in a haystack. However, it is usually accompanied by an incident description that lists essential facts. Therefore the first task of any log analysis is to check the presence of Basic Facts (or it is usually called Supporting Materials) in the log. If they are not visible or do not correspond then the trace was possibly not recorded during the incident or was taken from a different computer or under different conditions.

The next block are error patterns related to error and failure messages either explicitly stating that there is an error or doing that indirectly via error code, abnormal function return value or NT status values in failure range. These patterns may be relevant when some malware causes some malfunction (the so called victimware) or itself experiences abnormal behavior. We do not cover them here.

The third block of patterns contains patterns related to software trace or log as a whole. We ignore trace message contents and treat all messages statistically. Here we see only one pattern relevant to malware analysis specifically and it is called Guest Module.

Often, when comparing normal, expected and suspicious traces we can get clues by looking at module load events. For example, when we see an unexpected module load event in our suspicious trace this may prompt us to investigate it further.

The fourth block consists of large scale log patterns. They are about the coarse grain structure of software traces and logs where the division unit is often a module or some high level functionality. Here we would like to highlight 3 patterns that make sense for malware detection and analysis: Characteristic Block, Foreground Modules, and Focus of Tracing.

Textual representations can also be viewed a from bird's eye perspective. Irregularities in formatting make it easier to see coarse blocked structure of a software trace or log.
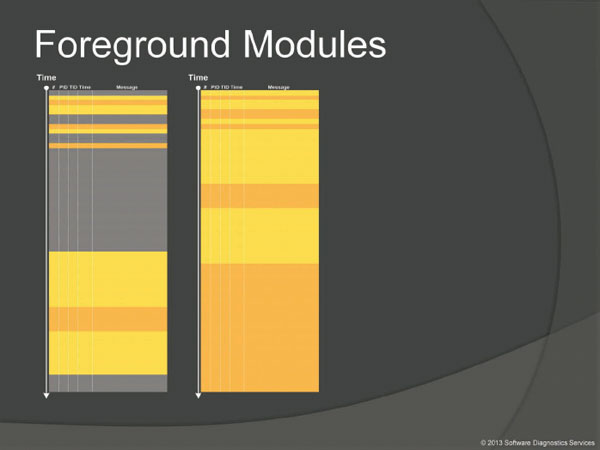
Log and trace viewers such as Process Monitor and network analysis tools can filter out (or exclude) background component messages and present only foreground modules (that we call module or component foregrounding). Here background modules can be considered as noise to filter out. Of course, this process is iterative and parts of what once was foreground become background and candidates for further filtering.

A software trace or log consists of the so called Activity Regions with syntactical and visual aspects of log analysis whereas Focus of Tracing brings attention to changing semantics of log message flow. Here is a graphical illustration of this pattern where tracing focus region spans 3 regions of activity.

The fifth block of patterns is related to various software activities we see in logs and traces. Most of them involve time dependency.
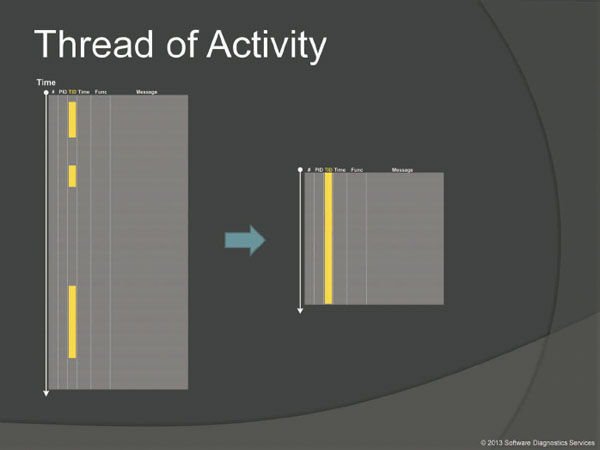
This pattern means trace messages associated with particular TID. When we see a suspicious message we select its current thread and investigate what happened in this process and thread before.

Adjoint Thread is an extension of Thread of Activity pattern. On the picture we see a log message stream where some messages are coming from specific TID shown in yellow color. Suppose we are interested in some specific network operation or registry or file activity or process name. It is possible to filter such messages and form an adjoint thread of activity for further pattern analysis.

Basically it is a region of log message stream messages related semantically or syntactically. Of course it is all relative and dependent on analysis goals. For example, when looking at long traces with millions of messages we can see regions of activity where Message Current (Jm, msg/s) is much higher than in surrounding temporal regions. Another example is sudden network activity region.
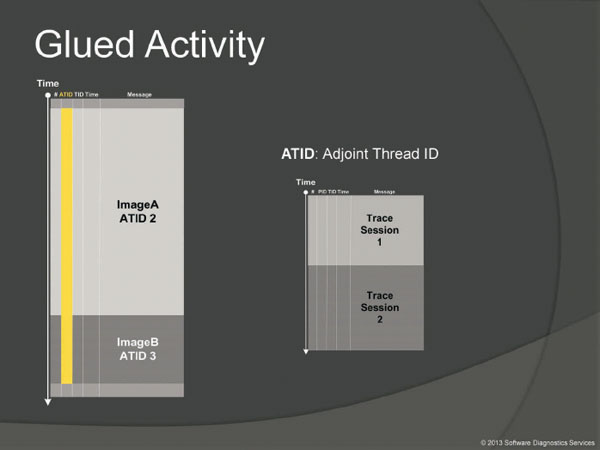
Examples here include log messages from different processes having the same Adjoint Thread ID such as the same operation name or network address. Another example is all messages coming from processes sharing the same name, or even, in general, periodic logging sessions appended to the end of the same log file.

This pattern covers a message or a set of messages that surface just before the end of Discontinuity (a temporal gap) of some Thread of Activity or Adjoint Thread. For example, a silent process suddenly starts some network activity.

If trace messages contain some character or formatted data that is passed from module to module or between threads and processes it is possible to trace that data and form a Data Flow thread similar to an Adjoint Thread of Activity. However, for Data Flow we may have completely different message types.

The sixth block of patterns includes message patterns or patterns at the level of an individual message.
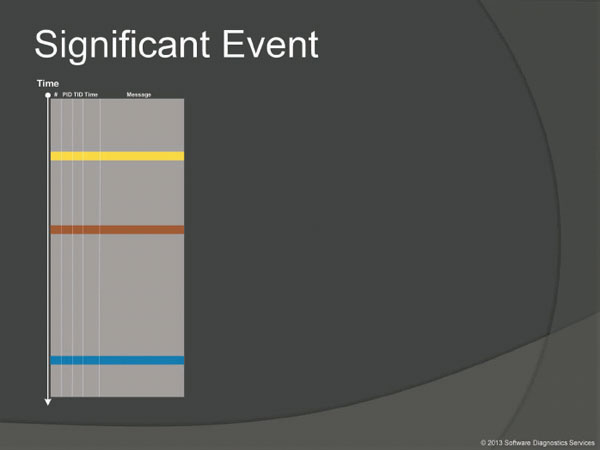
When looking at software traces and logs and doing either a search for or just scrolling certain messages have our attention immediately. We call them Significant Events. For malware analysis any suspicious message such as updating specific registry keys or creation of a popup window where we don't expect it would count as a significant event.
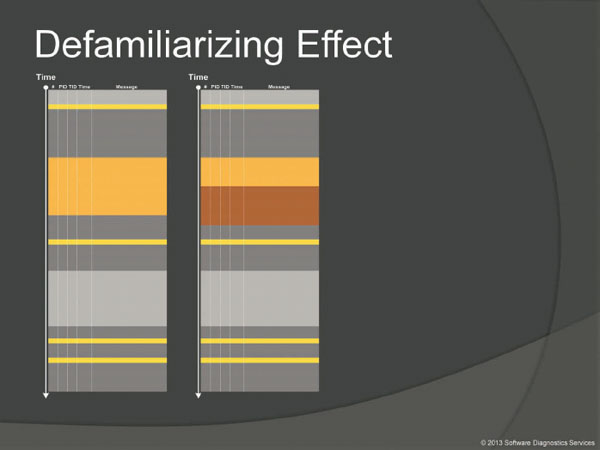
This pattern is about sudden unfamiliar trace statements across familiar landscape of Characteristic Blocks and Activity Regions. On the left we see familiar traces and on the right a new trace from an incident system.

This pattern is about abnormal or unexpected values in a software trace or log such as a network address outside expected range.
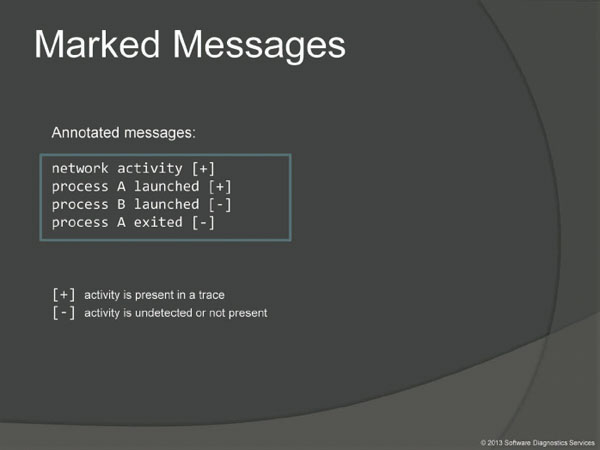
This pattern groups trace messages based on having some feature or property. For example, marked messages may point to some domain of software activity. Unmarked messages include all other messages that don't say anything about such activities or messages that say explicitly that no such activity has occurred. We can annotate any log after analysis to compare it with a Master Trace pattern (which is a normal expected trace corresponding to normal system).
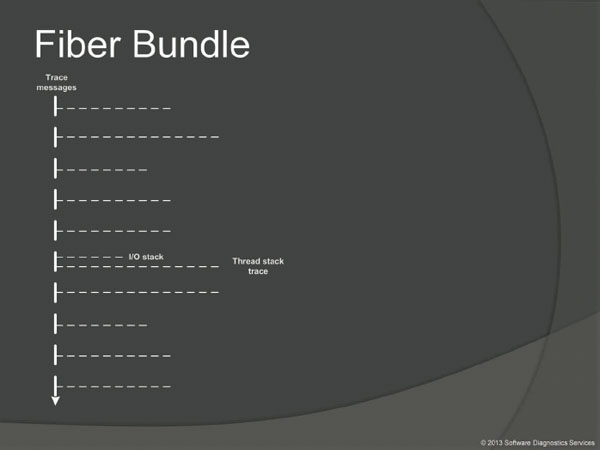
The modern software log recording, visualization and analysis tools provide stack traces associated with log messages. We can consider stack traces as software logs as well and, in a more general case, bundle them together (or attach as fibers) to a base software log. For example, a log message, that mentions an I/O request packet can have its I/O stack attached together with a thread stack trace with function calls leading to a function that emitted the log message.
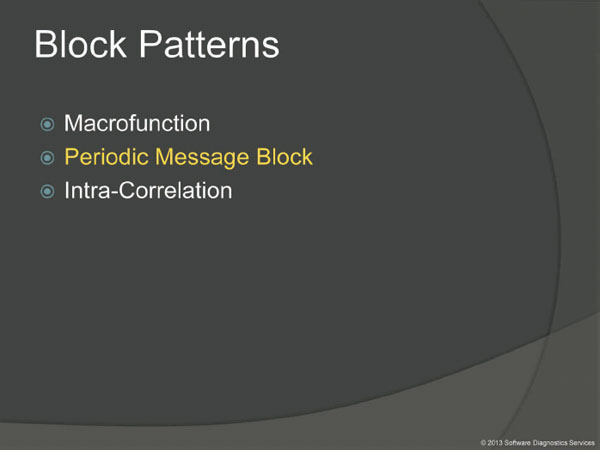
The seventh block is about patterns related to message aggregates or message blocks.
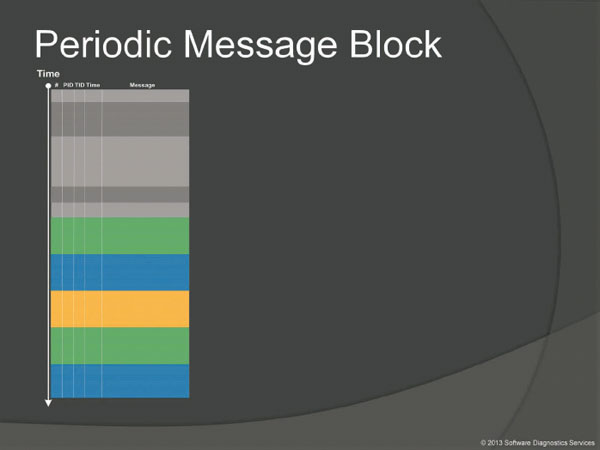
This is an obvious pattern, for example, a repeated network activity messages that are usually grouped together, so I don't provide any further comments here.
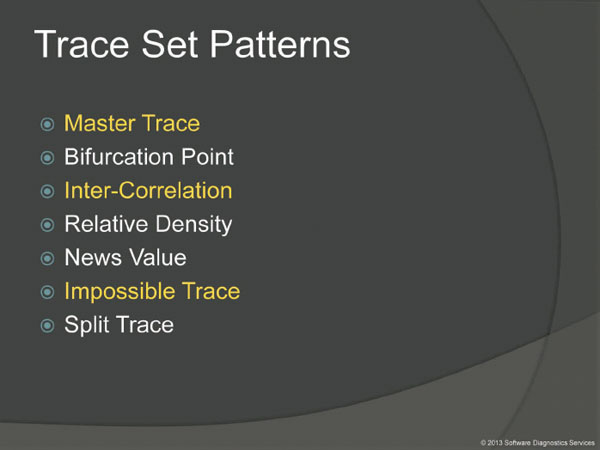
The eighth block contains patterns for trace sets when we have several software logs.

When reading and analyzing software logs we always compare them to a Master Trace which is a standard log corresponding to normal, incident free use case.

This pattern involves several logs from possibly different logging tools recorded (most commonly) at the same time or during an overlapping time interval. However, the purpose of using different logging tools is to cover events more completely. One of examples we can provide here is when we have a Discontinuity, a gap in one trace, and its interval events are covered by a different tool or we need to trace network activity more thoroughly in addition to file and registry activity.

Although rarely (at least for myself) but it happens that when we look at an execution trace and then say it's an Impossible Trace. For example, we see on the trace fragment shown on the left of this slide that the function foo had been called. However, if we look at the corresponding source code on the right we would see that something is missing: the function bar must have been called with its own set of trace messages we don't see in the trace. Here we might suspect that the runtime code was being modified, perhaps by patching. We can also suspect local buffer overflows that led to a wrong return address skipping the code with expected tracing statements.

Finally, we show a glimpse of what is forthcoming: a grand unification of software log and memory dump analysis through the so called generalized narrative. Usually a narrative is a temporal sequence of events and in the case of a software trace we can consider it as small memory fragments ordered by time. However, instead of time we can use any set as a domain of such mapping and even use memory itself and compose narratives together. I'll not talk more about it now.

Here are some links for further reading. All log analysis patterns are briefly described on Software Diagnostics Institute web site. They are also available in edited form in Memory Dump Analysis Anthology volumes starting from volume 3. Also there is a recorded introduction to Software Narratology and even a 4 hour accelerated training course.
Software Diagnostics Institute:
http://www.dumpanalysis.org
Memory Dump Analysis Anthology volumes:
http://www.patterndiagnostics.com/ultimate-memory-analysis-reference
Introduction to Software Narratology:
http://www.patterndiagnostics.com/Introduction-Software-Narratology-materials
Accelerated Windows Software Trace Analysis:
http://www.patterndiagnostics.com/accelerated-windows-software-trace-analysis-book
The next application of software narratology is network trace analysis. Please register for the forthcoming free webinar on our Software Diagnostics Services website.
Pattern-Oriented Network Trace Analysis:
http://www.patterndiagnostics.com/pattern-oriented-network-trace-analysis-materials
1 No longer free, please contact Software Diagnostics Services at www.PatternDiagnostics.com