Chapter 2
The Chicken KPI: Focus on outcomes and progress will come
“One accurate measurement is worth a thousand expert opinions”
– Grace Hopper
To start this chapter, we're going to take you out for fried chicken. A chain of fried chicken restaurants has been working incredibly hard to improve efficiency across its many outlets in the US. One of the KPIs they have set for their managers is to have as little leftover chicken at the end of the day as possible.
A few months after introducing this KPI, the managers at head office are pouring over the figures and they notice that one of their restaurants is consistently reporting zero leftover chicken. Clearly the manager of this outlet has cracked the art of reducing waste food. “Can you imagine what this might mean if we can share this solution with our other restaurant managers?” one manager says.
A consultant who has been working on the efficiency drive is asked to travel to this fried chicken restaurant to learn the manager's secret. When he arrives, he's greeted by the manager who proudly shows him around the premises.
The consultant makes notes as they go, looking at the working practices of his employees and seeing very little that is different to what he's seen in countless other restaurants in recent months. As they sit with a coffee, the consultant asks the all important question, “The reason I've been sent is because your record on waste chicken is the best in the business…” The manager beams. “Everyone at head office wants to know your secret, because we very much want to share it with our other managers and locations,” the consultant continues.
Still smiling, the manager replies, “It's really very simple; I just stop cooking chicken at 5pm every day, then it's always all sold by the time we close up.” The consultant pauses, looking flabbergasted, “But aren't you open until 11pm at night?” he asks. The manager nods, “Yes.”
“So what do you do if someone comes in at 8pm and asks for fried chicken?” the consultant asks, although he fears he already knows the answer. “I tell them that I can cook them some fresh,” the manager replies. “Do they wait?” The manager shakes his head as he says, “No, usually they leave because it takes about half an hour.”
The consultant has stopped writing. He knows this is definitely not the magic solution that those at head office were hoping for. He dreads to think how many customers this particular outlet has lost in recent months due to the manager's approach to reducing food waste.1
The moral of that story is that you have to be very careful what you measure, because you get what you measure. If you measure your outlets based on how much chicken they have left at the end of the day, they might have no leftovers, but you will also lose all the clients who come in after 6pm.
The Healing Pyramid
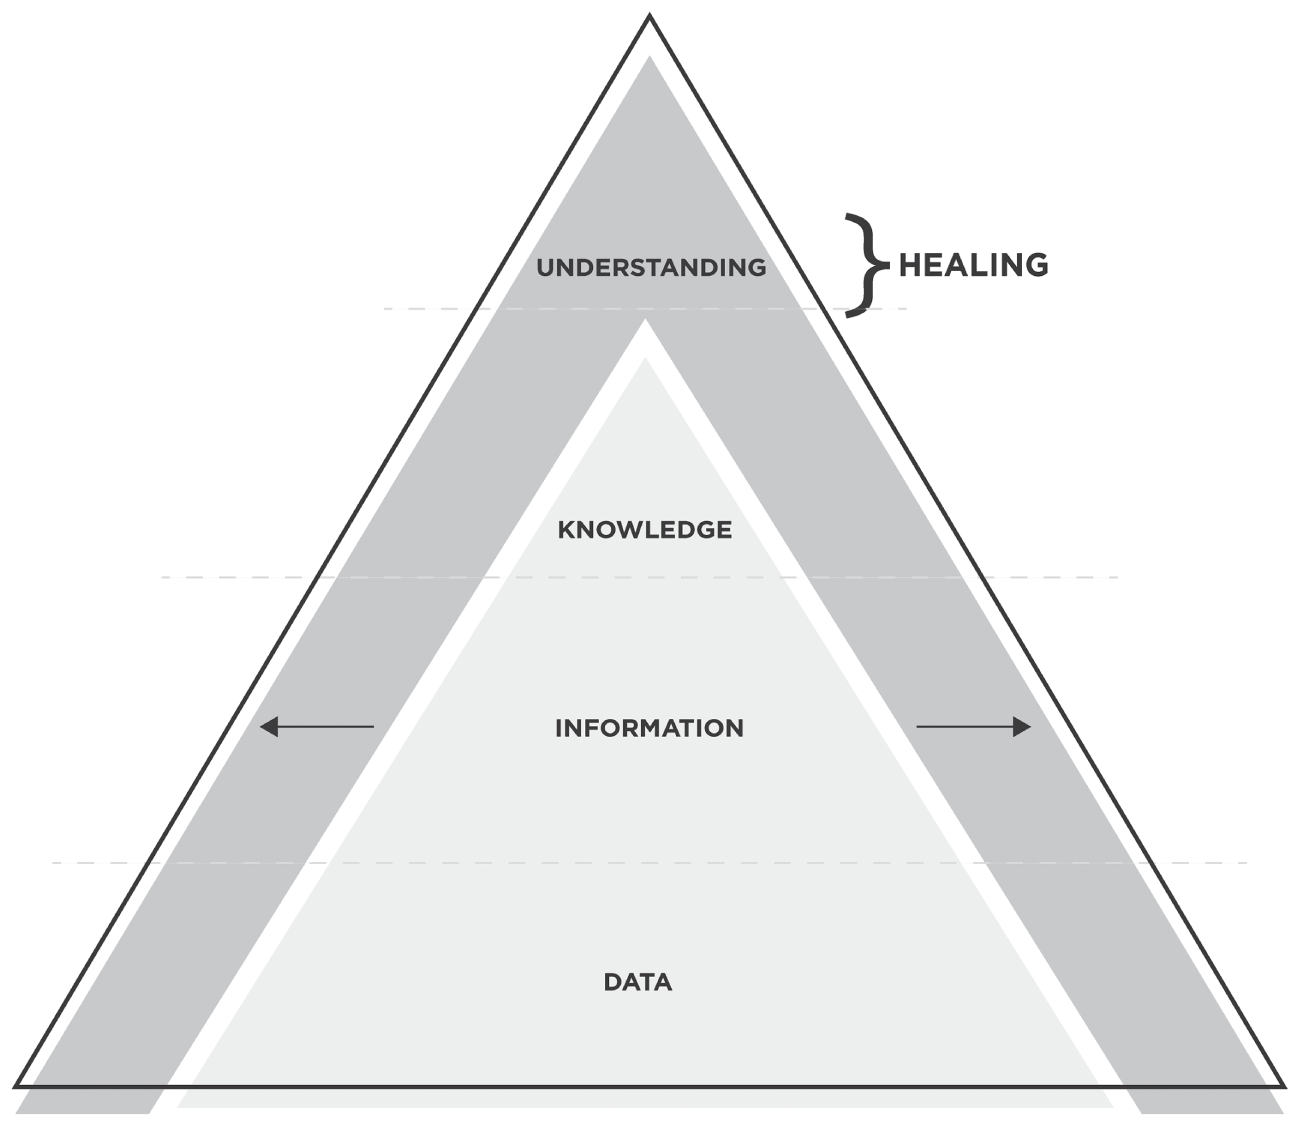
The Healing Pyramid was adopted by a medical researcher in South Africa who recognised that there was something missing from the traditional data, information, knowledge pyramid. You use data to create information, and you use information to drive knowledge, but this research recognised that you also need understanding to use that knowledge in the right way.
He explained this in the context of doctors and posed the question, why is it that, two years after a doctor gets 90% in their final exam, you can sit in their consulting room and watch as they struggle to diagnose the various symptoms of multiple sclerosis, even though they only studied it two years ago? It is because this knowledge is imparted outside the context of why they receive that knowledge; that is to say the understanding is missing. In this context, understanding is healing. His point is that if knowledge is imparted in a tertiary institution, outside the context of healing, those doctors don't learn to diagnose, they only recall knowledge they've learned.
In business this concept is incredibly important. If you put your business knowledge into the context of your organisation then you will be able to use that knowledge to solve problems that you didn't even realise you had solutions for, because you are starting from a place of understanding.
How does this relate to the chicken KPI story we just shared? That story is a demonstration of what can happen when you measure outside of that context of understanding.
To frame this another way, think about how you were taught times tables at school. If you're of a similar age to us, you probably learned by rote, so 2 × 2 = 4 and that's it. However, if you have kids, you may have seen that the way they now teach times tables is using a grid method because it breaks down multiplication to give children the understanding of why this works rather than teaching them to recall the answer.
When it comes to measurement in a business setting, you have to be able to contextualise the data you have and what that means for customer experience. If we take net promoter score (NPS) as an example, many businesses know that their customer satisfaction is lagging so they focus on increasing their NPS. They put in place all kinds of measures and religiously track their NPS and then celebrate when it increases from 7.6 to 7.7 for example. But if they can't contextualise what that actually means then what is the point?
What does that 0.1 point increase actually mean? Can you say whether that 0.1 point added X amount of revenue, saved X amount of clients or led to X amount of referrals? In the vast majority of cases, the answer is no. Too many organisations obsess about the measure, rather than what that measure is designed to bring, which in the case of NPS is improved customer experience, but what does this mean to the business? When you have understanding, you are able to bridge that gap, contextualise your knowledge and use it to make a material difference to your customers and therefore to your business.
A clear vision and purpose is essential to drive that understanding. In the last chapter we talked about the importance of the leader defining the vision and selling the dream. Like the principal of the Formula 1 race team, they set the direction of travel that the whole business is going to follow. Measurement is key, because without measuring what you're doing, you won't know whether you're progressing.
If you're not clear about what you should be measuring, you won't be able to track whether you're going in the right direction and moving towards your vision. As the chicken KPI story shows, if you measure the wrong metrics, you're going to move in the wrong direction.
In Formula 1 they measure everything to the nth detail. Look at the pit stop as an example. Not only does each team measure the overall length of their pit stop, which is defined by the length of time the car is stationary in the pit lane, but they also break this down into its constituent parts, measuring how long it takes to unscrew and screw on each individual bolt when changing the wheels, as well as how quickly the car is jacked up and lowered.
Beyond the pit stop itself, which has been reduced to under two seconds for all the top Formula 1 teams, they also measure pit lane time, which is the length of time their driver is in the pit lane. This contextualises their pit stop data, because having the fastest pit stop won't help you if your driver is in the pit lane itself for three seconds longer than your competitors. Time isn't the only metric that Formula 1 teams measure here either. They also measure the speed at which their driver enters the pit box, whether they hit their marks perfectly (and if doing so cost them any time), and many more.
Businesses can learn a great deal from the way in which Formula 1 teams approach measurement and how they use various data points to contextualise their overall performance. In Formula 1, measuring, understanding and contextualising even the smallest bit of data can be the difference between being a world champion team and going home empty handed, which is why every team in the sport invests so much to get the most out of every measurement.
First things first
In the first chapter we talked about setting out your dream or vision. That's a vital first step, because any organisation needs to know what it's trying to achieve. You need to ensure that everything is pointing to the top of that mountain. We want to help you focus on what the top of that mountain looks like and visualise the views from the summit. This is setting a clear vision and purpose.
However, we also know that the thought of climbing that mountain can be daunting and it's not a task you're going to complete in one go. Once we know what we're aiming for, we can start to break that down into small, incremental steps to make the whole process easier to digest.
Focus on the outcome
As Jeff Bezos says, “Don't proxy process for performance.” If you measure process, you'll get process. On the flip side, if you measure performance, you're more likely to get progress and move towards your vision.
Most businesses have too many projects. In addition, most businesses are geared up for starting projects, but they're not geared up for seeing them through. Be honest if this is an issue you can identify in your business. It's understandable because the traditional business process is centred around the business case and justifying the investment, but once that investment is approved, it becomes about tracking whether that investment is being spent on time and on target. What many organisations don't track is the outcome of that investment. Essentially they are measuring the process instead of what really matters: the result.
By bringing the focus back to the outcome, you gain clarity across the whole project and are able to ensure it moves forwards, rather than just moving with no real direction or clear purpose.
Not everything that matters can be measured
Albert Einstein once said, “Not everything you can measure matters, and not everything that matters can be measured,” and therein lies the issue. Businesses measure what they can, but it's important to acknowledge it can be difficult to measure certain metrics.
As we've said, this measurement also needs to happen in the context of understanding. Budgets are a good example, because businesses often measure whether a budget was spent, rather than understanding what it was spent on and how, in the context of what they're trying to achieve, it will drive progress.
These silos, caused by a failure to align measures, are a challenge in business. They are divided – it's right there in the name, you have different divisions of a business, from marketing, finance and accounting to sales, operations and logistics. Within a business, each of those is considered to be distinct. However, when you're trying to deliver for a customer it cuts across all of those divisions.
From a customer's point of view, they have purchased one logo, one brand. It's not their responsibility to know which division of a business they need to speak to, or to understand how departments are divided. Externally, the process needs to appear seamless.
Within a business, each division might measure what goes on in their part of the business, but seldom does anybody take ownership of and measure across divisions. There is no connection between the areas they can't control. There are no cross-functional ways of working embedded within the culture. When it comes to the customer experience in particular, we have to take a step back and ask what matters? What is the actual outcome we're trying to achieve across the whole business, rather than a result within a single department? We have to measure what matters.
It sounds simple when you put it like this, but why is it that so many companies fail to consider projects across the whole business? The simple answer is because it isn't measured. American businessman Lou Gerstner once said, “People don't do what you expect, they do what you inspect.” Most businesses inspect in silos, not across them. Just look at the story at the beginning of the chapter: if you measure the amount of chicken left at the end of the day, you get no chicken, but in that case you have to ask, what are you losing?
Another factor to consider is that most businesses measure what they know and habits form a part of this issue as well. When it comes to deciding what to measure, it's important to take a step back and ask that vital question, “How are we going to measure performance as a whole?” You have to look at what is already being measured within your teams or business and ask why you are tracking those metrics. Is it because they are important for helping you achieve your vision, or is it because you always have?
Connecting the dots
As we saw in the chicken KPI story, when you measure the wrong metric, you can get the wrong results. Often the reason an organisation is measuring the wrong metric is because there is a huge disconnect between the different divisions in the business.
Let's look at another example with a telecommunications company, where the aim was to optimise the website to increase handset sales. We're going to give you two scenarios in terms of measurement, as you're reading think about which would have the most positive outcome.
- Scenario A: The main measure for the team tasked with improving sales of handsets is conversion rate. This is their key KPI and, under the contract with the company, they have a performance related incentive pay (PRIP) relationship. The team is doing really well at increasing the sales of handsets, to the point at which the company begins to run out of stock. This, understandably, has a negative effect on the customer experience. Their only option is to reduce their performance, and therefore see their remuneration take a hit, in order to ensure customer experience isn't impacted.
- Scenario B: The team will be assessed on its performance on two key measures: conversion rate and customer satisfaction on receipt of the handset. As with Scenario A, they also have a PRIP relationship that's linked to these two KPIs. The team is doing really well at increasing the sales of handsets and they notice that there is likely to be a supply issue in the coming weeks due to high takeup of new handsets. They change their tactics accordingly, ensuring that every customer that orders and receives a handset has a good experience, while slowing sales of new handsets until they have a new supply of devices. Their remuneration isn't affected, because customers are satisfied with the service and when new handsets become available they are able to ramp up their sales activities again.
This is a great example of where businesses need to balance profitability with customer experience. Focusing on only profitability can lead to negative experiences. Focusing on only experience can lead to negative profitability. Empowering the crew to focus on both can lead to a positive outcome.
There's an old African proverb: “If you want to go fast, travel alone. If you want to go far, travel together.” Often what happens is that different business divisions work alone and don't communicate or consider the impact their activity might have on another division, like the example we shared earlier. When you completely disconnect departments, particularly those that have an impact on one another, you incentivise people to make the wrong decisions and do the wrong things – even if they appear to be for the right reasons.
You can see how this played out between the acquisition and retention teams we mentioned earlier, but this is a common issue within organisations across all industries. You see a similar issue when you look at retention teams, who are measured on how many customers they prevent from leaving, so all they do is give away products and reduce people's bills. What we want to do is join the dots. By making that connection across business silos, you can make sure that you're measuring what matters for the business as a whole, not just individual teams.
Measurement as a catalyst for change
The key, and what we focus on in our work with all of our clients, is changing organisational structure so that the focus is no longer on channels and products but on teams of people who are measuring the right metrics.
These teams collaborate, they work together, they sit side by side and in doing so they solve problems for clients, whatever those problems might be. This puts the focus on whether you have met the needs of your customer, not whether the website or mobile app is working. This is all part of the evolution that we talked about in the last chapter, where organisations are becoming more agile, adaptive and have the ability to respond to markets that are never going to stop changing.
Adapt or die is a key concept for organisations in any industry to grasp. How do you make sure that your business is always adapting? By structuring it to enable it to be more agile and adaptive. Measurement plays an important role as a catalyst for change in the structure of your organisation and behaviours across teams.
The telecommunications company that we described above also took a similar approach to improving its retention issues. It recognised that it had significant early life churn, which means customers sign up but then cancel within their 90-day cooling off period. To encourage its sales teams to focus on signing the right customers, it decided to only pay its call centres on successful new acquisitions if they were still a customer in month four. This changed their approach from a hard sell to a need-based sell, and sales volumes went down, but average customer tenure and customer profitability increased.
Does it make the “car” go faster?
When you measure the right metrics, you can make better and faster decisions for your business. This concept is illustrated really well in the film Ford v Ferrari, which tells the story of Ford's efforts to build a revolutionary race car that could beat a Ferrari in the 1966 Le Mans race.
Ford hired Carroll Shelby to create this car and he hired driver Ken Miles to support him in the project. Their process was to incrementally improve the car over time and the question they always asked was, “Did it make the car faster?” If the answer was yes, they kept it and if the answer was no, they didn't.
When you're talking about this concept in relation to race cars, it's easy to know what to measure: Did you go faster? Did your car cross the line first? However, within businesses it can be more challenging to discern what to measure, because each division is like one subset of the car's engine. How do you measure that one specific part to work out if it is actually making the car go faster? This comes right back to the vision, because each division needs to know what it's contributing to in order to find the right metrics to measure.
Always ask “Why?”
In 2009, Simon Sinek delivered a very engaging TED Talk3 where he explained his model for inspirational leadership, which always starts with “Why”. His model is very simple, it's just three nested circles with why at the centre, how in the next circle and what in the outer circle. Sinek explains that most businesses start with what they do and they move inwards, explaining how and often forgetting about the why.
He uses Apple as an example of a company that communicates its why first. Their communication with their customers starts with, “Everything we do, we believe in challenging the status quo. We believe in thinking differently.” That's their why. Then they move to the how with “The way we challenge the status quo is by making our products beautifully designed, simple to use and user friendly.” Only then to they get to the what, “We just happen to make great computers.” What he very succinctly explains is that it's much more engaging when you start with why you do what you do, rather than what you do. Every business talks about what they do, but what differentiates you from other companies in your space is why you do it.
Aviva is a great example of a company that has made an effort to shift away from being a product-centric organisation to a customer-centric organisation. They recognised that they needed to understand their customers better if they wanted to encourage them to hold multiple products with their organisation.
One very simple step they took was to pull their strategy and related measures together on a single slide. That slide appeared at the start of every presentation or proposal that they made and if the proposal didn't align with what they were trying to achieve based on that slide, the project was deprioritised accordingly.
Customer experience vs revenue
When a business makes a decision to focus on revenue rather than on the customer experience, it's important to ask just how much it will be compromising on. Is that really the only metric you want to focus on?
This particular airline differentiates itself purely on price and as a result it has compromised on every other definition of value. This example also ties in with what we discussed in the previous chapter in terms of empathy versus emotional intelligence. This business might put a tick in its empathy box, but what it actually needs is a process that enables its staff to act with emotional intelligence.
The KPI Tree
For modern businesses to stay abreast of the relentless progression of change requires so many areas of parallel activity, that it is extremely difficult to know just what to focus on, and when to make it a priority. Everything seems urgent, and with businesses generally very siloed, it is a real challenge to get to the measures that really matter. The ones that will align the business to the purpose and drive the change to get there.
You need a method to get to the real drivers of value for your business. The metrics that will change your outcomes and drive the business forward. Metrics that don't get obscured by the current business structures, cultural perceptions and misalignment, technology initiatives, global vs. local constructs, etc., but are relevant to all of them. A method that can get to what really matters and ensure the focus is on making them happen.
A method that can also help the business prioritise these metrics so you don't try and do everything at once, but also recognising that not all businesses, markets or brands are created equal, and so even if the same metrics are defined, how to change them could require very different priorities for different businesses.
On race day back at the track, all the many metrics the team records are connected to a live screen where multiple real-time scenarios can play out. If we pit our driver now, and put the hard tyres on, he will fall back to sixth place, but on fresher tyres he will be 1.3 seconds a lap faster and so looks to catch the leader with two laps to go. If the pit stop takes two seconds longer than planned, the driver comes out in eighth place. This means the settings on the car need to change to compensate for the extra speed now required to do an additional overtake and it's now going to need to happen on the last lap.
All of these metrics are connected, and they all are optimised to the final position on the track when the chequered flag comes down.
In most organisations, very few of the crucial metrics impacting overall value are truly connected. Many measures don't directly impact any outcome at all, and so the movement of them consumes time and motion, but can't be directly linked to any tangible outcome or progress.
This is where the multifunctional KPI tree comes in:
We use a mathematically connected KPI tree to solve these challenges. A logical process that unpacks the business objectives into a series of connected metrics and levers, and links the actions the business must take to move these performance levers (we developed a KPI tree for a multinational retailer turning over €34bn and there are fewer than 20 core levers that drive the business, so the focus is really on the levers that matter).
This tree can, of course, turn into a forest really quickly, but the logic of the process ensures that this doesn't happen, and the focus is put on actions that drive material value, in a prioritised way.
We have talked in this chapter about the importance of measuring what matters and using these measures to drive focus and alignment. This is only possible with the measures that really drive the business, and most of these will cut across silos and business functions and even geographies. Without some framework with which to do this, many businesses measure what they can, rather than what they should and so motion is often not translated into the progress that it should.
We have included a subset of this process to get you on your way (if this has resonated with you and you feel this is something your business lacks). It would not be possible to put our full KPI framework to work in this book (it is a complicated process and requires experienced facilitation) but the approach is logical, and we have created a sample of how this works to illustrate it for you. This should be enough detail to take you through how to get to the metrics that matter, but it is not intended to be a substitute for the full process.
 Progress accelerator
To test the metrics you have at your organisation and learn how you can improve the metrics you're setting, use the KPI tree exercise on our website: www.motionintoprogress.com
Highlights
The key takeaway from this chapter is that you get what you measure. If you measure the right things, you'll drive the right behaviours which will result in a business that isn't just moving, but is making significant progress too.
As we said in the introduction to the book, rocking horses don't belong in boardrooms. You have to get away from mistaking motion for progress, because a rocking horse will move all day but it won't go anywhere. You have to turn that motion into progress and forward momentum. The way to do this is to make sure you're very clear about not only what you're measuring, but also that you're certain you're measuring the right metrics.
You get what you focus on, so by measuring the right metrics you direct the focus of everyone in your business to the right outcomes. Almost every business could probably benefit from questioning its metrics and asking why it measures certain things, and whether those really lead to the desired outcomes. As we've seen, measurement can be a powerful catalyst for behaviour change within businesses.
Leaders need to ensure that the metrics they measure tie in with their vision, but they also need to continually check that the metrics they are measuring are still the right ones as the business and the world evolves. Experience is the new battleground and that presents a multitude of challenges for businesses in terms of what and how to measure. Get measurement right, however, and you will go into the competitive battleground armed with a significant advantage.
Notes
- 1 Mark Brown, (2019), ‘The Chicken KPI: Be Careful What You Measure’, Corporater, 18 Feb 2019, available at: https://corporater.com/en/the-chicken-kpi-be-careful-of-what-you-measure/
- 2 Groundhog Day, (1993), Harold Ramis, Columbia Pictures
- 3 Simon Sinek, (2009), ‘How great leaders inspire action’, TED Talks, September 2009, available at: https://www.ted.com/talks/simon_sinek_how_great_leaders_inspire_action