Chapter 1
Get started with SQL Server tools
This chapter provides information about where to find many of the Microsoft tools used to manage and work with the Microsoft SQL Server platform. It also walks you through the installation, configuration, and basic utility of each tool, including an overview of the two main tools for working with SQL Server: SQL Server Management Studio (SSMS) and Azure Data Studio (ADS).
Note
Although SQL Server 2022 also runs on Linux, some of the administration tools that work with the Windows Server version do not work with the Linux version. We note the specific cases for which platform-specific tools are available.
SQL Server setup
You can install SQL Server 2022 natively on Windows and Linux. All SQL Server containers rely on SQL Server on Linux images from Ubuntu or Red Hat. These images can be deployed to desktop machines using Docker or Kubernetes whether you are running Windows, macOS, or Linux for development purposes. For production support, you can only deploy those containers to a Linux machine running Docker or Kubernetes with full support.
The following section covers installing SQL Server natively on Microsoft Windows.
 For more details on how to set up and configure SQL Server, read Chapter 4, “Install and configure SQL Server instances and features.”
Install SQL Server with the Installation Center
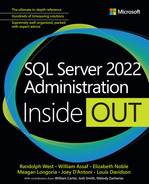
The SQL Server Installation Center is the application you use to install and add features to an instance of SQL Server. If you are installing SQL Server manually, this is the application that opens when you run the Setup.exe file for SQL Server. As illustrated in Figure 1-1, it can also serve as a launch point for downloading the installation packages for Data Migration Assistant (which replaced the SQL Server Upgrade Advisor), SQL Server Management Tools, SQL Server Reporting Services, and SQL Server Data Tools.
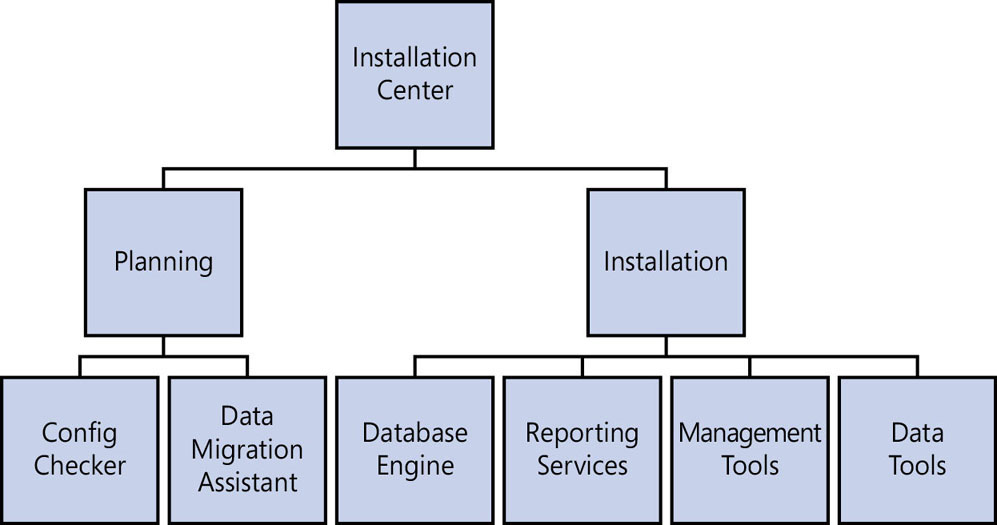
Figure 1-1 Installation Center components.
It might seem a bit confusing, but on the Installation tab, the installers for SQL Server Reporting Services, SQL Server Management Tools, and SQL Server Data Tools are merely links that redirect to a download location on a Microsoft website for each of these components’ installation files. You also can download and install the tools independently without using Installation Center. These links are available as a sort of backward-compatibility option. Prior to SQL Server 2017, these installers were included in the Installation Center.
Note
As a best practice, you should install SQL Server Management Studio and Data Tools only on client machines, not the production instance. This ensures a smaller installation and administration footprint on the server. It is therefore uncommon to use the Installation Center on client machines.
Plan before an upgrade or installation
When you first start the SQL Server Installation Center, it opens with the Planning tab preselected. This tab has two tools that you might find useful before installing or upgrading a SQL Server instance to SQL Server 2022: Configuration Checker and Data Migration Assistant.
Configuration Checker
The Configuration Checker tool checks for conditions that might prevent a successful SQL Server 2022 installation. When you choose Configuration Checker, a wizard runs on the local server. There is no option to choose an alternate computer location. The wizard returns an HTML report listing all installation requirement rules (facets) and the results of each test. Most of these rules are universal to all Windows configurations, and you can easily remedy most of them.
AclPermissionsFacet. Checks if the SQL Server registry keys are consistent. Certain registry keys are required to install SQL Server and some registry key values must match. If these matching values are not present and consistent, SQL Server will not be successfully installed or upgraded.
FacetDomainControllerCheck. We recommend that you do not install SQL Server 2022 on a domain controller, for two reasons. First, it can compromise the security of both Active Directory and the SQL Server instance. Second, it can cause resource contention between the two services. Microsoft also recommends against installing SQL Server on a domain controller. For more information, see https://learn.microsoft.com/sql/sql-server/install/security-considerations-for-a-sql-server-installation#Install_DC.
IsDotNetInstalled. This rule determines if the Microsoft .NET Framework 4.7.2 or newer is installed on the system.
MediaPathLength. The path for the location from which SQL Server 2022 is being installed must be fewer than 260 characters in length.
RebootRequiredCheck. No installation reboots can be pending.
SetupCompatibilityCheck. No subsequent incompatible versions of SQL Server can be installed on the computer.
ThreadHasAdminPrivilegeCheck. The account running SQL Server must have administrative rights on the computer.
WmiServiceStateCheck. This checks whether the Windows Management Instrumentation (WMI) service is started and running on the computer.
Note
The minimum version of Windows Server for SQL Server 2022 is Windows Server 2016.
Data Migration Assistant (DMA)
There is a link on the Planning tab in the Installation Center to download the Data Migration Assistant installation package.
Note
The Data Migration Assistant is now continually updated by Microsoft. You can download the most recent version from https://www.microsoft.com/download/details.aspx?id=53595.
This application is really two tools in one, which you can use to create two project types:
An assessment of upgrade or migration readiness
A migration of data between versions of SQL Server and/or Azure SQL Database
For the assessment project type, the source server can be either a SQL Server instance or Amazon Web Services (AWS) Relational Database Service (RDS) for SQL Server instance. For the migration project type, the source server must be a SQL Server instance. The following target server choices accommodate both assessment and migration:
Azure SQL Database
Azure SQL Managed Instance
SQL Server on Azure Virtual Machines
SQL Server
Assessment
The assessment project type of the Data Migration Assistant detects database-specific compatibility issues between origin and destination SQL Server versions during pre-upgrade discovery. It is common between versions for there to be deprecation and feature differences, and this is especially true if the target server type is an Azure SQL Database. If not addressed, some of these items might affect database functionality during or after upgrade. The tool neatly outlines all findings and makes recommendations.
The assessment project type examines the following aspects of upgrading or migrating SQL Server:
Feature parity. The assessment project provides a comprehensive set of recommendations, alternative approaches available in Azure, and mitigating steps.
Compatibility issues. The assessment project provides partially supported or unsupported features that would block migration. Compatibility issues are categorized as breaking changes, behavior changes, or deprecated features.
Note
You can find a list of T-SQL differences between SQL Server and Azure SQL Database at https://learn.microsoft.com/azure/sql-database/sql-database-transact-sql-information.
Migration
Using the migration project type of the Data Migration Assistant, an administrator can move a database’s schema, data, and other objects such as database roles from a source server to a destination server. The wizard associated with this feature works by providing a user with the option to select a source and destination server and to choose one or more databases for migration.
The Migration Scope setting allows you to choose what to migrate. You can choose between the database schema only, the data only, or both the schema and data.
Move to SQL Server
For SQL Server migrations, there must be a backup location that is accessible by both the source and the destination server—generally a UNC path, such as \server01foldersubfolder. If this is a network location, the service running the source SQL Server instance must have write permissions for the directory. In addition, the service account running the destination SQL Server instance must have read permissions to the same network location.
If this poses a challenge, there is a Copy The Database Backups To A Different Location That The Target Server Can Read And Restore From check box that you can select to break up the process into steps and utilize the (hopefully) elevated permissions of the administrator running the wizard.
When you select this option, the security privileges of the account of the individual running the Data Migration Assistant are used to perform the copy of the file from the backup location to the restore location. The user must have access to each of these locations with the needed read and write permissions for this step to succeed.
The wizard also gives the user the option to specify the location to restore the data files and log files on the destination server.
As a final step, the wizard presents the user with a list of logins for migration consideration, with conflicting login names or logins that already exist identified. Where possible, the wizard attempts to map orphaned logins and align login security IDs (SIDs).
Move to Azure SQL Database
The Data Migration Assistant tool performs an Azure SQL Database migration in two phases:
Schema. First, it generates a script of the database schema (you can save this script before deployment for archival and testing purposes), which you deploy to the destination database.
Data. If you choose to move the data, another step is added after the creation of the tables on the destination database. This gives you the opportunity to verify that all tables exist in the destination database after the initial schema migration. Data migration uses Bulk Copy Program (BCP) under the hood. Any trusted constraints from the source database should be trusted in the database after data is copied, but it is a best practice to validate that constraints did not become untrusted in the copy process.
The schema migration is required; the data migration is optional.
Install or upgrade SQL Server
When it comes to administration and development tools used to work with SQL Server, the other important tab in the Installation Center is the Installation tab. This tab contains a link to install the Database Engine (the SQL Server service). A few of the utilities discussed in this chapter are installed as options only during a full Database Engine installation and cannot be downloaded and installed independently.
During an in-place upgrade of an existing SQL Server instance, you can neither add nor remove components. The process will simply upgrade existing components.
Caution
An in-place upgrade to SQL Server 2022 will uninstall SQL Server Reporting Services if it is installed.
If you have multiple versions installed on the same server (instance stacking), several shared components will be upgraded automatically, including SQL Server Browser and SQL Server VSS Writer.
- You can read more about multiple instances and versions of SQL Server at https://learn.microsoft.com/sql/sql-server/install/work-with-multiple-versions-and-instances-of-sql-server.
Tools and services installed with the Database Engine
SQL Server 2022 provides optional tools and services that you can select during the installation process. We look at some of them in the sections that follow. (Note that this list is not exhaustive and that some of these components might not be available in SQL Server 2022 on Linux.)
- For more in-depth information about configuring features, see Chapter 4.
Machine Learning Services
Starting with SQL Server 2016, Microsoft has created an extensibility framework for executing external code on SQL Server. Machine Learning Services now support the following external languages:
R (introduced in SQL Server 2016)
Python (introduced in SQL Server 2017)
Java (introduced in SQL Server 2019)
Machine Learning Services is available for both Windows and Linux.
A Database Engine instance is required for Machine Learning Services in SQL Server 2022. Support for the previously available standalone Machine Learning Server, which supported R and Python, ended on July 1, 2022.
Beginning with SQL Server 2022, runtimes for R, Python, and Java are no longer installed with SQL Setup. You must run the SQL Setup Wizard to install Machine Learning Services and Language Extensions. Then you must install your desired R, Python, or Java runtime(s) and packages.
Note
After installing your desired runtime(s), be sure to enable the external scripting feature using the following TSQL command:
EXEC sp_configure 'external scripts enabled';Then restart the SQL Server service.
- There are separate Microsoft Docs articles for installing Machine Learning Services on SQL Server 2019 and prior and for SQL Server 2022. For installation on SQL Server 2022 on Windows, see https://learn.microsoft.com/sql/machine-learning/install/sql-machine-learning-services-windows-install-sql-2022. For information about installing Machine Learning Services for SQL Server 2022 on Linux, see https://learn.microsoft.com/sql/linux/sql-server-linux-setup-machine-learning-sql-2022.
Data Quality Services
Standardizing, cleaning, and enhancing data is critical to validity when performing analytical research. SQL Server Data Quality Services allows for both homegrown knowledgebase datasets and cloud-based reference data services by third-party providers.
Data Quality Services is a product that facilitates important data quality tasks, including the following:
Knowledgebase-driven correction
De-duplication
Additional metadata enrichment
Data Quality Services has two parts: the Data Quality Server and the Data Quality Client. Data Quality Server has a dependency on the Database Engine. Apart from that, you can install these two components on the same computer or on different computers. The tools are completely independent, and you can install them in any order. (In other words, it doesn’t matter which one you install first.)
To be functional, the Data Quality Client tool needs only to be able to connect to a Data Quality Server. In addition, there are certain operations the Data Quality Client can perform that require an installation of Microsoft Excel local to the client installation. It is commonplace to have the Data Quality Client on one or more workstations, but not the computer running SQL Server.
Data Quality Server
To install Data Quality Server, you must first select its check box during SQL Server 2022 setup. This copies an installer file to a drive you specify. After you install SQL Server 2022, you can install Data Quality Server. To start, in your Windows Start menu, expand Microsoft SQL Server 2022, and then select SQL Server 2022 Data Quality Server Installer. This runs the DQSInstaller.exe file. The installation asks you to type and confirm a database master key password. It then creates three new databases into the SQL Server instance chosen as the host server: DQS_Main, DQS_Projects, and DQS_Staging_Data.
Data Quality Client
The Data Quality Client is an application used in conjunction with master data management (not to be confused with Master Data Services), data warehousing, or just plain data cleaning. It is typically used by a data steward who has a deep understanding of the business and domain knowledge about the data itself. You can use this tool to create knowledgebases surrounding data element rules, conversions, and mappings to help manage and align data elements. You can also use it to create and run data quality projects and to perform administrative tasks.
To sign into a Data Quality Server using the Data Quality Client tool, you must be either a member of the sysadmin server role or of one of these three roles in the DQS_Main database:
dqs_administrator
dqs_kb_editor
dqs_kb_operator
Command line interface
You can use and administer SQL Server from a command line. This is especially relevant with Linux as a supported operating system (OS) for SQL Server. Utilities such as SQLCMD and BCP run on Windows, Linux, and macOS, with some minor differences.
SQLCMD
The SQLCMD utility is used to run T-SQL statements, stored procedures, or script files, using an ODBC connection to a SQL Server instance.
Although some people might consider the SQLCMD utility “old school” because it has been around since SQL Server 2005, it is still very popular because of its utility in automating scripts. You can invoke SQLCMD from any of the following:
Windows, Linux, or macOS command line
Windows, Linux, or macOS script files
SQL Server Agent job step
Using PowerShell with the command line
Note
Both SQL Server Management Studio and Azure Data Studio can invoke SQLCMD mode, which makes possible some very useful functionality. Although it’s technically part of SQLCMD, it is not strictly a command line tool. You can read more about it at https://learn.microsoft.com/sql/relational-databases/scripting/edit-sqlcmd-scripts-with-query-editor.
BCP
If you think SQLCMD is “old school,” hold on to your hat. The Bulk Copy Program (BCP), introduced in 1992 with the release of the very first edition of SQL Server, makes SQLCMD look like the new kid on the block.
It is quite a testament that to this day, BCP is still a practical way to work with SQL Server to insert or export large quantities of data. It uses minimal logging techniques and bulk data flows to its advantage.
If this reminds you of SQL Server Integration Services, be aware that BCP is not nearly as powerful. You use BCP to move data between data files (text, comma-delimited, or other formats) and a SQL Server table.
You can use BCP to import files into SQL Server tables or to export data from SQL Server tables into data files. BCP requires the use of a format file to designate the structure of the receiving table and the data types allowed in each column. Fortunately, BCP helps you to create this format file quite easily.
There are a few things about BCP that you must understand and do for the tool to perform optimally:
Put the database into the simple or bulk-logged recovery model.
Drop any non-clustered indexes on the destination table.
Insert sorted data and use the
sorted_dataoption if a clustered index exists.Run BCP on the same machine as the SQL Server.
Place source and destination files on separate physical drives.
Manually grow SQL data files in advance if growth is expected.
Take advantage of instant file initialization.
Use
sp_tableoptionto set table lock on bulk load (TABLOCK) to ON.- For more information, go to https://learn.microsoft.com/sql/tools/bcp-utility.
SQL Server PowerShell Provider
If you love to use a command line or if you have begun to use PowerShell to help manage and maintain your SQL Servers, Microsoft offers the PowerShell Provider for SQL Server. It can be installed with Windows PowerShell and PowerShell 7.
Note
There are two PowerShell modules for SQL Server: SQLPS and SQLServer. SQLPS is an older module included in SQL Server for backward compatibility but is no longer updated. You should use the SqlServer module, which is installed separately via the PowerShell Gallery and is regularly updated. SqlServer also provides functionality to run SQLCMD scripts by using the invoke-sqlcmd cmdlet.
The SQL Server PowerShell Provider uses SQL Server Management Objects (SMO), which are included when you install the SqlServer PowerShell module. These objects were designed by Microsoft to provide for the management of SQL Server programmatically. There are many ways that developers and administrators can use PowerShell to automate their work in SQL Server, especially when dealing with multiple server environments.
- To learn more about automation in SQL Server using PowerShell, see Chapter 8, “Maintain and monitor SQL Server.”
SQL Server Configuration Manager
SQL Server Configuration Manager is a tool that uses the Microsoft Management Console as a shell. To launch SQL Server Configuration Manager, locate SQL Server 2022 Configuration Manager on the Windows Start menu under Apps or search for SQLServerManager16.msc.
Note
SQL Server on Linux has its own set of configuration tools, which you can read about in Chapter 5.
Administrators use SQL Server Configuration Manager to manage SQL Server services. These services include the Database Engine, the SQL Server Agent, SQL Server Integration Services, the PolyBase Engine, and others. SQL Server Configuration Manager provides a graphical user interface (GUI) to perform the following tasks associated with SQL Server–related services:
Start or stop a service
Alter the start mode (manual, automatic, disabled)
Change startup parameters, including trace flags
Create server aliases
Change the service Log On As accounts
Manage client protocols, including TCP/IP default port, keep alive, and interval settings
Manage FILESTREAM behavior
Performance and reliability monitoring tools
The Database Engine Tuning Advisor, Extended Events, and Profiler tools are installed with the Database Engine and do not require additional installation steps. This section explores each of these tools in more detail.
Database Engine Tuning Advisor
Among the many administrative tools Microsoft provides to work with SQL Server is the Database Engine Tuning Advisor. You can start it either from the Start menu or from within SQL Server Management Studio (SSMS) by selecting Tools > Database Engine Tuning Advisor. Using this tool, you can analyze a server-side trace captured by SQL Server Profiler. It analyzes every statement that passes through the SQL Server and presents various options for possible performance improvement.
Note
The Database Engine Tuning Advisor is not supported on Azure SQL Database or Azure SQL Managed Instance.
The suggestions made by the Database Engine Tuning Advisor focus solely on indexing, statistics, and partitioning strategies. The Database Engine Tuning Advisor simplifies the implementation of any administrator-approved changes it suggests. You need to scrutinize these changes to ensure that they will not negatively affect the instance.
Caution
You should not run the Database Engine Tuning Advisor directly on a production server because it can leave behind hypothetical indexes and statistics that can persist without a DBA’s knowledge. These will require additional resources to maintain. Use the is_hypothetical column in the sys.indexes system view to find hypothetical indexes for manual removal.
Extended Events
Technically, the Extended Events GUI (client only) is installed with and is a built-in part of SSMS, but we discuss it here with the other performance-specific tools for categorical reasons.
- You can read more about how Extended Events are supported in Azure SQL Database, with some differences, at https://learn.microsoft.com/azure/sql-database/sql-database-xevent-db-diff-from-svr.
SQL Server Extended Events (or XEvents) is an event-handling system created to replace SQL Server Profiler. Think of it as the “new and improved” version of Profiler. It is more lightweight, full-featured, and flexible, all at once. Extended Events offer a way to monitor what’s happening in SQL Server with much less overhead than an equivalent trace run through the SQL Profiler. This is because Extended Events are asynchronous.
You access Extended Events through SSMS by connecting to a SQL Server instance, navigating to the Management folder, and expanding the Extended Events node to display Sessions. Right-click Sessions; then, on the shortcut menu that opens, select New Session Wizard. You can use this wizard to schedule events to run at server startup or immediately after the event has been created.
Note
SQL Server Management Studio provides a simple Extended Events viewer called XEvent Profiler. It is meant to replace the standalone Profiler tool for monitoring activity in real time on a SQL Server instance.
Scripting Extended Events sessions via T-SQL can be a much quicker and more consistent way to create a library of Extended Event sessions for reuse in multiple environments. This gives you the flexibility to start and stop them as needed, even as a job in SQL Server Agent.
- For more information on using Extended Events, see Chapter 8.
Scenarios for use
You can use Extended Events in a wide range of scenarios. There are more than 1,700 events available in SQL Server 2022. Here are some of the most common uses for Extended Events:
Troubleshooting
Diagnosing slowness
Diagnosing deadlocks
Diagnosing recompiles
Debugging
Login auditing
Baselining
By scripting out an event session and using automation, you have a stock set of sessions that you can use to troubleshoot depending on the problem. You can deploy these solutions on any server that needs a closer examination into performance issues.
You can also use Extended Event trace to provide a baseline from which you can track code improvements or degradation over time.
Management Data Warehouse
The Management Data Warehouse (MDW), introduced in SQL Server 2008, collects data about the performance of a SQL Server instance and feeds the information back to an administrator in a Visual Analytic–style format.
MDW has not seen significant new feature development since it was released. It has not been broadly adopted and has mostly been supplanted by Query Store and other third-party monitoring tools.
MDW has its own relational database containing tables that are the recipient (target) of specific Extended Events collection activities. Upon installation, MDW provides three reports: Server Active History, Query Statistics History, and System Disk Usage. You can create additional reports and add them to the MDW collection. Using this three-report configuration makes it possible for a database administrator to do basic performance baselining and to plan for growth. It also allows for proactive tuning activities.
- For more information on configuring a Management Data Warehouse, see https://learn.microsoft.com/sql/relational-databases/data-collection/configure-the-management-data-warehouse-sql-server-management-studio.
SQL Server Reporting Services (SSRS)
Starting with SQL Server 2017, SQL Server Reporting Services (SSRS) is a separate download outside the SQL Server installer. You can use SSRS to create reports on a variety of data sources. It includes a complete set of tools for creating, managing, scheduling, and delivering reports. The reports can include charts, maps, data matrixes, and more.
SSRS provides a web portal interface to manage and organize reports and other items. Internet Information Services (IIS) is not required to use SSRS.
Installation
You must download SSRS separately, either by following the stub on the main Installation Center screen or by going to https://learn.microsoft.com/sql/reporting-services/install-windows/install-reporting-services.
Completing the installation of SSRS results in the following:
Installation of the Report Server Service, which consists of the following:
Report Server Web Service
Web portal (for viewing and managing reports and report security)
Report Server Configuration Manager
Configuration of the Report Service and web portal URLs
The establishment of the service accounts needed for SSRS to operate
- You can read more about configuring SSRS in Chapter 4.
After the installation is complete, using administrative rights, browse to the following directories to verify that the installation was successful and that the service is running:
localhost/Reports
localhost/ReportServer
If you are running a named instance of SQL Server, you need to use the Web Portal URL tab in the Report Server Configuration Manager dialog box to determine the exact path of both the web service URL and the web portal URL, as illustrated in Figure 1-2.

Figure 1-2 Web Portal URL setting in Report Server Configuration Manager.
Report Server Configuration Manager
The Report Server Configuration Manager simplifies the customization of the behavior of features and capabilities offered by SSRS. You can use it to perform the following tasks and more:
Create or select existing Report Server databases.
Define the URLs used to access the Report Server and Report Manager.
Configure the Report Server service account.
Modify the connection string used by the Report Server.
Set up email distribution capability.
Integrate with a Power BI service.
SQL Server Management Studio (SSMS)
SQL Server Management Studio (SSMS) is the de facto standard SQL Server database development and management tool. It provides a rich graphical interface and simplifies the configuration, administration, and development tasks associated with managing SQL Server and Azure SQL Database environments. SSMS also contains a robust T-SQL script editor, and comes stocked with many templates, samples, and script-generating features.
Releases and versions
Since the release of SQL Server 2016, SSMS has been a freestanding toolset that you can download and install independent of the Database Engine.
Install SQL Server Management Studio
As of this writing, the latest major version of SQL Server Management Studio (SSMS) is 19.x. It can be installed alongside previous major versions of SSMS, including those bundled with earlier versions of SQL Server.
Caution
We recommend that you do not install SSMS on a computer running a production instance of SQL Server. Instead, install SSMS on a workstation and connect that to the production instance through a secure connection. Aside from reducing the temptation to use Remote Desktop to connect to a production instance, it has the added benefit of limiting the attack surface area.
To install SSMS, first download the latest version of the product here: http://aka.ms/ssms. After you download the executable file, install it. There’s not much more to it than that. The installation finishes with a Setup Completed message. In some cases, you may be prompted to restart your computer.
At this point, you can start the application by opening your Start menu and browsing to Microsoft SQL Server Tools 19 > Microsoft SQL Server Management Studio 19. For ease of access, you might want to pin the program to your Start menu or copy the icon to your desktop.
Azure Data Studio (ADS) is installed with SSMS by default. If you have ADS installed on the same computer, you can invoke ADS features, such as queries or notebooks, from inside SQL Server Management Studio.
- Read about integration between SSMS and ADS in the “Azure Data Studio” section later in this chapter.
Upgrade SQL Server Management Studio
SSMS will notify you if an update is available. You can also manually check whether one is available. To do so, select Tools > Check For Updates. The different versions of the SSMS components—the installed version and the latest available version—will display. If any updates are available, you can select the Update button to open a webpage from which you can download and install the latest recommended version.
Now that the tools used to manage SQL Server are completely independent of the Database Engine, upgrading SSMS is easy. It is also much safer to upgrade; there is no longer any concern about accidentally affecting your production environment because you upgraded your SSMS toolset.
Features of SQL Server Management Studio
The power of SSMS is in the many ways in which you can use it to interact with one or more SQL Server instances. This section highlights some useful features.
Object Explorer and Object Explorer Details
Object Explorer is the default SSMS view, providing both a hierarchical and tabular view of each instance of SQL Server and the child objects within those instances (including databases, tables, views, stored procedures, functions, and so on).
Note
Object Explorer uses its own connection to the database server, and can block certain database-level activities, just like any other SSMS query.
Object Explorer presents two panes (see Figure 1-3): the Object Explorer pane (left) and the Object Explorer Details pane (right). The Object Explorer pane is strictly hierarchical, whereas the Object Explorer Details pane is both hierarchical and tabular. As such, the latter provides additional functionality over its companion pane; for example, object search and the selection and scripting of multiple noncontiguous objects. To display the Object Explorer Details pane, choose View > Object Explorer Details or press F7.
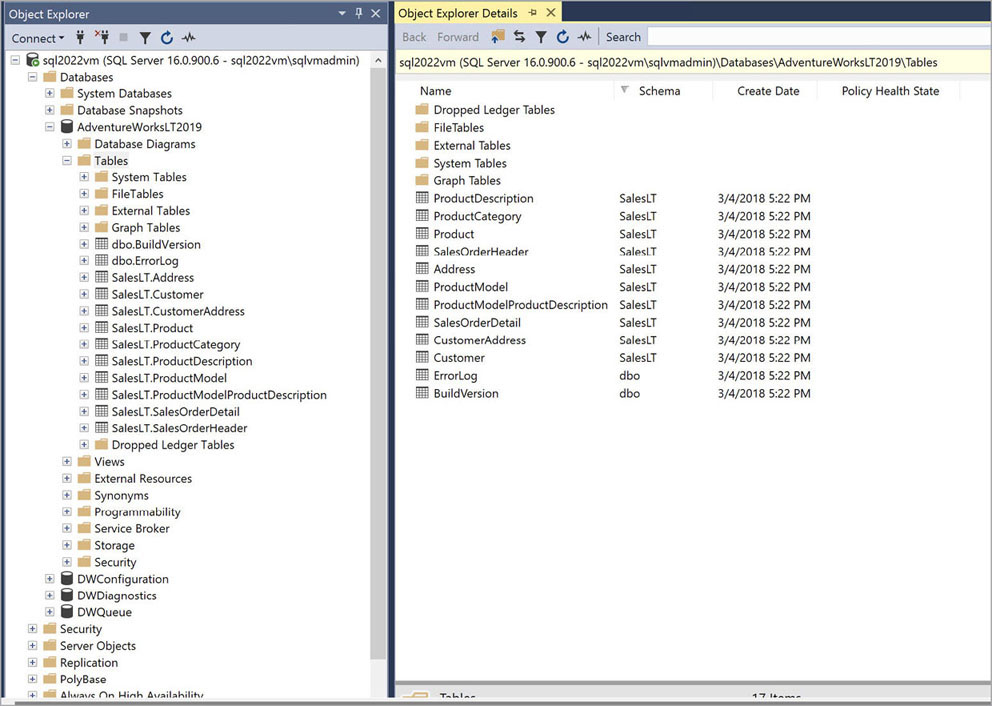
Figure 1-3 The Object Explorer view in SQL Server Management Studio.
Server Registration
The Server Registration feature within SSMS can both save time and make it easier to manage a complex environment by saving a list of commonly accessed instances. Registering connections in advance for future reuse provides the following benefits:
Preservation of connection information
Creation of groups of servers
Aliasing of servers with more meaningful names
Ability to add detailed descriptions to both servers and server groups
Import and export of registered server groups for sharing between machines or teammates
To access the Server Registration feature within SSMS, select View > Registered Servers or press Ctrl+Alt+G.
You can use SSMS to register and manage four different types of servers and services:
Database Engine
Analysis Services
Reporting Services
Integration Services
Note
Server Registration for SQL Server Integration Services is included only for backward compatibility for versions prior to SQL Server 2012.
Database Engine
When you use the Server Registration feature to work with Database Engines, two nodes appear: Local Server Groups and Central Management Servers. Each of these has some very useful features.
Local Server Groups node
The Local Server Groups node allows for the addition of either freestanding individual server registrations or the creation of server groups. Think of server groups as folders within the Local Server Groups node. Each of these folders can contain one or more individual servers. Figure 1-4 shows one of the many ways in which you can use the Local Server Groups feature to organize and save frequently used Database Engine connections.
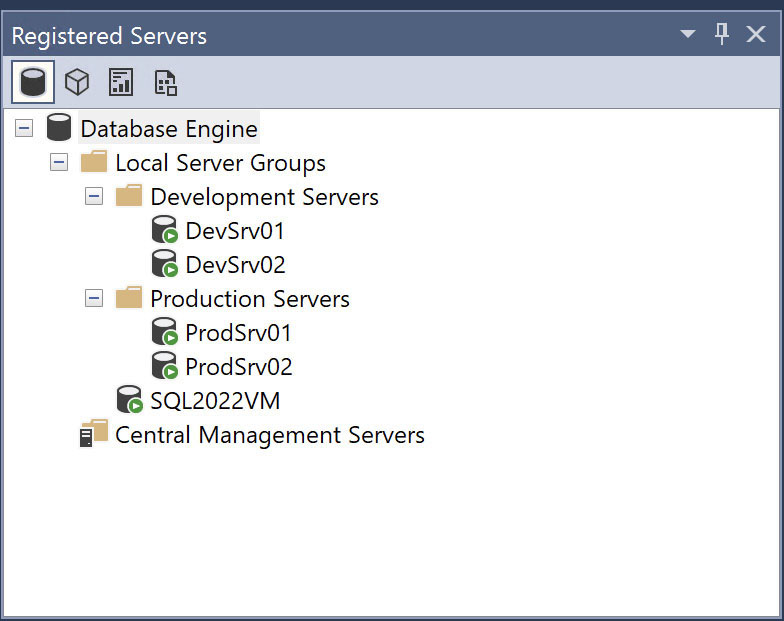
Figure 1-4 Local Server Groups.
From the Local Server Groups node, you can access the following tools:
Export Registered Server Wizard. To access the Export Registered Servers Wizard, right-click the Local Server Groups folder node or any folder or server nested within this node. Then, on the shortcut menu, select Tasks > Export. From there, you have quite a bit of freedom. You can choose to export from any level within the tree structure as well as whether to include usernames and passwords. In the preceding case, if you want to export only the Development Servers node and any servers within it, you can do so by choosing within this wizard where to save the created file and then build out an XML document with the extension .regsrvr.
Importing Registered Servers. To access the Import Registered Servers Wizard, right-click the Local Server Groups folder node or any folder or server nested within this node. Then, on the shortcut menu, select Tasks > Import. This opens the Import Registered Servers dialog box, which you can use to select a previously created .regsrvr file, as demonstrated in Figure 1-5.
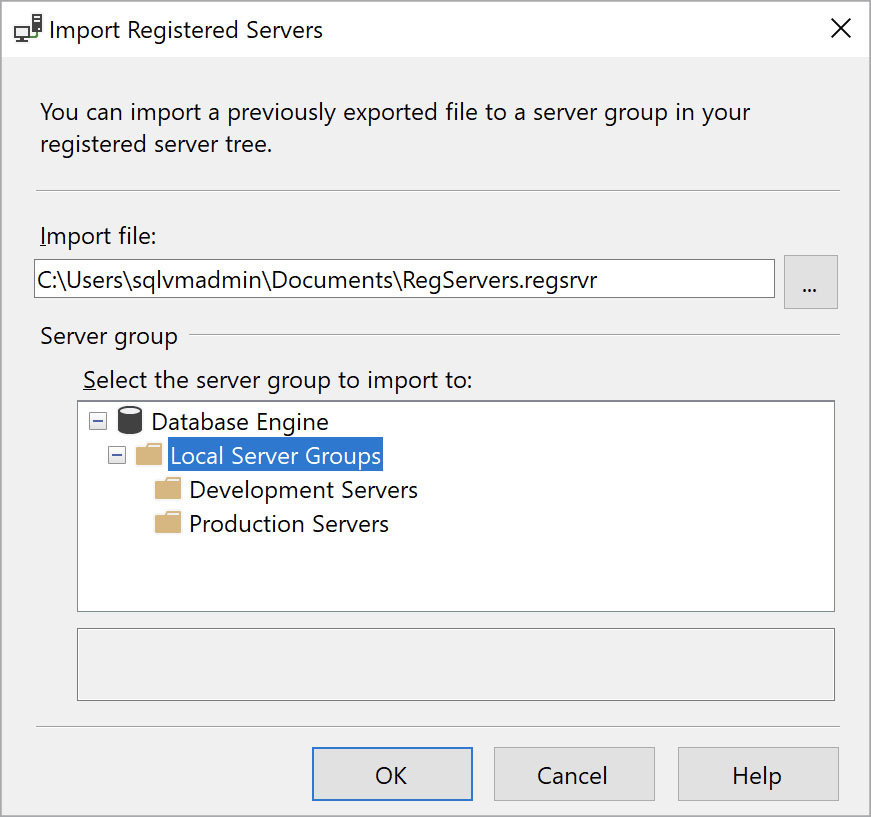
Figure 1-5 Importing registered servers.
From here you can choose the folder in which you would like the imported object or object tree to reside. If you select a folder that already contains the same structures you are attempting to import, a message will appear asking you to approve an update/overwrite to the existing object structure.
Central Management Servers node
As mentioned, the second node available in the Database Engine feature is Central Management Servers. At first glance, this might appear to be almost the same thing as the Local Server Groups node. It allows you to add servers and create folders with descriptive names to which you can add servers. However, the Centralize Management Servers node includes some very significant differences.
First, when using this feature, you must choose a SQL Server instance to play the role of a Central Management Server (CMS). You can alias the server with a new name, but the server itself must exist. After you have chosen a server to play this role and have created a CMS, you can create new server groups or individual server registrations using the same methods explained in the “Local Server Groups node” section.
Here is where things become interesting. If you right-click any level (a server, a group, or the CMS itself), you are presented with multiple options:
New Query
Object Explorer
Evaluate Policies
Import Policies
Anything that is run will be run against each of the servers in the chosen group’s tree. Running a query on the CMS itself will result in the query being run on every server hierarchically present in all trees within the CMS. This is a very handy feature, but of course, with great power comes great responsibility!
The default behavior of CMS is that multiple server results are merged into one result set. You can change and customize this behavior by choosing Tools > Options > Query Results > SQL Server > Multiserver Results and enabling the Merge Results setting. Other behavior options available here include Add Login Name and Add Server Name to the result set from a CMS query.
When you create a CMS on an existing SQL Server, others can access and use the structure setup, so there is no need to export or import to keep folders and structures synchronized. This is great for team collaboration and efficiency.
Filtering objects
In the default Object Explorer view, SSMS lists items within each category in alphabetical order, starting with the schema name. There are several main groups, or tree categories, that are common across all versions of SQL Server. These include the following:
Databases. This provides a full list of databases (including system databases) on the SQL Server instance. Database snapshots also appear here.
Security. This contains a diverse list of object types, including logins, server roles, credentials, cryptographic providers, and audits.
Server Objects. These include backup devices, endpoints, linked servers, and server-level triggers.
Replication. This provides information about publishers and subscriptions.
Always On High Availability. This includes Failover Clustering and Availability Groups.
Management. This category covers diverse features and tools, including Policy Management, Data Collection, Resource Governor, Extended Events, Maintenance Plans, Database Mail, DTC (Distributed Transaction Coordinator), and SQL Server error logs.
SQL Server Agent. Includes jobs, alerts, operators, proxies, and error logs of its own.
Integration Services Catalogs. This contains the SQL Server Integration Services package catalog, depending on the SQL Server version.
By default, SSMS lists all objects alphabetically beneath each tree category. When working with databases that have a large quantity of objects, this can become quite aggravating, as the user may be subject to long list load times and must expend energy scrolling and watching the screen very closely for the object in question.
Fortunately, SSMS has a filtering feature. You can apply filters to many object categories, such as user databases, tables, views, stored procedures, table-valued functions, user-defined functions, and even database users.
You can independently configure filter settings in either the Object Explorer pane or the Object Explorer Details pane. The available filters change based on the type of item selected (databases, tables, stored procedures, etc.). Table 1-1 lists the available filtering options for tables.
Table 1-1 SQL Server Management Studio filters and options
Filter | Options |
|---|---|
Name | Contains Equals Does Not Contain |
Schema | Contains Equals Does Not Contain |
Owner | Equals Does Not Equal |
Durability Type | Equals Does Not Equal |
Is Memory Optimized | Equals |
Creation Date | Equals Less Than Less Than or Equal More Than More Than or Equal Between Not Between |
After you have selected a filter, the suffix (filtered) appears in the Object Explorer or Object Explorer Details tree above your filtered list.
To clear an applied filter and display all objects in a tree again, right-click a filtered category and choose Filter > Remove Filter.
Multi-Select
In the Object Explorer pane, you can select only one object at a time. The Object Explorer Details pane, however, provides a multi-select feature that enables you to work on multiple objects (tables, views, jobs, and so on) at the same time.
Following the standard in the Windows environment, the Shift key allows for the selection of contiguous objects, whereas the Ctrl key allows for the selection of objects one by one. You can initiate actions on multiple objects using the GUI or you can choose to script multiple objects at once. Scripting each object into its own file or merging all object scripting into one larger file are both available options. Merging object scripting is helpful for both creating and deleting multiple objects at once.
Additional tools in SQL Server Management Studio
SSMS provides time-saving tools and techniques to make you more productive. This section provides just a few highlights.
IntelliSense tools
IntelliSense is a ubiquitous Microsoft technology found in many of its products to help with code completion. IntelliSense effectively reduces the amount of typing you do by offering shortcuts and autocompleting keywords and object names. This also makes your code more accurate.
Additionally, SSMS comes with snippets to help you code more easily. Snippets are preconfigured code fragments that you can quickly drop into (using the Insert Snippet command) or around (using the Surround With command) an existing block of code. You also can create your own snippets—you build them using XML—but that is beyond the scope of this discussion.
Note
You can manage code snippets from the Tools menu, via the Code Snippets Manager option.
Let’s look at some use cases for snippets.
One of the options in SQL Server 2012 and later versions is to include a snippet for an IF statement. After testing a block of code, you can quickly add the IF statement (including the BEGIN/END statements) by highlighting your code and choosing a snippet.
There are three ways to access snippets:
Use a keyboard shortcut, such as Ctrl+K followed by Ctrl+S (Surround With), and Ctrl+K followed by Ctrl+X (Insert Snippets).
Right-click and choose an option from the context menu that opens.
Choose Edit > IntelliSense and select a snippets option—for example, Surround With. (See Figure 1-6.)
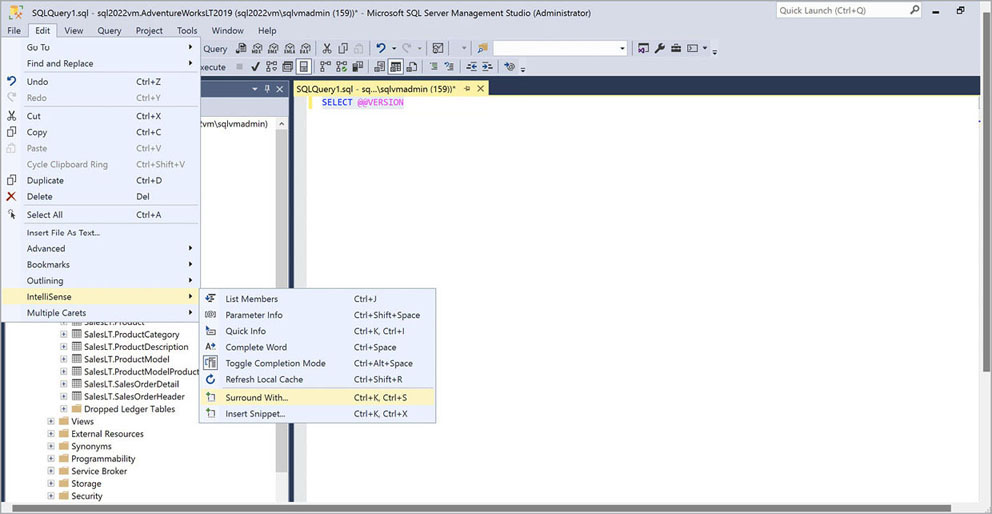
Figure 1-6 Accessing the Surround With snippet from the Edit menu.
When you choose Surround With, a snippet surrounds the highlighted code with the snippet template code. You can even insert “placeholder” text for replacing later.
There are only a few stock Surround With snippet options, but there are many Insert Snippet options. You can find these by choosing Edit > IntelliSense > Insert Snippet. You can also double-click the Function folder to see the available snippets and use them the same way you do the Surround With snippets (except that the code is placed at the current location of the cursor within a block of code rather than around selected code).
Guided upgrades using the Query Tuning Assistant
SSMS 18.0 introduced the Query Tuning Assistant (QTA), which works with the Query Store to help guide SQL Server upgrades from SQL Server 2016 and SQL Server 2017 to SQL Server 2019 and above. Note that the QTA does not support Azure SQL Database, Azure SQL Managed Instance, or Azure SQL Analytics.
- The QTA is covered in more detail in Chapter 14, “Performance tune SQL Server.” You can also read the official documentation at https://learn.microsoft.com/sql/relational-databases/performance/upgrade-dbcompat-using-qta.
Customize menus and shortcuts
SSMS is based on the Visual Studio integrated development environment (IDE), which means that it is customizable and extensible. Adding extensions is beyond the scope of this book, but the next few sections describe how to customize elements such as the toolbars and keyboard shortcuts.
Customize toolbars
By default, SSMS displays only the standard toolbar at the top. However, there are many other toolbars available for use. To access these options, on the toolbar, select Tools > Customize. This opens the Customize dialog box, which has two tabs:
Toolbars. On this tab, you can select the toolbars that are useful in your work environment. Among the many choices are toolbars for working with database diagrams, Extended Events, and XML.
S. You can use this tab to set up a custom toolbar or to edit the drop-down menus and functionality of an existing toolbar.
Tool options
You also can customize the appearance of your SSMS interface. Select Tools > Options to adjust the color, font, keyboard hotkeys, length of strings in results, location of results, scripting preferences, international settings, theme, autorecovery timeframe, and more.
One very handy option in the Options dialog box is Keyboard > Query Shortcuts. SSMS comes with several shortcuts already turned on (see Figure 1-7), but you can use this setting to tailor them to your needs. Many long-time DBAs make heavy use of this setting to reduce the number of keystrokes required to carry out common procedures.
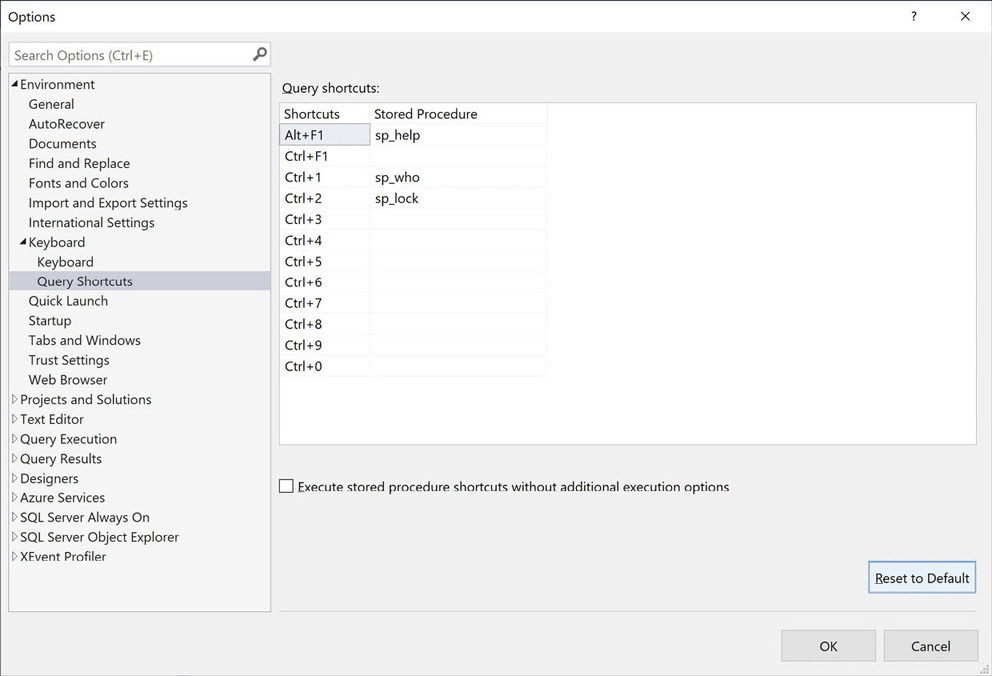
Figure 1-7 Managing query shortcuts.
Using shortcuts in SSMS, you can highlight text and then activate the keyboard shortcut to run the associated stored procedure, supplying a parameter of the highlighted text. For instance, to see the name, created date, and a list of columns and associated data types in a view, you can use the sp_help system procedure. As you can see in Figure 1-7, this procedure is called by the keyboard shortcut Alt+F1. This shortcut is not modifiable, but several others are.
If you populate a query window with the name of a view, and then use the keyboard shortcut Alt+F1, you will see results like the ones shown in Figure 1-8.
![A screenshot showing an SSMS query window open with the name of a view, [dbo].[vAssocSeqOrders], highlighted. The Alt+F1 keyboard shortcut has been used to call sp_help. The results pane shows 4 result sets. The first shows the name, owner, type, and created_datetime for the selected view. The second result set shows information about the columns in the view. The third result set shows that there are no identity columns in the view. The fourth result set shows that there are no rowguid columns in the view.](https://imgdetail.ebookreading.net/2023/10/9780137899845/9780137899845__9780137899845__files__graphics__01xx08.jpg)
Figure 1-8 Using query shortcuts in SSMS.
Error logs
Each SQL Server instance maintains a distinct set of relevant SQL Server Error Log messages that are accessible in two places:
The Management > Error Logs node
The context menu that appears when you right-click an instance in the Registered Servers window
These log files contain information about the SQL Server instance when coming online, what configuration settings were applied (or failed to execute), when backups occurred, when corruption is detected, when I/O is taking too long, partial stack dumps, and lots of other useful data. It’s a great place to go to when troubleshooting stability or performance problems and to look for things that might cause trouble in the future.
To keep the log information to a reasonable and searchable size, the information is kept in a series of files rather than in one single file. It is possible to close one file and start a new, blank file. Unfortunately, however, the default settings for cycling the log are not very useful.
Note
It is not currently possible to change the number of error log files in SQL Server on Linux.
By default, SQL Server keeps the six most-recent error log files. To configure the number of log files to maintain, follow these steps:
Open the Management folder in the SSMS Object Explorer.
Right-click SQL Server Logs and select Configure.
In the dialog box that opens, select the Limit The Number Of Error Log Files Before They Are Recycled check box.
In the Maximum Number Of Error Log Files box, type a value. This value must be between 6 and 99.
Select OK to continue.
- For more about this and other post-installation checklist items, see Chapter 4.
Every time the SQL Server service is restarted, it cycles the log file. This creates a brand-new, empty log file and moves the previous log file down one spot in the list. Any log file older in sequence than the maximum specified number of files to keep is deleted.
You also can choose to manually cycle the log file by using the sp_cycle_errorlog command. Or you can automate this process by using a SQL Server Agent job. When working with SQL Server instances that are quite large and remain online for a long time, this can prevent any single log file from becoming overly large and unwieldy.
No matter which method you use, the resulting action is the same: The current file is closed, and a new, blank file is opened. If this causes the file count to exceed the maximum number of files, the oldest file is deleted.
Activity Monitor
Activity Monitor provides information about what is currently running on the SQL Server and how that code might be affecting the instance. It lets you easily view common hardware-specific performance metrics and a list of recently used queries (with metrics, code, and execution plans). You can sort all the grids, and even filter some of them. Out of the box, this is the place to begin if you need to do rudimentary troubleshooting and baselining.
To open the Activity Monitor window, right-click the SQL Server instance in the Object Explorer pane and select Activity Monitor from the context menu that appears.
The Activity Monitor window consists of six distinct parts:
Overview. This displays a basic version of what you might already be familiar with viewing in the Task Manager window, but with a SQL Server flair in the form of four distinct graphs (discussed in the next section).
Processes. By default, this displays all non-system processes with open connections to the SQL Server instance. However, you can also select a process and right-click to view the associated SQL script or live execution plan, among other options.
Resource Waits. This displays the wait events of active, open connections.
Data File I/O. This displays the difference between two interval readings of the storage subsystem.
Recent Expensive Queries. This displays information about the most expensive queries from the past 30 seconds.
Active Expensive Queries. This displays a more detailed view of the most expensive queries running at that moment, based on the column you have selected to sort on.
You can expand each of these parts to show more information, with the Overview section expanded by default. If you want to sort or filter the results, select the column header of any of the columns in each section.
The next several sections discuss these Activity Monitor Window components in more detail.
Overview
Four graphs in the Overview relay the most basic overview of the instance. The % Processor Time graph is an average combined value for all logical processors assigned to the instance (see the section “Allocate CPU cores with an affinity mask” in Chapter 3, “Design and implement an on-premises database infrastructure”). The other three graphs are Waiting Tasks (an instance-level value), Database I/O (all databases, measured in MB/sec) and Batch Requests/sec (all databases).
Each graph displays information in near-real time, refreshing every 10 seconds by default. You can configure the refresh interval by right-clicking any of the graphs and choosing an option from the context menu that appears. The refresh interval can be as short as 1 second to as long as 1 hour. The graph settings are adjusted as a unified set; all four graphs use the same interval setting, so changing one interval changes them all. Likewise, selecting Pause on any of the graphs pauses the entire set.
Processes
The Processes section of Activity Monitor displays all non-system processes (also known as tasks) with open connections to the SQL Server instance, regardless of whether the process is actively running a query. It provides the following types of important metadata:
Session ID. The session process identifier (SPID) of the current process
User Process. Displays a 1 if this is a user process and a 0 if it is a system process (this list is filtered to show only user processes by default)
Login. The login name of the user running this process
Database. The name of the database
Task State. Populated from the list of possible tasks in the
task_statecolumn of thesys.dm_os_tasksdynamic management viewCommand. Populated from the list of command types in the
commandcolumn of thesys.dm_exec_requestsdynamic management viewApplication. The name of the application
Wait Time (ms). The amount of time this task has been waiting, in milliseconds
Wait Type. The current wait type for this task
Wait Resource. The resource for which this task is waiting
Blocked By. If this task is being blocked by another process, this shows the SPID of the blocking process
Head Blocker. If there is a chain of blocking processes, this is the SPID of the process at the start of the blocking chain
Memory Use (KB). How much memory this process is using
Host Name. The host name of the machine that made this connection
Workload Group. The name of the Resource Governor workload group that this process belongs to (you can read more about the Resource Governor in Chapter 3)
Each column allows you to filter to specific values. For example, right-click any row in the Processes pane to see the detailed T-SQL query being run (last T-SQL command batch), trace the process in SQL Profiler, or kill the process.
Resource Waits
The Resource Waits section of the Activity Monitor displays the wait events of active, open connections, sorted by default by the cumulative wait time (in seconds).
This can be very useful when you’re trying to determine the root cause of a performance issue. Having a baseline for these counters when things are good is very useful later, when you’re trying to gauge whether a problem you’re experiencing is new or normal.
Understanding the meaning of certain wait times can help you diagnose the root cause of slowness, be it storage, memory pressure, CPU, network latency, or a client struggling to receive and display a result set. Following are the wait statistics provided by this section:
Wait Category
Wait Time (ms/sec)
Recent Wait Time (ms/sec)
Average Waiter Count
Cumulative Wait Time (sec)
- You can read more about Resource Waits at https://learn.microsoft.com/sql/relational-databases/system-dynamic-management-views/sys-dm-os-wait-stats-transact-sql or by referring to the “Understand wait types and wait statistics” section in Chapter 8.
Data File I/O
The Data File I/O section of the Activity Monitor displays the difference between two readings taken from the metadata stored in the sys.dm_io_virtual_file_stats dynamic management view. For this reason, when you first expand this section, you might not see results for a short while. The server needs at least two readings, so, for example, if your interval is 10 seconds, you’ll wait 10 seconds before data appears.
The information displayed shows each of the data files for all of the databases on the SQL Server, the file location and name, megabytes per second read (MB/sec read), megabytes per second written (MB/sec written), and average response time in milliseconds (ms).
Generally, average response times of 5 milliseconds or less allow for acceptable performance, the occasional outlying peak notwithstanding.
Recent Expensive Queries
The Activity Monitor’s Recent Expensive Queries section displays information about the most expensive queries that have run on the SQL Server instance in the past 30 seconds. It includes both queries in flight and queries that have finished.
To see the full query text or the execution plan currently in use, right-click any of the queries listed. Here are the fields returned in this pane:
Query
Executions/min
CPU (ms/sec)
Physical Reads/sec
Logical Writes/sec
Logical Reads/sec
Average Duration (ms)
Plan Count
Database
Active Expensive Queries
If you’re trying to determine what is running at this precise moment that might be causing performance issues, the Active Expensive Queries part of the Activity Monitor is the place to look. It is more granular than the aggregated “past 30 seconds” view provided in the Recent Expensive Queries section. In addition, the list of queries in this part shows some very interesting details that are available at only a granular level:
Session ID
Database
Elapsed Time
Row Count
Memory Allocated
Again, you can see the full query text and the execution plan by right-clicking, but here you get an additional feature: Show Live Execution Plan. This might differ if a query is running long.
SQL Server Agent
SQL Server Agent is a service on both Windows and Linux that you can use to schedule automated tasks, called jobs, as illustrated in Figure 1-9. These jobs mostly run routine maintenance (backups, index defragmentation, statistics updates, and integrity checks), but you can also use them to periodically run custom code.
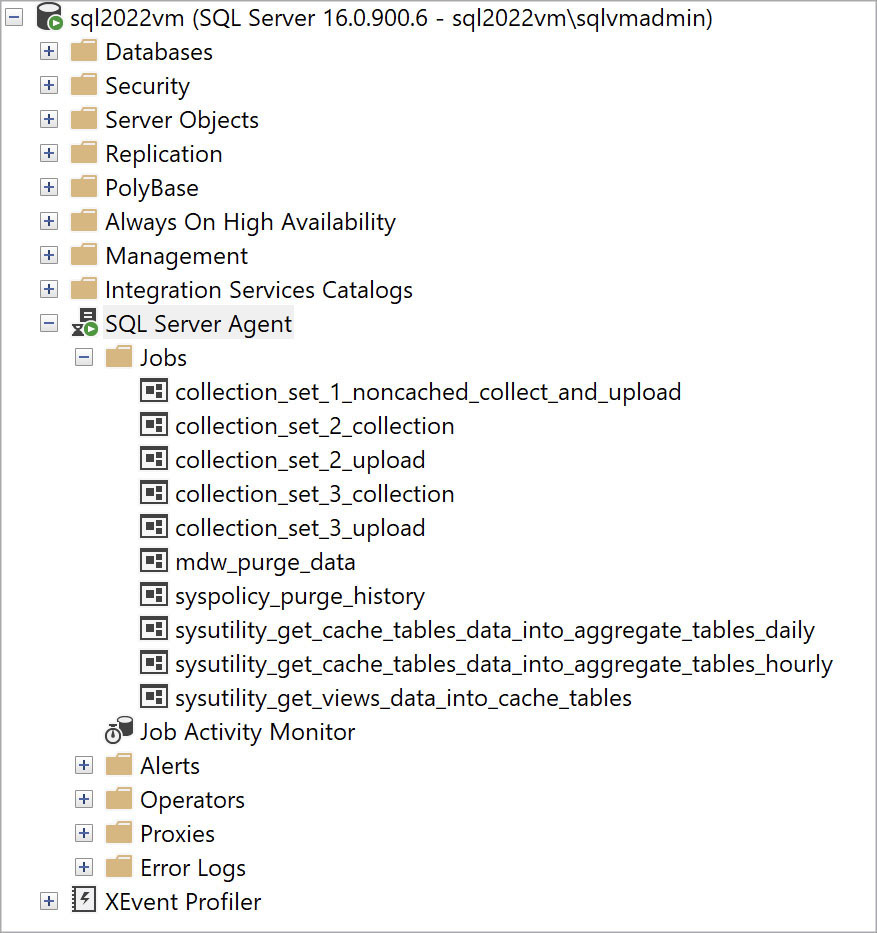
Figure 1-9 The SQL Server Agent tree view.
Note
You can filter SQL Server Agent nodes. This was described earlier in this chapter in the section “Filtering objects” in the discussion of Object Explorer.
Windows Server has built-in functionality for job notifications to email the status of a job to a person or group using the Database Mail feature. The setup provides a few straightforward configuration options that apply to notifications that are sent: Success, Failure, and Completion.
- For more information on configuring Database Mail, and on configuring SQL Agent to use Database Mail, see Chapter 9, “Automate SQL Server administration.”
Job Activity Monitor
Job Activity Monitor provides a snapshot view of all jobs on a server. Using this feature, you can quickly see many attributes of the jobs scheduled on a SQL Server instance, and you can use many of these attributes to narrow the list of jobs displayed. Table 1-2 lists the attributes.
Table 1-2 Job activity attributes
Job activity attribute | Values | Can use to filter? |
|---|---|---|
Name |
| X |
Enabled | No Yes | X |
Status | Between Retries Executing | X |
Last Run Outcome | Idle Not Idle Performing Completed Action Suspended Waiting for Step to Finish Waiting for Worker Thread | X |
Last Run |
| X |
Next Run |
| X |
Category |
| X |
Runnable | Yes No | X |
Scheduled | Yes No | X |
Category ID |
|
|
Notify operators with alerts
You can configure alerts to notify you when a specific event occurs. Unlike jobs that run on a schedule, alert notifications can be sent in reaction to a scenario that has been set off. Examples include emailing the DBA team when a data or log file experiences auto growth, or when Target Server Memory drops below a certain threshold on a virtual machine.
SQL Server Agent’s alerting feature gives administrators the ability to create three different types of alerts:
Event alerts. These are raised by SQL Server’s Error and Severity mechanism. You can specify this for all databases or for a single database. You can use an error number or a severity level to set off an alert. Text within the system message can be parsed to only alert in specific scenarios.
Performance condition alerts. These alerts use the entire library of SQL Server Performance Monitor counters. Any counter object can be chosen, the sub counter object specified, the counter instance noted (if applicable), and a threshold (falls below, becomes equal to, or rises above) provided at which an alert should fire. Figure 1-10 shows the configuration of a performance condition alert definition to notify an administrator if the Page Life Expectancy metric on a SQL Server instance drops below 5 minutes.
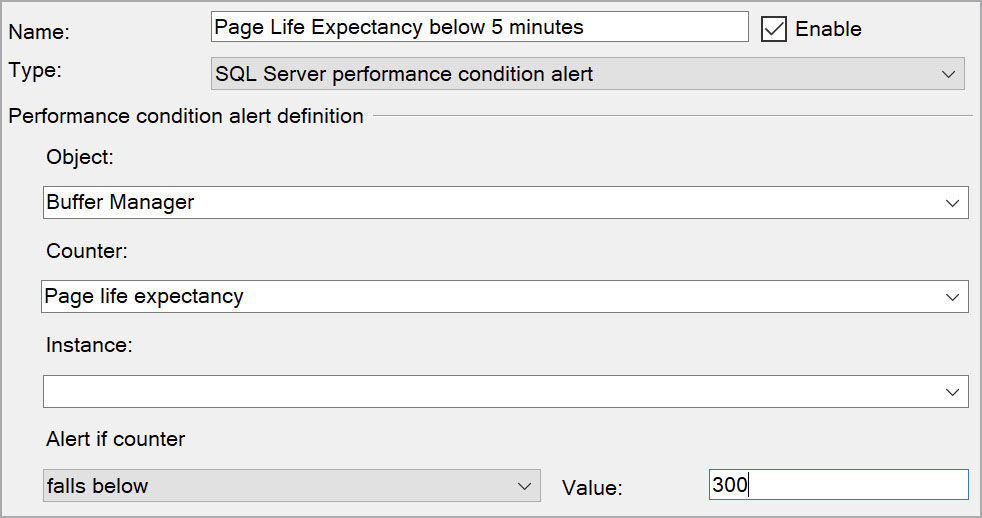
Figure 1-10 Creating a performance condition alert.
Windows Management Instrumentation (WMI) alerts. A WMI alert uses the Windows Management Instrumentation Event Provider to allow for more complicated actions upon the detection of an event that sets off an alert. One example is to use the alerting system to detect a deadlock and then save the XML deadlock graph information to a table for later analysis. Another is to detect any DDL or system configuration changes that occur and to document them for later review. Because the WMI Provider has access to many server event classes and properties, this feature is quite versatile. It does come with several catches, however:
It requires Service Broker to be enabled in the
msdbdatabase of the instance.If your code queries objects within a particular database on the server, Service Broker must be enabled on that database also.
It is not very GUI-friendly and requires a bit more programming know-how than the other alert options.
It is not supported on SQL Server on Linux or Docker containers.
- You can read more about creating WMI alerts in Chapter 8, as well as at https://learn.microsoft.com/sql/ssms/agent/create-a-wmi-event-alert.
A response to an alert can be to run a job, notify a list of operators, or both.
Operators
Operators are users or groups designated as points of contact to receive notifications from the SQL Server Agent. They are most commonly defined with email addresses, but there are additional delivery methods available.
Azure Data Studio
Azure Data Studio (ADS) is an exciting addition to the administration and development toolkit for the database platform, including SQL Server, Azure SQL Database, Azure Synapse Analytics (formerly Azure SQL Data Warehouse), and PostgreSQL.
Think of ADS as more of a developer-focused tool compared to SSMS. While ADS performs many of the same tasks as SSMS, it is more focused on development than administration, and can run cross-platform on Windows, macOS, and Linux.
Often, but not always, when ADS is missing native features required for database administration, there is an extension built by Microsoft or by a partner that fills that need.
While ADS is installed along with SSMS by default, you can install it separately. If a version you have installed is newer than the version being installed/upgraded with SSMS, the newer version will not be overwritten.
- You can download the latest version of Azure Data Studio from https://aka.ms/azuredatastudio.
User interface
Azure Data Studio is based on the same shell as Visual Studio Code. Thus, it shares a similar development environment and is fully extensible. In other words, you can easily install third-party plugins and extensions to improve your workflow, or even write your own and contribute them to the main product codebase. Many of the extensions for Visual Studio Code will run on Azure Data Studio.
The main interface for Azure Data Studio is made up of viewlets and tiles, similar in concept to the docked windows in SSMS. These elements present information to monitor and administer your database environment. (See Figure 1-11.)
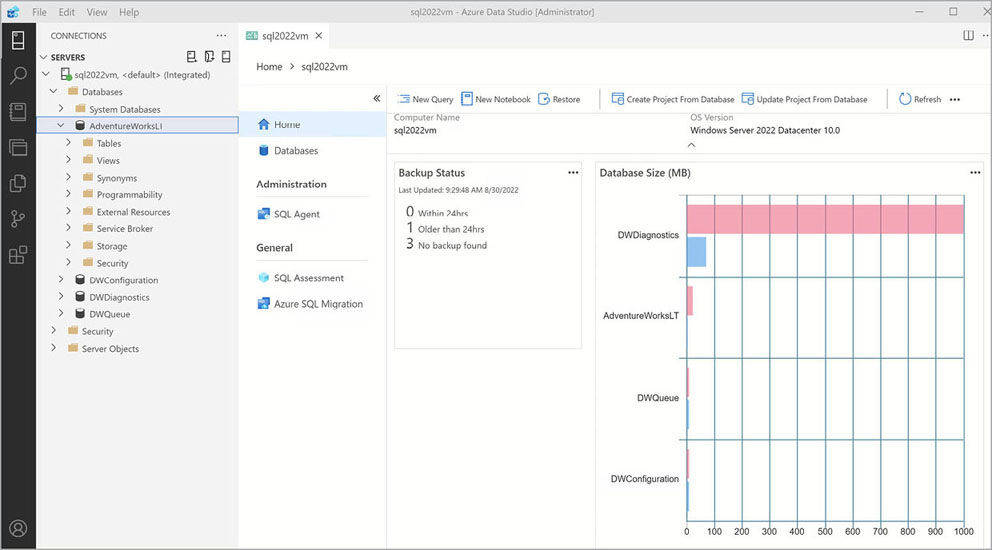
Figure 1-11 The Azure Data Studio user interface.
The Interface is fully customizable, with a dashboard that shows:
Insights, performance metrics, and telemetry
Recent connections
An Object Explorer (like SSMS; see Figure 1-12)
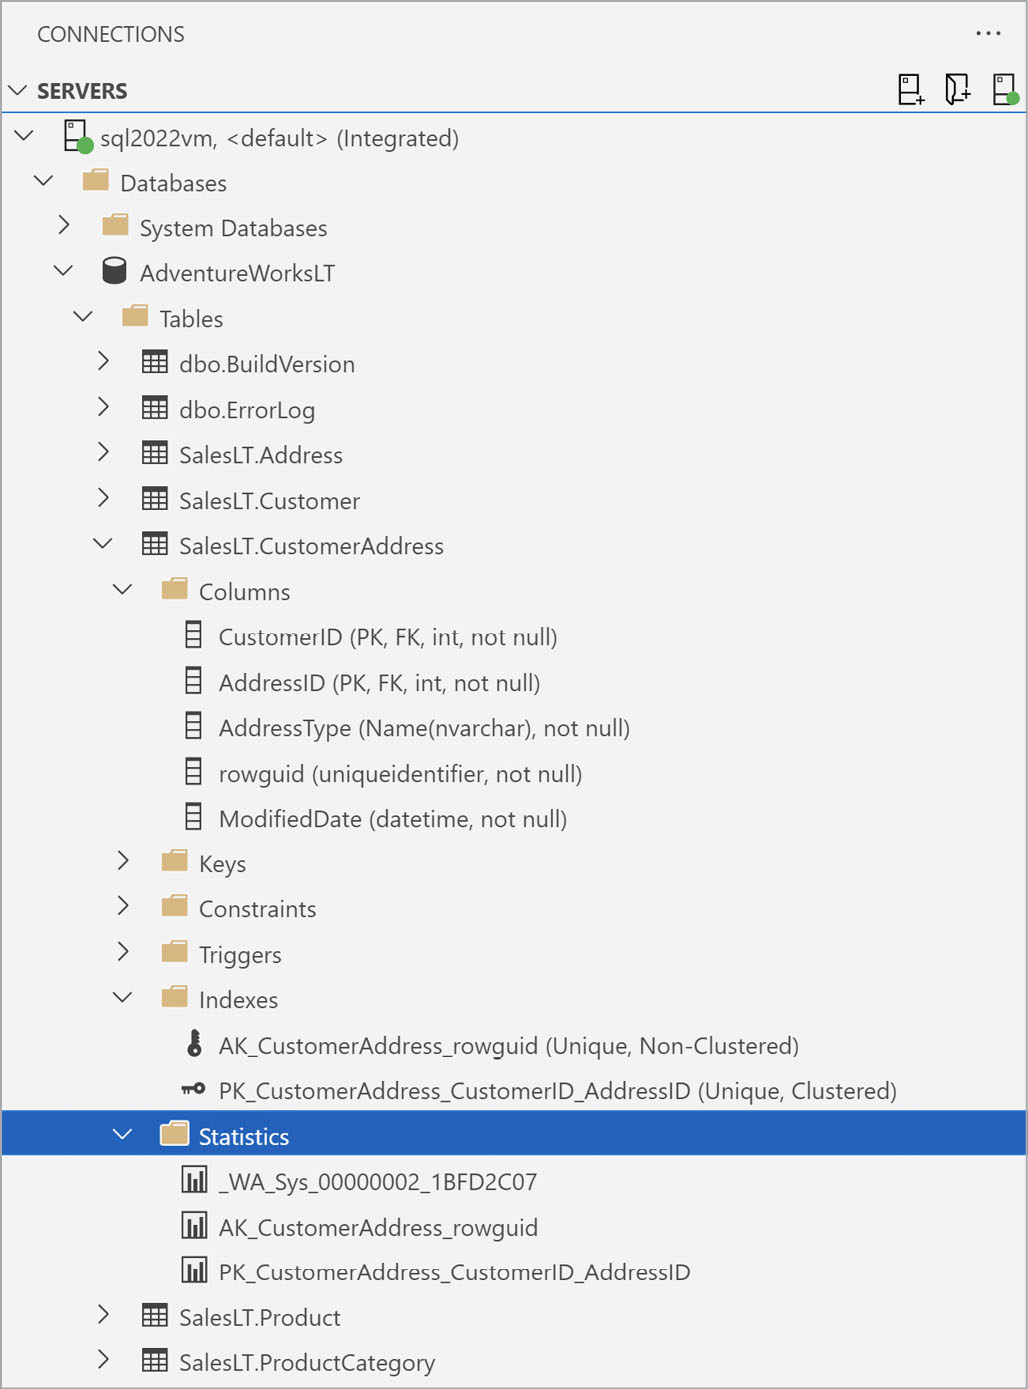
Figure 1-12 The Object Explorer view in Azure Data Studio.
A query window for code
A results grid that can be exported to CSV, Excel, JSON, and XML
Note
Whereas SSMS uses dialog boxes that pop up in the center of the application interface, the Azure Data Studio dialog boxes, or flyouts, appear from the right of the user interface until the necessary action is performed. This takes some getting used to for people who are more familiar with the SSMS interface.
Highlighted features in Azure Data Studio
Azure Data Studio includes many of the same core features for administering and developing on a SQL Server that you would expect to find in SSMS. These include:
Managing registered servers
Viewing server and database reports
Writing queries
Managing security
Generating scripts
Viewing and analyzing query plans
Performing tasks such as database consistency checks
Maintaining indexes and statistics
Running backups and restores
Certain dialog boxes in SSMS can be run from inside Azure Data Studio (and vice versa), as long as the latest versions of both applications are installed on the same Windows computer. This allows an integrated experience through the seamless use of different features across both applications from within the tool of your choice.
For example, you can select a database, right-click, and choose Generate Scripts to open the familiar Generate Scripts wizard from SSMS. (See Figure 1-13 and Figure 1-14.)
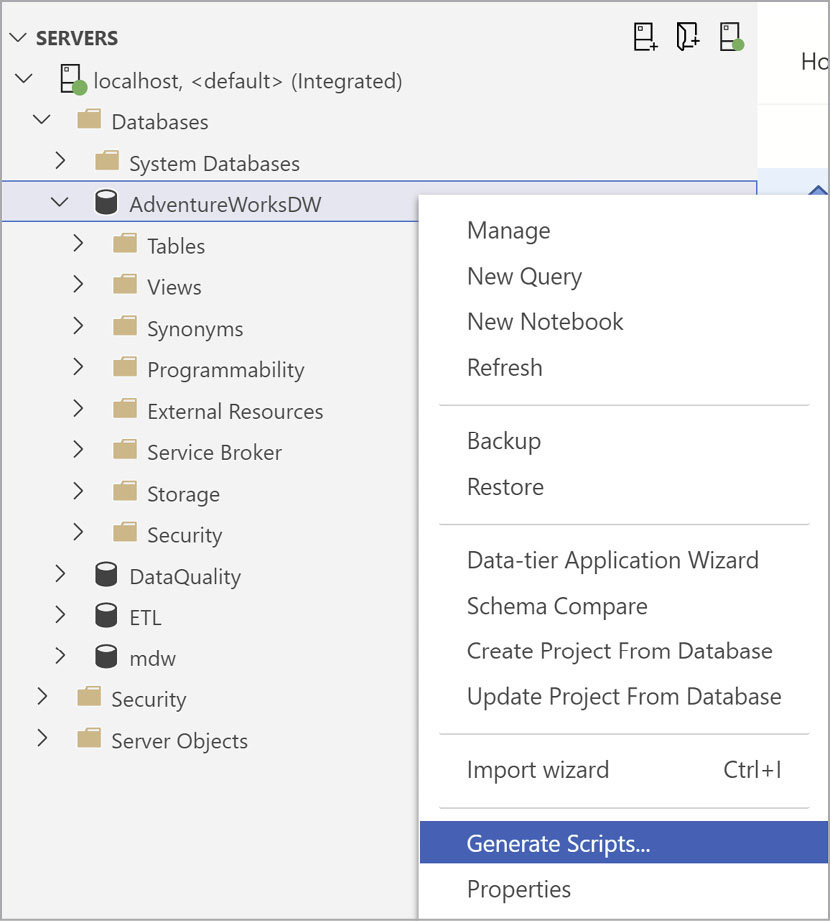
Figure 1-13 The Generate Scripts option for a database in Azure Data Studio.

Figure 1-14 The SSMS Generate Scripts wizard, opened from ADS.
Since the release of SQL Server 2019, many significant features have been added to Azure Data Studio. For example:
Support for Always Encrypted and Always Encrypted with secure enclaves was added.
The SQL Assessment API extension was published.
The SQL Database Projects extension was published with schema compare functionality.
The SQL Server Import extension became generally available.
Support was added for KQL in notebooks.
The Table Designer UI was added.
The Query Plan Viewer was added.
The Azure Arc extension was updated.
The Azure SQL Migration extension became generally available.
Object Explorer was updated to add support for SQL ledger objects.
Extend the features of Azure Data Studio
Azure Data Studio allows for additional features that are not part of the base product, directly from the interface, on the Extensions pane. To access the Extensions pane, select View > Extensions, or press Shift+Ctrl+X (Windows and Linux) or Shift+Cmd+X (macOS).
Extensions recommended by Microsoft are identified by a white star on a blue background at the top left of the extension item. (See Figure 1-15.)

Figure 1-15 The Extensions Marketplace.
To install an extension, select its Install button. When the extension is installed, you may be prompted to reload the application; select the Reload button, and Azure Data Studio will reopen with the extension enabled.
Note
Some extensions may need to be installed manually. You do this by choosing File > Install Extension from VSIX Package. Take care when trusting third-party extensions installed in this manner.
Access the command line
One extremely useful feature in Azure Data Studio (and Visual Studio Code) is the built-in command line interface. This terminal allows you to interact with the underlying OS from within the application using familiar terminal types like PowerShell or the command prompt, or other terminal types like Git Bash. This improves productivity because you don’t need to switch away from the Azure Data Studio interface to manipulate files or execute external scripts.
To access the terminal, choose View > Terminal or use Ctrl+` (backtick) on Windows and Linux or Cmd+` on macOS.
Notebooks in Azure Data Studio
One of the fundamental ways in which Azure Data Studio is helpful to data professionals is through its support of notebooks, based on Project Jupyter (pronounced Jupiter).
Notebooks already support many languages, including R, Python, and PowerShell, which makes them a natural addition to the data scientist’s toolkit. But their use has expanded to data analysts and big data developers as well.
Notebooks as runbooks
One particularly interesting feature for data professionals is SQL kernel support. This enables you to create powerful interactive and shareable notebooks with SQL Server and PostgreSQL as supported environments.
In this book, we refer to these notebooks as SQL notebooks. As of version 1.16.0 (released in March 2020), SQL notebooks support creating and saving charts.
The structure of SQL notebooks makes them an ideal format for runbooks. A runbook is a set of standardized written procedures for completing repetitive tasks. SQL notebooks allow you to mix cells containing text explanations for steps in a task with the cells containing SQL to be run to execute a task. The results of an executed SQL script can be saved in the notebook as well. This is helpful for showing expected results of a task.
Using the Markdown language, you can convert existing scripts and documentation into SQL notebooks. Because these documents are plain text files that render as web pages, they can be treated like source code and checked into a source control system. This gives you a lot more control over versioning, especially around runbooks.
- See Chapter 10, “Develop, deploy, and manage data recovery,” for a practical use case for runbooks.
SQL Server Data Tools
SQL Server Data Tools (SSDT) provides developers with a set of tools for working with SQL Server, as well as SQL Server Integration Services (SSIS), Reporting Services (SSRS), and Analysis Services (SSAS).
SQL Server Data Tools is a built-in workload within Visual Studio 2022 or later. In contrast, the SSIS, SSRS, and SSAS project templates must be downloaded from within Visual Studio using Extension Manager. You will need to use the built-in workload to work with database projects.
Note
Despite having similar names, Visual Studio is an entirely different product from Visual Studio Code. SSDT is not supported in Visual Studio Code.
SQL Server Integration Services
SQL Server Integration Services (SSIS) is a versatile platform for importing, transforming, and exporting data. Frequently used for extract, transform, load (ETL) processes, SSIS can integrate with many external systems using standard tasks, interfaces, and protocols.
SSIS manages these solutions using packages, which you create and modify using a GUI. Packages feature a control flow and data flow in their design, so you can include both orchestration and data manipulation logic.
SSIS packages can be executed in SSIS on a Windows or Linux server running SQL Server. In Azure, Azure Data Factory can execute SSIS packages on a Windows server in Azure running an Azure-SSIS Integration Runtime. Regardless of the service being used to execute an SSIS package, these packages are built using the SSIS project template in Visual Studio.
SSIS contains other functionality in addition to SSIS packages. This includes the SSISDB Upgrade Wizard, the Import and Export Wizard, and the Data Profiling Task and Viewer. These features are discussed next.
SQL Server Integration Services Package Upgrade Wizard
The SQL Server Integration Services Package Upgrade Wizard is a tool that you can use to upgrade SSIS packages created in versions earlier than SQL Server 2022. Although you most commonly access this tool from SQL Server Data Tools, you can also find and launch it from SSMS and from the Windows command prompt. Part of the upgrade wizard in all these scenarios involves the automated backup of the original packages.
To launch this wizard from SQL Server Data Tools:
Open an Integration Services Project.
Right-click SSIS Packages.
Select Upgrade All Packages.
To launch it from SSMS:
Connect to Integration Services.
Expand Stored Packages.
Right-click the File System or MSDB node.
Select Upgrade Packages.
To launch it from the Windows command prompt:
Navigate to the Microsoft SQL Server160DTSBinn folder.
Locate and run the SSISUpgrade.exe file.
SQL Server Import and Export Wizard
The Import and Export Wizard simplifies the act of copying of data from a source to a destination. It uses SQL Server Integration Services to copy data by creating a package in memory. You can choose to save the package the wizard creates for future reuse. The variety of source and destination platforms supported by the wizard is generous. In some cases, you might need to download and install additional drivers and providers from a vendor or from a Microsoft Feature Pack. Table 1-3 lists examples of compatible data sources.
Table 1-3 Data sources in the Import and Export Wizard
Type | Details |
|---|---|
Enterprise databases | SQL Server, Oracle, DB2 |
Text files | CSV or any other delimiter |
Excel/Access | May require Access Runtime |
Azure | Azure Storage |
Open source | PostgreSQL, MySQL |
Others | ODBC, .NET Framework, OLEDB |
You can launch the Import and Export Wizard from the following places:
The Start menu
The command prompt
SQL Server Management Studio
SQL Server Data Tools
Data Profiling Task and Viewer
You can use the Data Profiling Task within SQL Server Integration Services to clarify data patterns (normal versus abnormal) and identify data quality issues before they reach a particular destination (usually a data warehouse). This tool provides visibility into the data quality by calculating and documenting the following metadata and statistical metrics:
Column Length Distribution Profile. Reports the distinct lengths of strings in a selected column and the percent of total rows in the table that each string length represents. This helps you identify invalid values.
Column Null Ratio Profile. Reports the percentage of null values in a selected column. This helps you identify unexpectedly high ratios of missing values.
Column Pattern Profile. Reports a set of regular expressions that cover the specified percentage of values in a selected column. This helps you identify values that are invalid or not in the correct format.
Column Statistics Profile. Reports minimum, maximum, average, and standard deviation for a selected numeric column, or minimum and maximum for a selected datetime column. This helps you identify values that may be outside of the expected range.
Column Value Distribution Profile. Reports the distinct values in a selected column and the percentage of rows in a table that the value represents. This helps you identify unexpected values, especially when you know the number of distinct values expected.
The Data Profiling Task creates an XML output file. You can view this file by using the Data Profile Viewer, which is a standalone application and does not require Visual Studio or SQL Server Integration Services to run.
Figure 1-16 presents an example of the Data Profile Viewer. It displays the XML created by a Data Profile Task, pointed at Microsoft’s WideWorldImporters sample database and analyzing the Sales.Customers table.
![A screenshot of the Data Profile Viewer shows profiles for the [Sales].[Customers] table. The Column Value Distribution Profiles is shown. It shows BillToCustomerID has 263 unique values and AlternateContactPersonID has 402 values. For each value, a count and percentage of total rows is shown.](https://imgdetail.ebookreading.net/2023/10/9780137899845/9780137899845__9780137899845__files__graphics__01xx16.jpg)
Figure 1-16 The Data Profile Viewer, showing column distribution.
SQL Server on Azure Arc–enabled servers
Azure Arc is a bridge that allows you to build applications and services with the flexibility to run across datacenters, at the edge, and in multi-cloud environments. You can manage your instances of SQL Server from Azure with SQL Server on Azure Arc–enabled servers.
Beginning with SQL Server 2022, you can now install the Azure Arc agent with the Azure extension for SQL Server when you install SQL Server on Windows. When you install the Azure Arc agent with the SQL Server extension, you can automatically enable the instance for Azure Arc. This will register the SQL Server instance as a resource in Azure so you can attach additional Azure management services to it.
There are some limitations to this new and evolving product. For example, Azure Arc–enabled servers do not currently support SQL Server failover cluster instances (FCIs).
- Find out more about SQL Server on Azure Arc–enabled servers at https://learn.microsoft.com/sql/sql-server/azure-arc/overview.
Microsoft Purview
Microsoft Purview is a unified data-governance service that helps you manage your on-premises, multi-cloud, and software-as-a-service (SaaS) data. It allows you to map and classify data across your organization with automated data discovery, data sensitivity classifications, and data lineage.
The data catalog functionality of Microsoft Purview helps you find trusted data sources by browsing and searching your data assets. Data Estate Insights gives you an overview of your data estate to help you discover what kinds of data you have and where. Data Sharing allows you to securely share data internally or with other organizations.
- Learn more about Microsoft Purview at https://learn.microsoft.com/azure/purview/overview.
Azure SQL and SQL Server databases can be registered as data sources and scanned by Microsoft Purview. To enable this functionality on a SQL Server in a private network, you need to install the Azure Extension for SQL Server (the same extension used with Azure Arc). You’ll also need a self-hosted integration runtime to perform the scan.
- Find out more about connecting to and managing on-premises SQL Server instances in Microsoft Purview at https://learn.microsoft.com/azure/purview/register-scan-on-premises-sql-server.
Discontinued and deprecated features
Every new version of SQL Server introduces some exciting new features while deprecating or even discontinuing features from earlier versions of SQL Server. Deprecated features may be removed from a future version of the product, so you should not use them for new development. Discontinued features have already been removed and might block upgrades to the latest database compatibility level or migrations to Azure SQL Database.
Several chapters in this book reference features that have been deprecated or discontinued. But the easiest way to stay up to date is to check the Microsoft documentation. As of this writing, three features were deprecated between SQL Server 2019 and SQL Server 2022: Distributed Replay, Machine Learning Server, and Stretch Database. SQL Server Big Data Clusters was also retired.
You can also access the list of deprecated features by using the following T-SQL query. It returns a list of more than 250 features that are deprecated, along with a count of the number of occurrences on your SQL Server instance. This sample script helps you identify and resolve specific occurrences of deprecated feature use in your instance.
SELECT object_name, counter_name, instance_name, cntr_value, cntr_type
FROM sys.dm_os_performance_counters
WHERE object_name = 'SQLServer:Deprecated Features';
In addition to the deprecated features, three features were discontinued: SQL Server Big Data Clusters, SQL Server PolyBase scale-out groups, and installation of Machine Learning Services packages.
- For more discontinued features, see https://learn.microsoft.com/sql/database-engine/discontinued-database-engine-functionality-in-sql-server.