
In this recipe we're showing you how to admin RabbitMQ from an HTTP API using a Management Plugin.
The plugin provides real-time charts to monitor the flow of your messages. Furthermore, it provides HTTP APIs to analyze RabbitMQ. This is required by external monitoring systems such as Ganglia (http://ganglia.sourceforge.net/), Puppet (http://puppetlabs.com), and others in order to perform their activities.
In order to enable the plugin you have to perform the following steps:
- Issue the following command:
rabbitmq-plugins enable rabbitmq_management
- Restart RabbitMQ.
- The plugin enables a web server that is accessible via the URL
http://localhost:15672/. Replacelocalhostwith your RabbitMQ hostname/IP to access from another machine.
By default, the web application uses guest/guest as the RabbitMQ users' username/password. Web management is very intuitive, and you can manage queues, exchanges, users, connections, and virtual hosts and also send and receive messages.

On the first tab, you can find the system overview with the queued messages, message rates, and global count.
Then, you can find node description. Click on the node to get more details:

In the previous screenshot you can see some metrics that can help you to diagnose eventual problems.
Tip
If you are running RabbitMQ on Windows, you need to install the Hanlde.exe SysInternals tool (http://technet.microsoft.com/en-us/sysinternals/bb896655) in an executable path such as C:/Windows/system32. Otherwise, the console won't be able to show the count of the file descriptors.
On the same page, there is other information about the active Erlang modules with their version numbers.
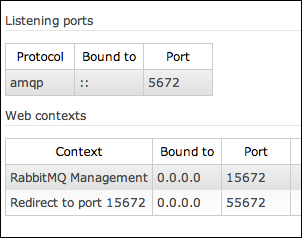
In the lower part of the overview, you can check the listening ports of the AMQP broker and the various installed plugins (web contexts):
At http://localhost:15672/api/, you can get access to the HTTP API. By using the HTTP APIs, the users can create a custom console as we are going to see in the recipe Developing Python applications to monitor RabbitMQ.
At http://www.rabbitmq.com/management.html, you can find the full documentation about the console.