
One of the strengths of Flex is its modern debugging capabilities. Debugging client-side code in web applications has traditionally been cumbersome. The Flash Debug Player, provided with Flex, allows developers the ability to debug applications in the same way they have been accustomed to with other modern development platforms.
In this chapter, we will cover runtime errors, debugging applications using FDB, debugging applications using the Flex Builder debugger, remote debugging, and tracing and logging.
The Flash Debug Player is at the core of the debugging capabilities provided to Flex. The Debug Player provides several benefits specific to developers and is required for most types of debugging you will need to do. The browser plug-in and standalone editions of the Debug Player are included in the free SDK in the /runtimes/player folder, and in the <Path to Flex Builder 3>/Player folder if you are using Flex Builder 3. Also, if you installed Flex Builder, the Debug Player browser plug-in is typically installed during the install process. You can always check to ensure that you have the latest edition of the Debug Player by visiting http://www.adobe.com/support/flashplayer/downloads.html.
If you are unsure whether you have the Debug Player installed within a browser, you can build a simple application to check the version of the player installed. Here’s an example:
<?xml version="1.0" encoding="utf-8"?>
<mx:Application xmlns:mx="http://www.adobe.com/2006/mxml">
 <mx:Label text="Flash Player Version: {flash.system.Capabilities.version},
Debug Player: {flash.system.Capabilities.isDebugger}"/>
</mx:Application>
When you open the application in your browser, you should be
presented with the version of Flash Player and whether it is the debug
edition. flash.system.Capabilities is a
class that Flash Player provides that allows you to retrieve information
about the runtime environment in which an application is executing. In
this example, we are checking the isDebugger property, which should return
true if you have the Debug Player
installed. You can also use this property to enable additional debugging
type features of an application only when they are running within a Debug
Player.
The Debug Player provides several additional capabilities on top of the traditional player, as we’ll see in the next section. This functionality allows a developer access to the runtime behavior of a running application and is required for some debugging tools, including the command-line debugger and the Flex Builder debugger.
Warning
Running an application in the Debug Player, especially when it is being debugged, will impact runtime performance and can even impact application behavior. You should install the Debug Player only for debugging purposes and never in a production environment.
Flash Player 9 supports runtime type checking and exceptions capabilities that developers have become accustomed to in any modern runtime. Runtime errors when identified during the development process can help a great deal when debugging applications. Runtime errors are not presented to users with the non-Debug Player installed, but for development and testing purposes, you should have the Flash Debug Player installed (as should any team members who are involved in application testing). The Debug Player will display runtime errors by presenting you with a dialog as errors occur in your application. You may wonder why such errors are not presented to the user with the regular Flash Player. This is because Adobe silently hides such errors from regular users to minimize their impact on the application experience. The runtime errors still occur, but rather than interrupt the user with a dialog and halt the applications, Flash Player attempts to silently continue code execution. This does not guarantee that an application will always continue to run; some exceptions are fatal and will cause an application to halt. Because of this, it is not advisable to deploy any application that contains runtime exceptions that are not handled. This also does not guarantee that an application will respond as expected when a nonfatal exception occurs. In general, it is a good practice to properly handle exceptions to prevent unexpected results.
Note
A good practice on a team is to have all testers and developers install the Flash Debug Player. Doing so will allow you to catch runtime errors earlier in your development process.
If you execute this code in the Debug Player, you will receive a runtime error:
<?xml version="1.0" encoding="utf-8"?>
<mx:Application xmlns:mx="http://www.adobe.com/2006/mxml" initialize=
"initializeHandler()">
<mx:Script>
<![CDATA[
private function initializeHandler():void
{
var loader:Loader = new Loader();
loader.load(new URLRequest("foo"));
}
]]>
</mx:Script>
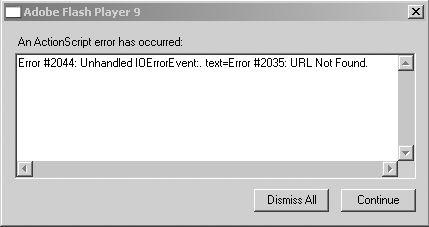
</mx:Application>The runtime error you’ll receive is IOErrorEvent, as the example doesn’t handle
such an exception. Figure 18-1
shows the dialog that results when running Debug Player.
You can find a list of runtime error codes, along with descriptions, in the Flex Language Reference documentation, under Appendixes→Run-Time Errors.
Although runtime errors are useful, often you will require more than just runtime errors to identify bugs. For such cases, the Flash Debug Player exposes an API for debuggers to interact with an application at runtime. This includes the ability to set breakpoints, step through code, set and retrieve variables at runtime, as well as other debugging-related tasks. Adobe provides two debuggers. One is the free FDB command-line debugger provided by the Flex SDK, and the other is the integrated GUI debugger that is part of Flex Builder. The debuggers communicate with the Flash Debug Player through a TCP socket connection. Typically, this happens on the same machine, but it is possible to also do remote debugging whereby one machine is the client and the other is running the debugger.
To allow the Debug Player to initiate a debug session, the application must be compiled with the debug data included within the SWF.
To do this, you need to set the -debug
mxmlc compiler flag to true.
mxmlc -debug=true main.mxml
This flag generates a debug-enabled SWF. Although you may not
experience any side effects from using a debug-enabled SWF for
production, this is strongly discouraged because the -debug compiler flag produces larger SWF files
and exposes the internals of an application. If a user has the Debug
Player installed, he could inspect the internals of your application and
even change client-side variable values. Later in this chapter, we will
discuss how to use debug-enabled SWF files using various debuggers
available today.
Even with modern hardware, you can run into rendering performance bottlenecks with graphics-intensive applications. Isolating such bottlenecks can be challenging, especially considering all the variables involved in how Flash Player renders content. For this reason, the Debug Player exposes an option called Show Redraw Regions.
When this option is enabled, the player will highlight areas of a
running application that are being redrawn, which can help you in
identifying graphical regions of an application that may be drawing
inefficiently. You enable this option by selecting the Show Redraw
Regions option from the Debug Player’s context menu or through ActionScript. To enable this option
through ActionScript you can call the showRedrawRegions() method of the flash.profiler
package. This method works only with the Debug Player and doesn’t require a
debug-enabled SWF. Here’s a simple example that will allow you to
experiment with how this feature works:
<?xml version="1.0" encoding="utf-8"?>
<mx:Application xmlns:mx="http://www.adobe.com/2006/mxml"
initialize="flash.profiler.showRedrawRegions(true)">
    <mx:HSlider width="100%"/>
</mx:Application>
Compile and run this example in the Debug Player. Drag the slider to see how the Debug Player highlights what areas are being redrawn. This is especially helpful with Flex applications because the Flex framework provides a lot of functionality that you don’t need to implement and often may not even know how it is implemented. Using the Show Redraw Regions feature can help you identify rendering bottlenecks in Flash Player.
Note
By default, the showRedrawRegions() method will highlight
regions by drawing a blue rectangle outline around the regions being
redrawn and the player context menu will use a red outline. However,
sometimes you might find the default color difficult to identify. If
so, you can specify your own color values by passing in a color value
for the second parameter of the showRedrawRegions() method.