Chapter 22
SQL Server Reporting Services Administration
WHAT’S IN THIS CHAPTER?
- How to Use SQL Server Configuration Manager to Set Up Your Newly Installed SQL Server Reporting Services Server
- Navigating and Understanding the Properties Associated with an Installed Reporting Services Server
- Using Report Builder to Create New Reports Useful to the DBA
- Managing and Executing Reports with Report Manager
SQL Server Reporting Services (SSRS) is one of the simplest tools in the Microsoft stack to configure. This is because of the easy-to-use SQL Server Configuration Manager and the complete, yet understandable, properties of a Reporting Services server, accessed through SQL Server Management Studio. To understand how Reporting Services works, you need to understand how a report is built and executed. Thus a brief overview of Report Builder is in order, and you can even use it to create reports useful to DBAs. Then the real fun begins, as you see Reporting Services in action through the use of Report Manager. Report Manager is a suite of web pages that ships with SSRS. These pages enable users to easily execute their reports and give administrators methods to manage, schedule, and maximize server resources.
SQL SERVER REPORTING SERVICES CONFIGURATION MANAGER
Reporting Services is configured using its own tool, separate from the SQL Server Configuration Manager. In most cases you’ll have already configured your instance of Reporting Services during the install of SQL Server. Following are reasons when you need to alter the configuration:
- You need to change a value, such as the service account that SSRS runs under.
- During install, you chose not to conFigure SSRS.
- You set up additional instances of SSRS.
- You need to configure a scale-out implementation of SSRS.
You can accomplish any of these tasks — and more — using the Reporting Services Configuration Manager. Complete the following steps to start using this tool:
1. To launch the configuration manager, go to Start menu ![]() Microsoft SQL Server 2012
Microsoft SQL Server 2012 ![]() Configuration Tools
Configuration Tools ![]() Reporting Services Configuration Manager (see Figure 22-1).
Reporting Services Configuration Manager (see Figure 22-1).
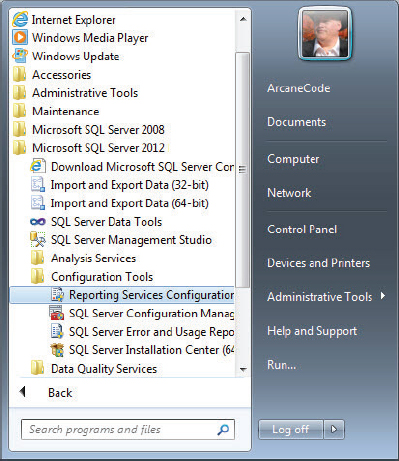
The Reporting Services Configuration Manager is version-specific. The configuration tool that came with SQL Server 2012 may be used only to manage a SQL Server Reporting Services 2012 server. To manage the Reporting Services server for previous versions of SQL Server, use the configuration manager specific to that product.
2. When the tool launches, select the Reporting Services server to configure, as well as the instance of SSRS, as shown in Figure 22-2.
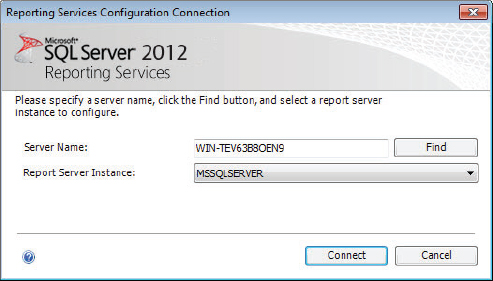
Typically you configure on the box the Reporting Services Connection Manager is working on, but you can manage multiple SQL Server 2012 Reporting Services servers using the same configuration manager.
3. After you select the server to manage, simply click Connect to open the main tool.
The opening screen in Figure 22-3 displays some basic information about the server you are configuring. You can see the specific instance name and ID, along with the specific edition and version number. The name of the database containing the reporting items is also shown. In the example shown in Figure 22-3, the default of ReportServer was taken.

You can see the service runs in Native mode. SQL Server Reporting Services can also run in SharePoint Integrated mode. Starting with 2012, configuration of Reporting Services running in SharePoint Integrated mode should be done through the SharePoint console, not the SSRS configuration manager.
In SharePoint integrated mode, SharePoint manages all aspects of reporting. Reports are uploaded to and stored in SharePoint. Security is controlled within SharePoint. In addition, features of SharePoint libraries such as version control and alerts are supported with reports.
There are some disadvantages to running SSRS in integrated mode however; items such as custom security extensions, the ability to manage reports within Report Manager, and the ability to use the Reporting Services Configuration Manager are not supported when running in SharePoint integrated mode.
A discussion about how to configure with SharePoint console is outside the scope of this chapter, but you can fine more information on this topic at http://msdn.microsoft.com/en-us/library/bb326356.aspx.
Finally, you occasionally have changes that prompt you to recycle SQL Server Reporting Services. You can do so by starting and stopping the service, as shown in Figure 22-3.
The Service Account
The Report Server service account is the user account under which Reporting Services run. Although initially configured during the installation of SQL Server, it can be updated or modified on this screen (shown in Figure 22-4). It is under the service account that the Report Server web service, Report Manager, and background process tasks all run.
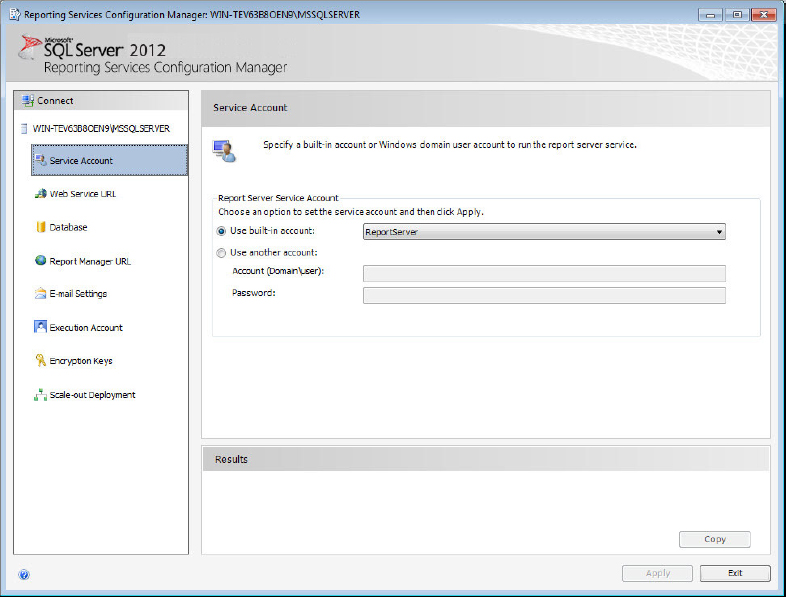
Should you decide to change the account, you have two options:
- Built-in Account: With Windows Server 2008 and previous versions, you may opt to use one of the built-in accounts, such as Network Service, Local System, or Local Service. Of these, Microsoft recommends the use of the Network Service account.
Beginning with Windows Server 2008 R2, SQL Server now installs all of its services, including Reporting Services, to run using virtual accounts. A virtual account is a local account on the server running under the NT Service account. SQL Server manages all this for you, and as you see in Figure 22-4, the installer has configured to run with the Report Server virtual account. When you have more than one instance of SSRS installed, their virtual accounts have the name of the instance integrated into the virtual account name.
- Specific Account: As an alternative to the built-in account, you can instead choose a specific Windows user account. This could be an account specific to a computer and entered in the format <computer name><user name>, or a domain account in the <domain><user> format. Avoid using the account of the domain administrator. This account has a greater set of permissions than are needed to run SSRS and could present a vector for a security breach. The account you select must already exist, Reporting Services Configuration Manager cannot create a new account for you. It does however handle the duty of granting the needed permissions to the account you select.
Before you set up a specific account, however, you must be aware of a few limitations.
- The account name cannot exceed 20 characters.
- If you specify a domain user account and run in a Kerberos environment, you must register a Service Principal Name for the ID you use on your Report Server.
Running SQL Server on the same server that is the domain controller is not advised. It sometimes occurs, however, especially in cases of a small development machine where a single server hosts everything. When you have that specific situation, be aware that built-in service accounts, such as Local Service or Network Service, are not supported as service accounts for SSRS.
After changing the service account, you are prompted to back up your encryption keys. You should be ready to do so because it is imperative these keys are properly backed up. Encryption keys are discussed later in this chapter, but for now be ready to back them up when prompted.
The Web Service URL
One of the great things about Reporting Services is its capability to integrate with other applications. Reports may be called as a hyperlink in a web page. They may be embedded in Report Viewer control in an ASP.Net or Windows application. All of this is possible because Reporting Services exposes its capabilities through a Web Service.
A web service is a program that uses a Uniform Resource Locator (URL) — a fancy way of saying an HTTP address — as its interface. When a formatted http command is passed to the web service address, the web service processes that request and returns data, typically formatted as an html page.
Web services can do more than just return data though. Using the SSRS web service, you can upload reports, execute them, run the report and export the data to a file, validate parameters, and more. All these actions require you to use an application to interface to the web service. Some of the applications from Microsoft that can interact with the web service are Report Builder, SQL Server Data Tools, and Report Manager. You may also write your own application that interacts with the web service using one of the many .Net languages available.
To customize the web service URL for this instance of SSRS, use the Web Service URL page, as shown in Figure 22-5. The default URL is the name of the server, followed by the port number and then the virtual directory ReportServer, all of which are configurable.
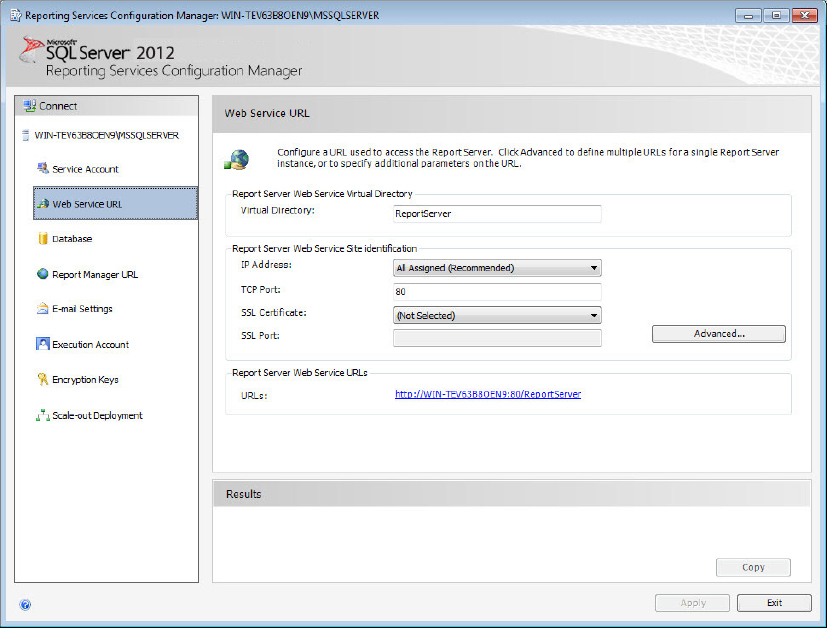
You can have more than one Web Service URL exposed by Reporting Services. To do so, use the Advanced button and add additional URLs to this server. Reporting Services also supports secure connections via SSL. Simply specify the SSL certificate and port number.
One of the first places you’ll likely use the web service URL is within SQL Server Data Tools (SSDT, also known as Business Intelligence Developer Studio [BIDS] in former versions of SQL Server). From within SSDT you can deploy your reports to the report server. To do so you first must go to the properties page for the report project. One of the properties is the target server; it is the Web Service URL you use for this property.
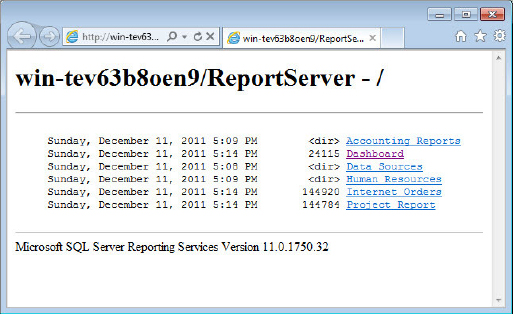
Figure 22-6 shows an example of what you see if you try to navigate to the web service URL from within your web browser. It is a simple listing of the reports, with links that enable you to open or drill down into folders. This can be a good way to validate the web service URLs you use in your applications but it is a terrible interface for the average user. Fortunately, Microsoft provides a complete solution for users to interface with SSRS in the form of Report Manager, which is covered in-depth in the “Report Manager” section later in this chapter.
Reporting Services Databases
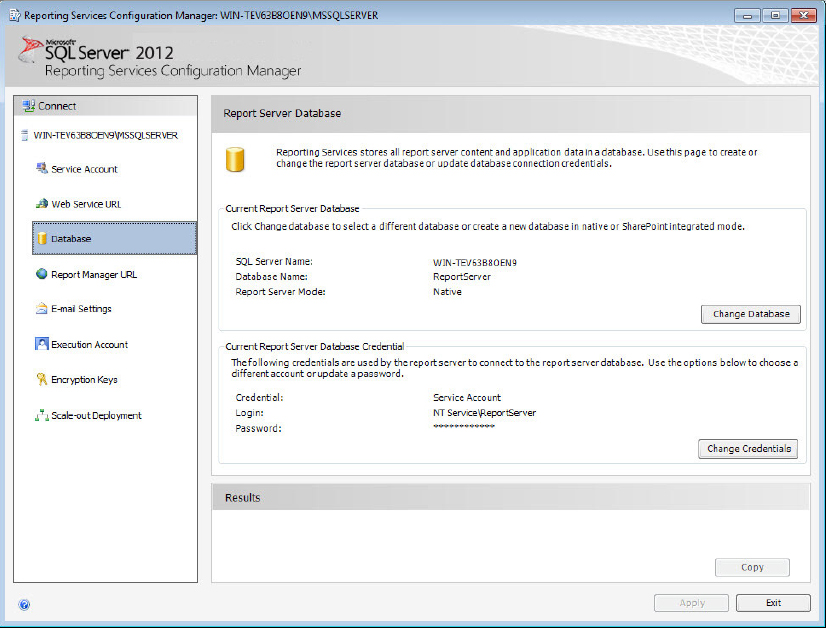
Reporting Services requires two databases to do its work. You can create these during the installation of Reporting Services or afterward using the Reporting Services Configuration Manager. By default, these databases are named ReportServer and ReportServerTempDB, although these may be renamed during their creation. Figure 22-7 shows the configuration screen for setting up these databases.
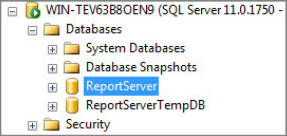
In Figure 22-8, you can see these databases are visible inside SQL Server Management Studio.
The ReportServer database stores all the reports, as well as data source information, logins, subscriptions, and more. All sensitive data is encrypted using the encryption keys, a topic covered in the “Encryption Keys” section of this chapter.
As its name implies, ReportServerTempDB holds temporary information for Reporting Services. Cached reports are one example of an entity that is stored. If you had a report that was used by many users — perhaps a morning status report — you could have that report generated and cached so that the report accesses only the source database once. Users executing the report would see the cached report, instead of having to completely regenerate it on each execution. When the cache time expires, the report is flushed from the ReportServerTempDB cache.
Important distinctions exist between the two databases you need to be aware of. It’s vital that the ReportServer database be backed up because it contains all your information about the reports hosted on this instance of SQL Server Reporting Services. If a restore is needed, you can restore this database much as you would any other. After restoring it, you need to restore the encryption keys for the encrypted information to be decipherable by Reporting Services.
The ReportServerTempDB is quite the opposite. All data within the temporary database can be deleted without permanent damage to your SSRS installation. It would require, however, all reports with caching enabled to be rerun and cached because the cache would be lost if ReportServerTempDB goes away.
For disaster recovery purposes you have two options. First, you can chose to back up ReportServerTempDB along with ReportServer. However, the temporary database typically grows fairly large and can consume a lot of time and disc space in backups. For that reason many users go with the option to generate a script to create ReportServerTempDB. If a recovery occurs then the script is run, and if necessary any reports that need to be cached can be executed. To create a script, simply right-click the ReportServerTempDB database name, select Script Database As ![]() Create To
Create To ![]() File, and save the output.
File, and save the output.
The names ReportServer and ReportServerTempDB are the default names for these databases. If multiple instances of SSRS are installed on the same server, the default names are appended with an underscore and then the instance name. As a best practice, you should retain these names because that is what most SQL IT Professionals are accustomed to. You can, though, change these if the need arises.
To change the database, simply click the Change Database button. This brings up a wizard that provides two options: connect to an existing database or create a new database. After you select your option, the wizard walks you through a series of questions common to both choices. You select the server for the databases, the name of the database, the credentials to use, and so forth. When done, Reporting Services now uses the database you indicated in the wizard.
Although it’s not uncommon to have the ReportServer and ReportServerTempDB databases on the same SQL Server that Reporting Services runs on, it is not required. You can elect to put the reporting databases on a separate server and have only SSRS run on the report server.
This flexibility is commonly used with a scale-out deployment. You can implement two topologies in this scenario. In the first, the ReportServer and ReportServerTempDB databases reside on a server containing a SQL Server database engine. Then, two servers are created that run only SSRS. Both point to the ReportServer and ReportServerTempDB databases on the database’s first server.
The second is a slight variation that has only two servers. The first server holds both the databases and SSRS; the second runs only SSRS and points back to the first server for the ReportServer and ReportServerTempDB databases.
Although these are the most common two setups, you are not limited to only two SSRS servers in a scale-out situation. You could simply configure the additional servers to point to the central ReportServer and ReportServerTempDB databases. See the “Scale-Out Deployment” section later in this chapter for more information.
In a single server environment, if you chose to install and configure Reporting Services during the install of SQL Server, you generally won’t need to alter the information in Figure 22-7. You need to understand how the reporting databases are used though, and how they can be configured within your server environment.
The Report Manager URL
SQL Server Reporting Services ships with an interface called Report Manager, which enables users to upload, configure, and run reports. Through Report Manager you can apply security to a specific user or to a group. Permissions can vary from as basic as having only the ability to run certain reports, to having full administrative control over the report server.
By default the URL is the name of the server, followed by the default port of 80, followed by the virtual directory name of Reports. This URL is configurable and may be changed on the page as seen in Figure 22-9.

As with the Web Service URL, you can specify multiple URLs using the Advanced button of the Report Services Configuration Manager. For example, you may want to have one standard http style URL for internal use and a Secure Socket Layer (SSL) version of the address (https) for external use.
Report Manager is a big topic and is covered in-depth in the “Report Manager” section later in this chapter.
E-mail Settings
One of the options Reporting Services provides is the ability to set up e-mail–based subscriptions for reports. Users may elect to have reports automatically generated and e-mailed to them. To support this, Reporting Services must have access to an e-mail account. Figure 22-10 shows where to enter your e-mail information.
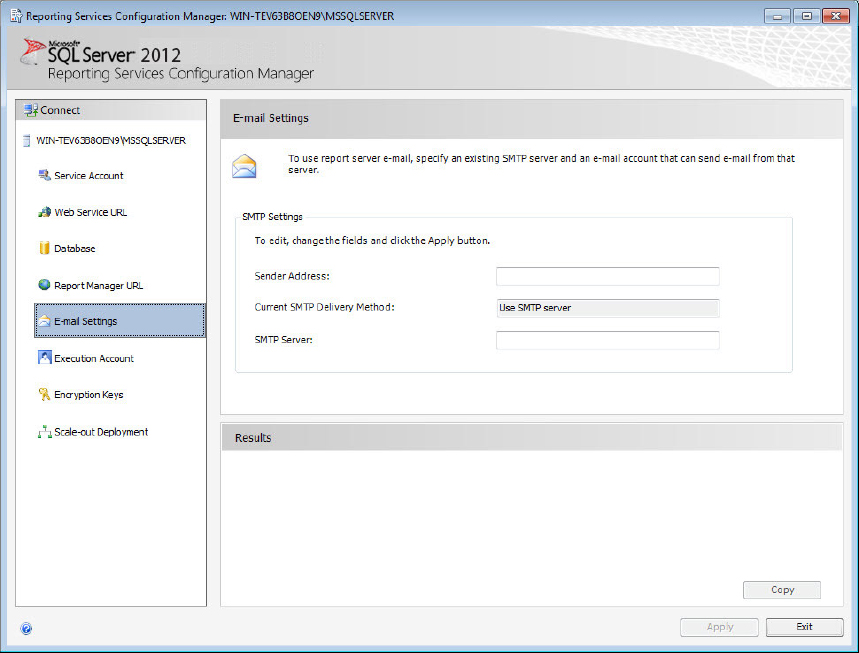
As with most accounts used with servers, you must ensure the account has a non-expiring password and that it has rights to e-mail the various attachment types supported by SQL Server Reporting Services. You need to take care with this ability however. Some reports can become quite large and flood your e-mail servers with attachments. Consider having reports generated and stored in a central repository and instead e-mail links to the reports.
Execution Account
There are times when a report requires data, but the credentials to get to that data haven’t been stored with the report. SSRS needs a set of credentials it can use to try to retrieve the source data. Through the configuration manager (see Figure 22-11) you can select a specific domain account to use. This account then becomes the Execution Account.
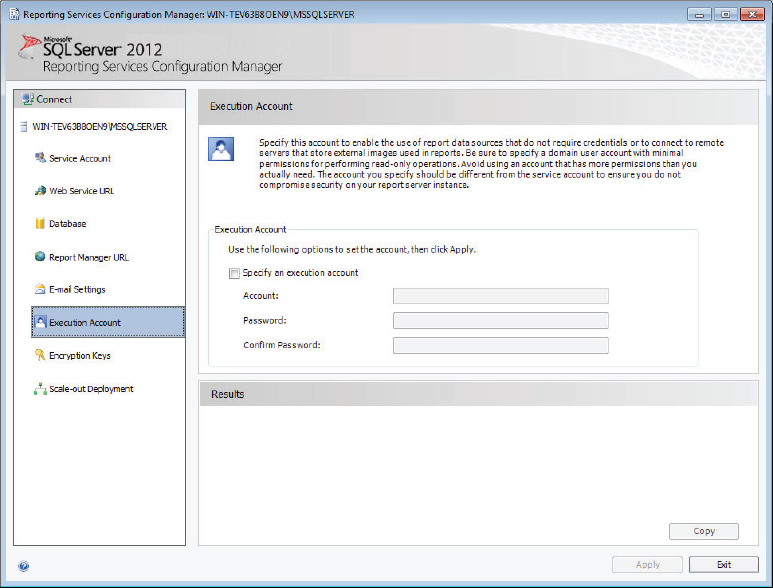
The domain account used for the Execution Account should have the least amount of required permissions for doing its job. For example, it should have read-only permissions to any source data used by the reports.
Reports also have the capability to display images stored external to the report. The Execution Account credentials access the location of these images.
Don’t confuse the Execution Account with the Service Account. The Service Account is the account under which all Reporting Services is actually running. The Execution Account is used strictly for accessing data or stored images when no other credentials have been supplied.
The domain account used for the Execution Account should be different from the Service Account. The Execution Account needs different and typically less permissions than the Service Account. By using different accounts you minimize your security risks.
Encryption Keys
Reporting Services requires a good deal of confidential information to do its job. Credentials, connection strings, and the like must be stored in a secure manner. This kind of sensitive data is stored in the Reporting Services report database, but before it is stored it is encrypted using an encryption key. Encryption keys are managed using the screen shown in Figure 22-12.
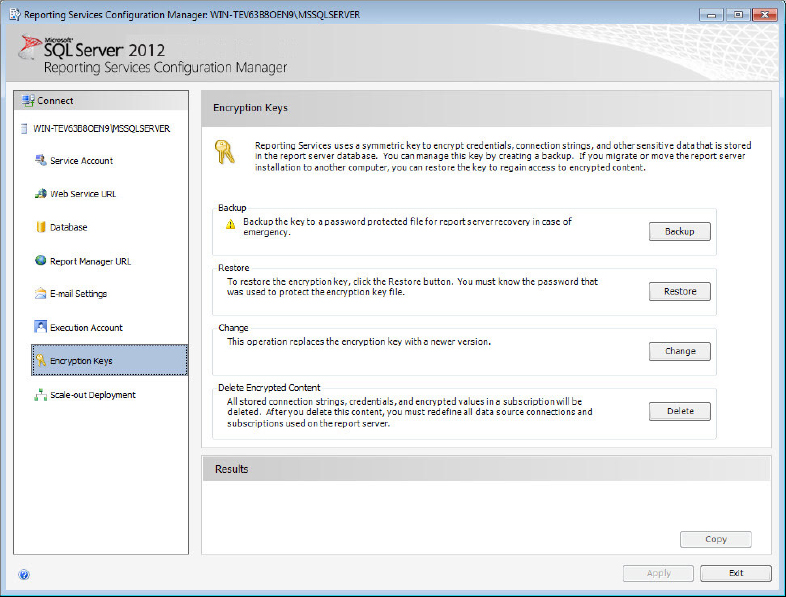
It is vital that this encryption key be backed up. If the Reporting Services database needs to be restored, either from a crash or moving the instance to a new server, you need to restore the encryption keys. Without doing so all the confidential information stored is unusable, and you are faced with the laborious task of re-creating all the credentials manually.
After you restore the report database, you can restore the encryption keys through the dialog, as shown in Figure 22-12. When restored Reporting Services again has the capability to properly decrypt the stored credentials, thus restoring the server to full functionality.
There may be occasions in which you want to change the security credentials. For example, you might have lost the backup of the encryption key which would present a potential security issue. Or you may have corporate rules requiring periodic refreshes of all your encryption keys. The change command in Figure 22-12 creates a new security key. Of course after changing the key, be sure to back it up.
You may also have the need to remove any sensitive data stored in the report database. You can use the Delete function to remove any confidential information stored by Reporting Services.
Scale-out Deployment
At some point the demands on your Reporting Services server may grow too large for a single server to handle effectively. Microsoft has provided for that situation through the use of Scale-out Deployment. In a Scale-out scenario, multiple servers can process reports. All the servers share a common Reporting Services database.
Before you start planning your Scale-out environment, you must be aware of some prerequisites. First, Scale-out is an Enterprise-only feature. Although you can also set it up in the Developer or Evaluation versions, this is meant strictly for learning, development, and evaluation and not a production situation. The Standard, Workgroup, and Express versions of SQL Server do not support Scale-out deployment for Reporting Services.
Next, all servers in the scale-out farm must run the same major version number and have the same updates and service packs applied. They must also be on the same domain or in a trusted domain. Finally, the servers must use the same authentication modes. If you have created any custom authorization extensions, the same extension must exist on the servers.
Although not a strict requirement, it is best if both servers have an identical physical configuration or as close as is possible.
Now that you have met the basic requirements, it’s time to configure your servers. This example uses the most common scenario; the first server has both SSRS and the ReportServer/ReportServerTempDBs installed on it. The second server runs only SSRS.
1. Set up your first SQL Server Reporting Services server, as has been described throughout this chapter.
2. Next, install SQL Server Reporting Services on a second server. (Although you can install multiple instances of SSRS on the same server and configure them for scale-out, there is no benefit to doing so.) When you get to the installation step for SQL Server Reporting Services, select the Install but Do Not Configure Server option.
3. After installation completes, open the SQL Server Reporting Services Configuration Manager, and on the opening dialog, select your new server. Begin by going to the Database page, and point the database to the Reporting Services database on the original server.
4. Next, go to the Report Server Web Service and Report Manager pages and configure their URLs. Don’t test them yet, however because they won’t be available until you join this server to the Scale-out Deployment, which is the next step.
5. Close out your connection to the second Reporting Services server, re-open the configuration tool, and point it to the original server. Return to the Scale-out Deployment page; you should now see both servers listed. The original server should already show its status as Joined. Your new server should be listed; however, its status should read Waiting to Join, as shown in Figure 22-13.

6. Simply select the new server, and then click the Add Server button. After it has joined, you can verify it by going to the Report Services or Report Manager URLs specified when you configured the new server.
Reporting Services also supports being installed on a network load- balanced cluster. If you do so, you must configure a few additional items. For more information, see the Books Online article “Configure a Report Server on a Network Load Balancing Cluster.”
After you have SQL Server Reporting Services installed and configured, you may want to alter several properties. To do so, perform the following steps:
1. Start by launching SQL Server Management Studio. In the Object Explorer, click the Connect menu button; then in the list select Reporting Services, as shown in Figure 22-14.

2. In the connection dialog, ensure the server is correct as well as the authentication method; then click the Connect button.
3. When you connect, the Reporting Services server appears in Object Explorer. To access the properties, right-click the server name, and select Properties, as shown in Figure 22-15.

General Properties Page
The server properties dialog has a number of pages, listed on the left side, that enable you to explore and alter the settings within the Reporting Services server. Start by looking at the General tab, as shown in Figure 22-16. The General tab has a variety of options which are explained in the following list:

- The Name property is the name of the server displayed in Report Manager. As you’ll see in the “Report Manager” section later in this chapter, the Name you enter into this property is used as the site title in Report Manager. Select a name that would be meaningful to the users, such as the name of your company or perhaps the department or application the SSRS server will be used by.
- The Version and Edition properties are read-only and simply display the information about the version of SQL Server Reporting Services.
- Authentication Mode is another read-only property, which indicates the types of authentication modes that will be accepted by this SSRS server.
- The URL is the http address for the web service under which SSRS can be accessed. The URL is set in the Reporting Services Configuration Manager, as shown in the previous section of this chapter.
- Moving down the dialog, you see a check box to enable a My Reports folder for each user. Within the Report Manager each user can have her own folder to work with. Named My Reports within Report Manager, a user can have full control to upload new reports, update existing ones, schedule them to run or execute them at will, and more.
If you choose to enable the My Reports feature, the Select the Role to Apply to Each My Reports Folder drop-down becomes enabled. This sets the permissions users have within their My Reports folder. Permissions are discussed more in the upcoming section on Report Manager.
- The final option on the dialog in Figure 22-16 enables or disables the ability to download a special ActiveX print control. This special control enables features such as print preview, controlling page margins, and other items common to print dialogs.
Execution Properties Page
The Execution page, as shown in Figure 22-17, controls how long a report can run before Reporting Services halts execution of the report. It has two choices; the first is Do Not Timeout Report Execution. Although this may seem like a good option, it is quite dangerous. If a report goes awry, it can remain in memory using resources until the Reporting Services server is finally restarted.
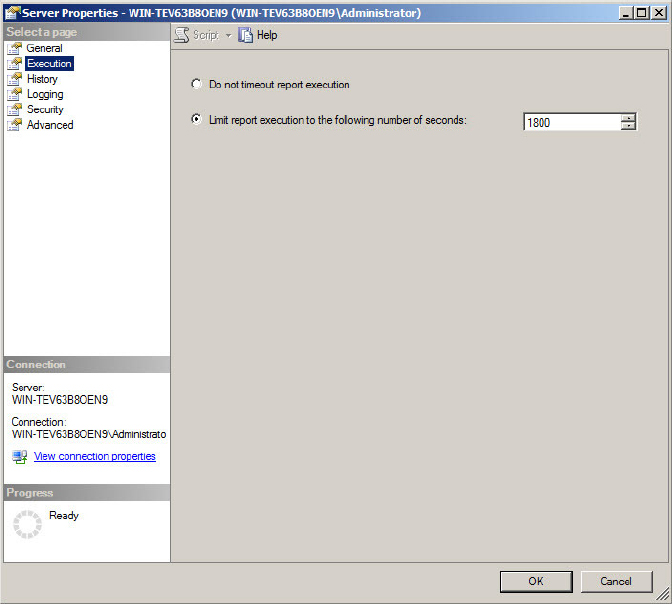
A better option is the default Limit Report Execution to the Following Number of Seconds. By default reports can run up to 1800 seconds (30 minutes) before SSRS halts execution of the report. In most situations this will be plenty of time, but it is not uncommon to have some reports that take longer to run. If so, you can increase the allowed run time through this setting.
History Properties Page
For any report, users can elect to have Reporting Services take a snapshot of that report and store it for historical purposes. Users can see each time a report runs, along with a copy of the report including the data associated with that particular run of the report.
Although this is a useful feature for auditing purposes, it can cause the ReportServer database to swell quickly if done on many reports. Through the History Properties Page, as shown in Figure 22-18, you can control how many historical copies of reports are maintained.

By default, SQL Server Report Services retains all snapshots of a report in history. You can instead select to limit the number of copies by choosing that option and setting a value for the number of copies to retain.
Logging Properties Page
Metrics are invaluable to a DBA in managing SQL Server. SSRS provides a rich set of information through its logging mechanism. Data such as the name of the report, who ran the report, how long the report took to execute, when the report ran, and more are exposed through views in the ReportServer database.
The next section examines the views in Report Builder, using them to build a useful report. For now, understand that you can control whether logging is done using the Logging Properties Page, as shown in Figure 22-19.

This dialog has two basic options. The first determines whether SQL Server Reporting Services does logging. The second option sets the number of days for which logs are retained. The default is 60 days.
Security Properties Page
There are two options for working with security at the Reporting Services server level, as shown in Figure 22-20. The first specifies whether a report is allowed to connect to its data source using the security credentials of the user trying to run the report. When disabled, users can either supply credentials manually (the report must have the credentials stored with it) or no authorization needs to be given to allow access to the source data.

The second option, Enable Ad Hoc Reporting, sets whether a user can perform ad hoc queries from a Report Builder report when new reports are automatically generated when a user clicks data. Leaving this enabled can be a security risk. Turning it off mitigates denial-of-service attacks from hackers attempting to overload the report server.
Advanced Properties Page
The final page of the Reporting Services server properties is the Advanced Page. As you can see in Figure 22-21, this page provides a single place to configure all the properties. Many of these may also be set on the previous pages. For example, the first line, EnableMyReports, may also be set on the General Properties Page.
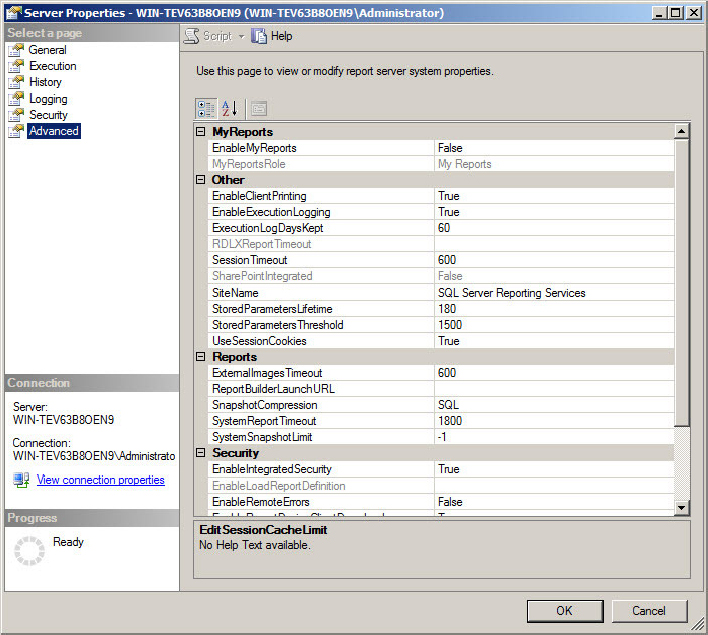
For details on each individual option, see Books Online at http://technet.microsoft.com/en-us/library/bb934303(SQL.110).aspx.
In the previous section you saw the option to turn execution logging on and off. In this section, you see what is in the report execution log. To get started, follow these steps:
1. Open SQL Server Management Studio, and connect to the Database Engine where the ReportServer database is stored. By default the database has the name ReportServer, and that’s how you can refer to it here. However, if you changed the name during the install or using the Reporting Services Configuration Manager, select the database you named.
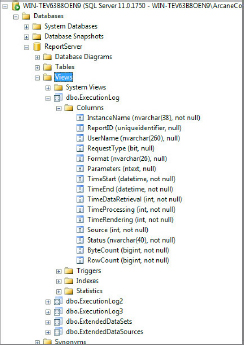
2. Within the Views branch are three views directly related to logging: ExecutionLog, ExecutionLog2, and ExecutionLog3. Each contains the same basic information — the ID of the report, the server instance the report ran on, how long it took to run the report, who ran the report, and so forth. The second and third versions of the view extend the amount of information returned. Figure 22-22 shows an example of the three views, with the first one expanded to show its columns.
You can create a SQL statement to extract data from the view. This statement is the basis for a report you create in the next section. The view contains most of the information you need; the only missing element is the name of the reports, which you can find in the dbo.Catalog table. Listing 22-1 shows the query that provides the information you need.
LISTING 22-1: SQL Script to Display Basic Error Log Information
SELECT [InstanceName]
     , C.[Path] AS [ReportFolder]
     , C.[Name] AS [ReportName]
     , [UserName]
     , CASE [RequestType]
         WHEN 0 THEN 'Interactive Report'
         ELSE 'Subscription Report'
         END AS [ReportType]
     , [TimeStart]
     , [TimeEnd]
     , [TimeDataRetrieval] AS [TimeDataRetrievalMilliseconds]
     , [TimeProcessing] AS [TimeProcessingMilliseconds]
     , [TimeRendering] AS [TimeRenderingMilliseconds]
     , CASE [Source]
         WHEN 1 THEN 'Live'
         WHEN 2 THEN 'Cache'
         WHEN 3 THEN 'Snapshot'
         WHEN 4 THEN 'History'
         WHEN 5 THEN 'Ad Hoc'
         WHEN 6 THEN 'Session'
         WHEN 7 THEN 'RDCE'
         ELSE 'Other'
         END AS [ReportSource]
     , [Status]
     , [ByteCount]
     , [RowCount]
  FROM [ReportServer].[dbo].[ExecutionLog] E
  JOIN [ReportServer].[dbo].[Catalog] C ON E.ReportID = C.ItemID
Figure 22-23 shows the output of the query, as shown in SQL Server Management Studio.
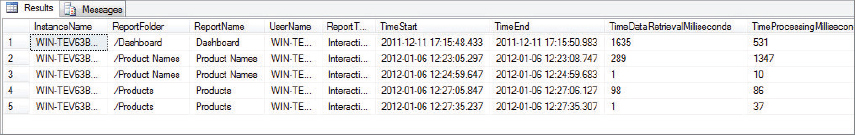
This example shows a small sample of the information available within the execution logs. You can explore to see what further information is available. Keep this query because it will be the basis for the next section in this chapter.
To make the most of Reporting Services, you must understand how reports are created. There are two main methods: SQL Server Data Tools (formerly known as Business Intelligence Developer Studio or BIDS) and Report Builder. As SQL Server Data Tools could encompass a book of its own, in this chapter, you look at the simpler Report Builder in the following steps.
Both Report Builder and SQL Server Data Tools produce the same output: a file ending with RDL (Report Definition Language). RDL files produced in one tool can then be opened and edited in the other with no loss of formatting or information.
1. To start you first need to obtain a copy of Report Builder. It’s a free download from Microsoft at http://www.microsoft.com/download/en/details.aspx?displaylang=en&id=6116. Alternatively, you can launch Report Builder from within Report Manager. For standard users this can be a simple way to access Report Builder. As an IT Professional, however, downloading and installing allows you to create reports and run them independent of Report Manager.
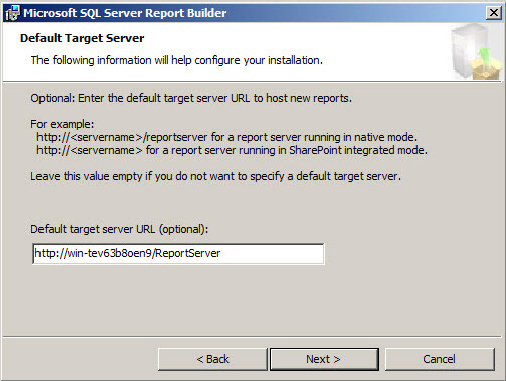
2. After downloading Report Builder, begin the install process. Most of the questions are simple, and you can take the defaults. The one screen you should be aware of is shown in Figure 22-24. It asks for the URL to the SSRS web service. This is optional, but if you fill it in now it can make deployment easier later. If you’ve forgotten the address, you can look it up using the Reporting Services Configuration Manager’s Web Service URL, discussed in that section earlier in this chapter. After filling in the URL to use as the default, or deciding to leave it blank, you can finish the install wizard.
3. Now that you have Report Builder installed, it’s time to create your first report. Before you launch the application though, there’s something important you need to be aware of. If you run Report Builder on a Windows server, you get an Insufficient Rights error when you try to preview the report. To prevent this, simply run Report Builder in administrator mode. Open the Start Menu and navigate to the Report Builder menu item. Right-click Report Builder, and select Run as Administrator, as shown in Figure 22-25.

After Report Builder fires up and connects to the Reporting Services server, the opening screen displays (Figure 22-26). You can pick from quite a variety of options. In addition to creating a new report, you can also create a new dataset. A dataset is just what it sounds like; it defines a set of data that will be returned from a server. Think of it as the combination of a SQL statement along with the connection string needed to talk to the server. When you create a dataset, it can be shared across several reports. You also have the ability to open a report that already exists, and a short cut to view reports you recently edited. Now create a new report.
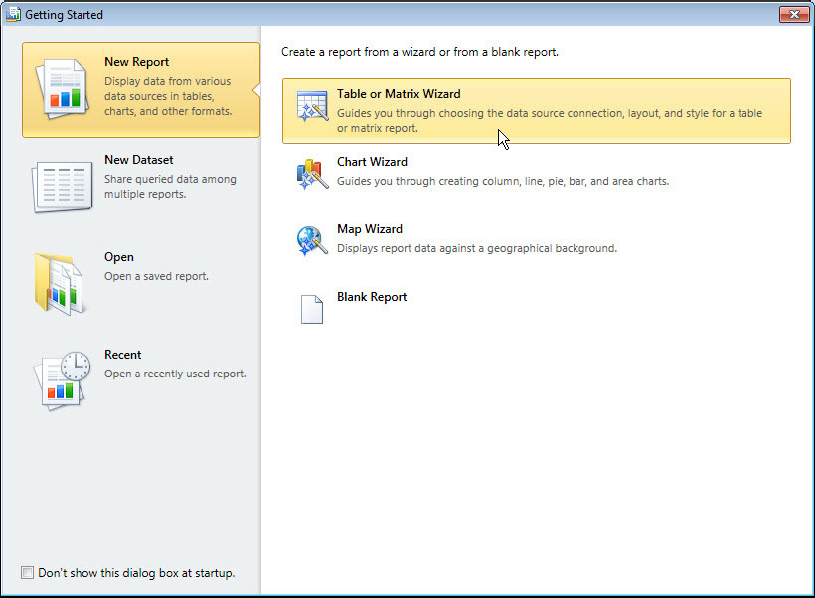
Within the options for creating a new report, you can create several types of reports. The Table or Matrix report creates a traditional text based report. The Chart Wizard creates a report containing one or more charts. If you need to display data geographically, the Map Wizard is for you. Should you want a blank slate to add report parts to manually, you can create a blank report.
For this simple over, use the Table or Matrix Wizard. To create a report in this manner, perform the following steps:
1. Select the Table or Matrix Wizard, as shown in Figure 22-26.
2. On the next screen of the wizard, shown in Figure 22-27, you are asked what dataset you want to use to populate your new report. To define where you want to get the data from, you need to define the data source, as shown in Figure 22-28.

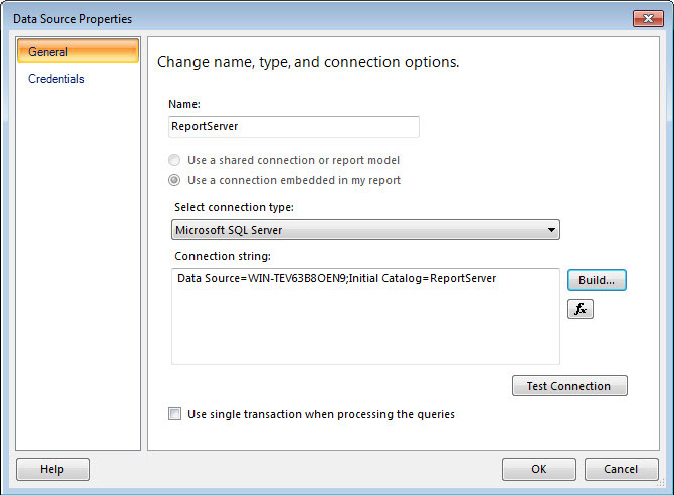
3. Start by giving the data source a descriptive name. Because this report gets its data from the reporting services event log, call it ReportServer. You can leave the connection type at the default of SQL Server; be aware though you can create reports from a wide variety of data sources.
4. Next define the connection string. To make it easy, you can click the Build button to bring up a dialog that lets you pick the server, username, and database name all from drop-downs.
5. For this report, pick the server where you installed the Reporting Services ReportServer database, and use the ReportServer database as the source. It’s always a good idea to test the connection by clicking the Test Connection button. When complete, your dialog should resemble the one shown in Figure 22-28. Click OK to move to the next stage.
6. You are now asked what connection you want to use for the new data source. The data connection you just created should appear in the list; select it and click Next.
7. The next screen in the dialog, as shown in Figure 22-29, provides an easy way for end users to drill down into the available tables and views and select the columns they want to appear on the report. This is a great option for those unaccustomed to writing SQL. As a DBA you don’t have that limitation, so instead you can use the query you created in the previous section on the execution log. If you saved the query, you may simply click the Import button and pick the .SQL file you saved the query to. If not, you can paste or type it in. (Refer to Listing 22-1 for the query).

8. After entering the query, it is a good idea to run it, just to validate that there were no typos or other errors. To test, simply click the red exclamation mark at the top of the dialog. Figure 22-30 shows the dialog with the query entered and tested. If the results look correct, click Next to continue.

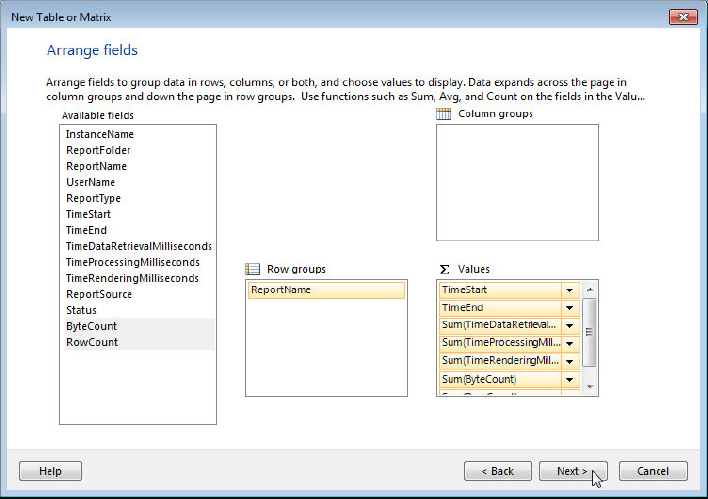
9. Next you are asked to arrange the fields in the order you want them. After selecting the fields to display on the report, you can group them by rows and columns. A common need for this report might be to group by instance name. Or, you may want to group by the report name, as you do in this example.
10. Drag the ReportName field into the area box Row groups. Next, drag TimeStart, TimeEnd, TimeDataRetrievalMilliseconds, TimeProcessingMilliseconds, TimeRenderingMilliseconds, ByteCount, and RowCount fields into the Values box. You are not required to use every field in your data source; for example, you can leave the other fields in the Available box. When your screen resembles the one shown in Figure 22-31, click Next.
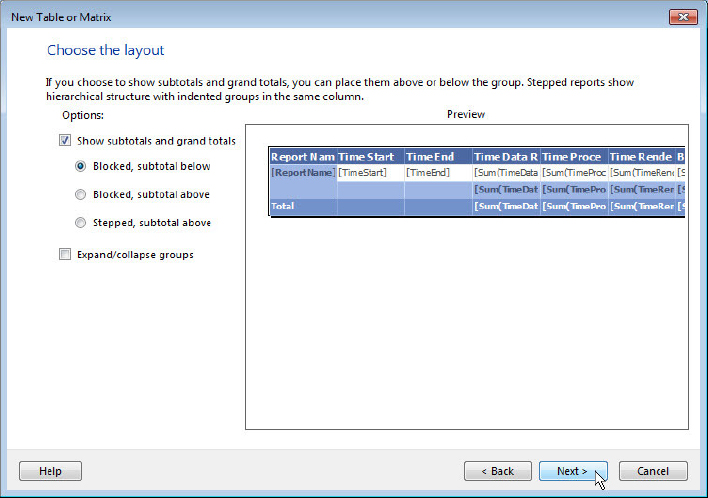
11. You are now asked how you want the report to be laid out (see Figure 22-32). You can choose to have totals, and if so you can indicate where you want them displayed. You can also allow the user to interact with the report by expanding and collapsing row and column groups. For this report, seeing the total execution time for a report might be useful, so leave the subtotals and grand totals displayed. There probably won’t be much use in having expanding/collapsing groups, so uncheck that option and continue.
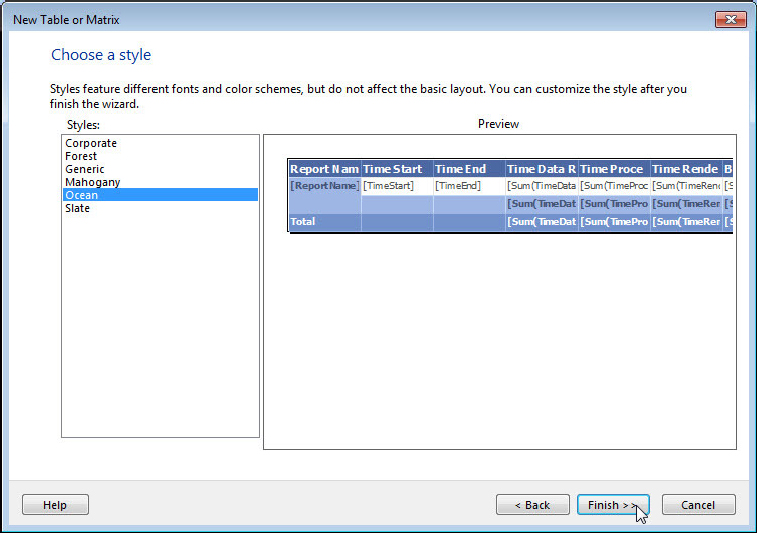
12. The final step in the wizard gives you the opportunity to stylize the report. The styles, shown in the left column on Figure 22-33, apply certain colorations and fonts to the report. If you don’t want any special style, pick the Generic option for plain black text on a white background. For this report use the default of Ocean, but you can select one of the other colors if you want. When you have a color you like, click Finish to generate the report.
Now that the report has been generated, take just a moment to look around Report Builder. Figure 22-34 shows the generated report inside the Report Builder application.

Across the top is the toolbar. There are three tabs: Home, Insert, and View. The Home toolbar enables you to adjust basic things such as fonts, borders, formatting numbers, and the like. The Insert tab enables you to add additional components to the report. You can add data-driven items such as charts and graphs, tables, static items such as text boxes and lines, and subreports and report parts. The View tab is simple; it acts as a place to toggle the display of various areas of the Report Builder application. You can hide or display the ruler across the top, as well as the Row and Column groups at the bottom. You can also hide the Report Data area to the left.
In the Report Data area, you can add images, new data sources, or grab fields that you didn’t originally put on the report. You can also add parameters, so users can narrow down the data they want to see, as well as access built-in fields such as the page number or report run time.
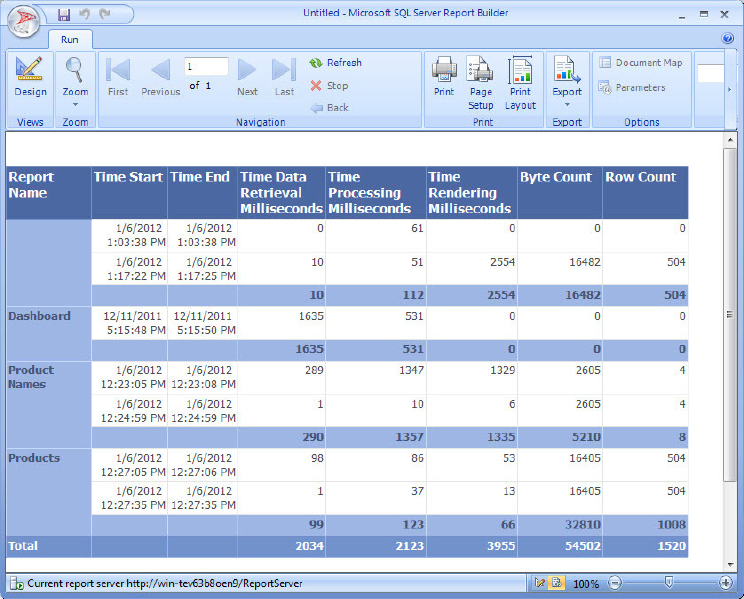
Now that the report is completed, you can test it before deploying it to your server. On the Home tab, click the Run button. The report executes, and you should see results similar to those in Figure 22-35. (If you didn’t run Report Builder as an administrator, this is where you would see the insufficient rights error.)
Assuming everything went well, you should now save your hard work. Clicking the Save icon in the upper-left corner of Report Builder opens your save dialog. From here, you can either save to the local hard drive or to the Reporting Services server.
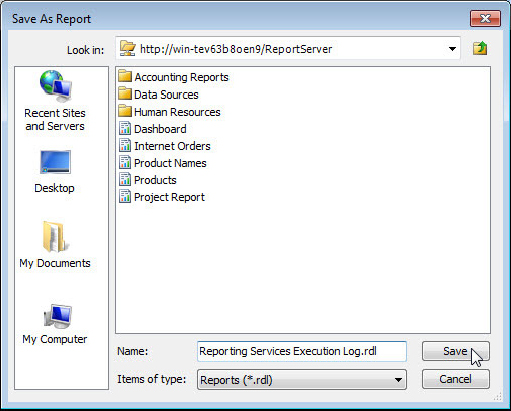
To save to the server, use the web services URL as described in the section, “Reporting Services Configuration Manager.” Give the report a good name; for this example use Reporting Services Execution Log.rdl, as shown in Figure 22-36.
Report Builder is a powerful tool; you just scratched the surface of what it can do. For more information on Report Builder, see John Wiley’s Professional SQL Server 2012 Reporting Services (Turley et al., 2012). Explore its capabilities; it can be a useful tool to you as a DBA. With it you can create reports to diagnose the health of the server and have those reports generated and sent to you every day, as you see in the next section on Report Manager.
In the previous section you learned how to use Report Builder to generate reports. After a report generates, it is ready to be passed to SQL Server Reporting Services so it can be managed. You need to use the Report Manager tool to do this.
The Report Manager is a web interface that both IT professionals and end users can use to manage and execute their collection of reports. You get to the Report Manager by opening Internet Explorer (or similar web browser) and going to the URL specified on the Report Manager URL page of the Reporting Services Configuration Manager. From here you can do a lot, but specifically you can perform three main types of tasks:
- From within SQL Server Data Tools you can organize reports into report projects. You can then deploy these reports from within SQL Server Data Tools to the Reporting Services server via the web services URL designated in the Reporting Services Configuration Manager.
- As described in the previous section, you can save reports from Report Builder directly to the Reporting Services server via the web service URL.
- Report Manager has the capability to upload a report to it from a disc drive.
As mentioned earlier, SQL Server Data Tools is too big a subject to cover here. In the previous section you saw how to save a report from Report Builder; in this section you take a look at uploading and managing a report within Report Manager. Before that though, you need to see how to manage Report Manager.
Managing Report Manager
Report Manager has the same quirk as Report Builder; for all the features to work correctly, you must run it in administrator mode. Just as you did with Report Builder, find the Internet Explorer icon on your Start menu, right-click it, and select Run as Administrator.
When IE is open, navigate to the Report Manager URL. Your screen should be similar to the one shown in Figure 22-37; although, don’t be alarmed if it doesn’t match exactly. The Figure examples in this section have a few extra reports and folders for demo purposes, in addition to the Reporting Services Execution Log you created in the previous section on Report Builder.

The Navigation Menu
In the upper-right corner of Figure 22-37 is a navigation menu. The Home option brings you back to the home page, as shown in Figure 22-37. My Subscriptions brings users to their private report storage area. If My Subscriptions is turned off, this does not appear to the users.
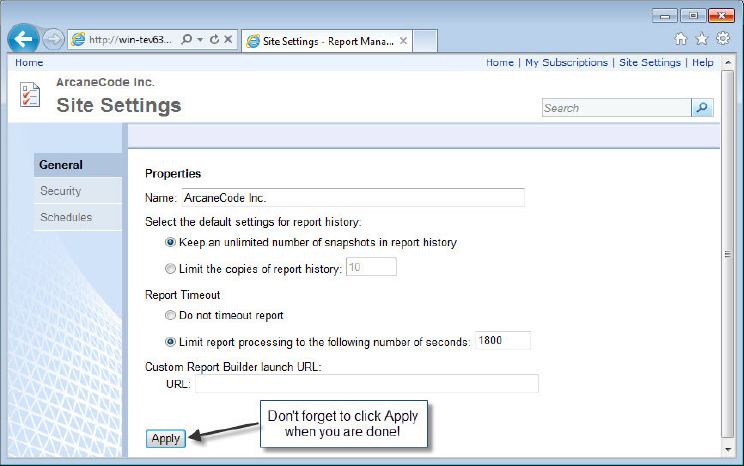
The Site Settings menu option is for SSRS administrators only and is not visible to anyone but designated admins. The available settings, as shown in Figure 22-38, are a subset of the properties you can set from within SQL Server Management Studio. (See the section “Report Server Properties” for more information.) The Help option provides some basic help for the Report Manager.

In the Site Settings, you should change the server name to something appropriate for your environment, if you have not done so already. Typically, this is the name of your company, but it may also be a departmental name. For test or development servers, it’s a good practice to show that in the name of the server.
After you change the name of your server, or any of the other properties, you must click the Apply button, as shown in Figure 22-39. This is true not only for this page, but also for all the pages in Report Manager. Anywhere you make a change, you must click the Apply button, or your changes will be lost.
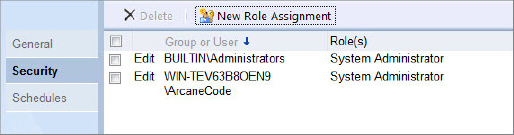
So far you’ve been looking at the General page of Site Settings, as indicated by the page menu on the left. Under it is another important page, Security. Through it you can add or edit users (or groups of users). In the screen snippet shown in Figure 22-40, you can see the two users listed for this server and the roles they have.
To add a new user, simply click the New Role Assignment button. A new page displays (see Figure 22-41); start by entering the Active Directory user or group name, and then check the role they should have. Choose from the two following User options:
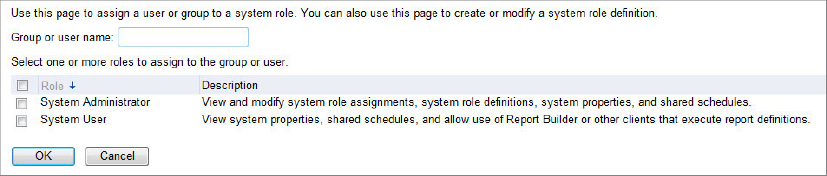
- System User role: This is fairly straightforward. It allows the designated users to see but not alter system properties and shared schedules. They are also allowed to launch Report Builder.
- System Administrator: This should be given out only with careful thought. System Administrators can change any of the properties, add/remove users, reports, and so on. This role should be reserved for DBAs or similar IT Professionals.
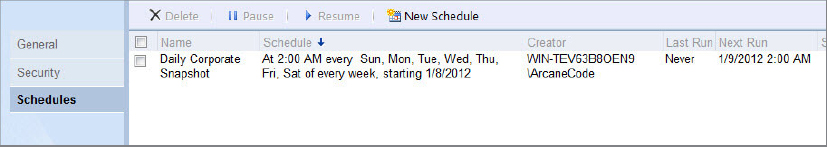
The Schedules page is used to establish a shared schedule for capturing snapshots of reports. Say you have three reports that have important financial information about the company. These reports may run several times a day, independent of each other.
For auditing purposes you need to run all three reports at the same time every day and store a snapshot of these. To accomplish this, you can first set up a shared schedule. Simply click the New Schedule menu option, fill out what time of day to run, what days to run, and when to start and optionally stop running the report and save it. Figure 22-42 shows one schedule named Daily Corporate Snapshot. Remember this as you see where to use this later in the chapter.
The Task Menu
Returning to the home screen (refer to Figure 22-37) there is a more prominent task menu across the screen. Starting from the left is the New Folder option. Report Manager enables reports to be organized into logical folders, similar to the way folders are used on a hard drive. When you move into a folder, the second line in the title will be updated to show the current folder name.
Figure 22-43 reflects the new name of your SSRS server and shows that you have moved into the Accounting Reports folder. This example also lets the user know there are no reports in the folder, a much better option than showing nothing and making the user wonder.

Next to the New Folder menu option is New Data Source. When you created your report in Report Builder, you started by building a data set. In creating that data set, the first thing you were asked was the data source. For your report you created the source and stored it within the report.
You had the option to use a shared data source. You can create a shared data source through the New Data Source option in Report Manager. Then you simply point to it from Report Builder.
Shared data sources make management much easier. If you have a group of reports that all connect to the same database, and that database is moved to a new server, the connection has to be updated only once, rather than for each report. Shared data sources also facilitate report development. You can set up a testing SSRS server, on which the data source points to a test database. When the report has passed all its tests, it can be uploaded to the production server that has a shared data source with the same name, but pointing to the production database. No update to the report would be required.
Setting up a data source, although straightforward, does require some knowledge about how SSRS works and how your reports will be used. As Figure 22-44 shows, you should start things by giving your data source a descriptive name. You can add an optional description to add clarity.
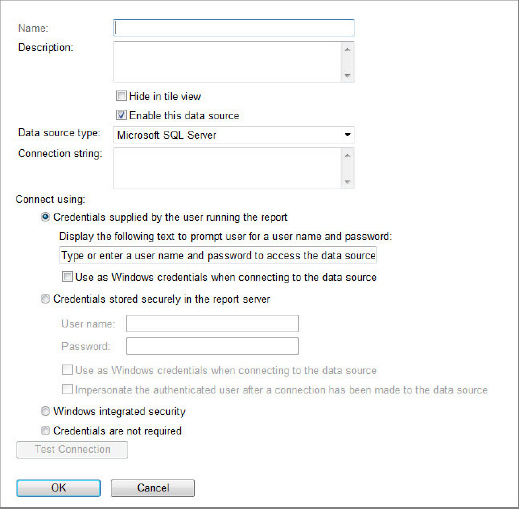
The home screen (refer to Figure 22-37), is displayed in Tile Mode. This is the mode most users use to interact with Report Manager. (There is a second mode, Details View, which is covered later.) You can suppress the display of a data source by checking Hide in Tile View, and it is common to do so. This reduces the number of items in Report Manager, therefore increasing simplicity for the users.
Moving down the page, you next see the Enable This Data Source option. As its name implies, you can disable and re-enable this data source from use.
The data source type is the next option. SSRS can access a rich set of data sources beyond SQL Server. SQL Server Analysis Services, SQL Azure, OLE DB, and Oracle are just a few of the many sources available to SSRS.
The connection string can vary by the data source type. For SQL Server, it takes the form of Data Source= followed by the name of the server. If the instance is not the default one, you also need to add the name of the SQL Server instance. That will be followed by a semicolon, Initial Catalog=, and the name of the database to get data from. Note the spaces between the words Data Source and Initial Catalog, which need to be there.
Thus, to connect to the reporting execution log for your demo test server, the connection string looks like
Data Source=WIN-TEV63B8OEN9;Initial Catalog=ReportServer
The next section, Connect Using, has four options. These have a big impact on how the report can be used on the server.
- Credentials Supplied by the User Running the Report
With this option, users are prompted each time they run the report to enter their credentials. The text of the prompt may be specified, and there is an option to use the supplied credentials as Windows credentials. Most users find having to enter their credentials each time a report is run annoying, at the very least. Thus this option is rarely used.
A good example of where it might be useful though is in a facility where large numbers of temporary works are brought in for short time periods. Setting up Active Directory accounts for all those users is not practical. This option becomes even more beneficial when the workers share a common PC, for example on a manufacturing floor production floor where maintenance is done. A handful of IDs could be created and shared among a group of workers. When maintenance people run the report, they enters a generic credential for all maintenance people, and the report displays only the data that job role is allowed to see. Likewise, a shift supervisor would see only data they are allowed, and so on.
When this method of authentication is used, the report cannot be set up for unattended execution. You see more on unattended execution in a moment.
- Credentials Stored Securely in the Report Server
With this option you must enter a specific set of credentials to run the report with. This may be SQL Server ID or an Active Directory ID. If an Active Directory ID is used you should also check the Use as Windows Credentials option.
By default the data source cannot see the Windows user as the person making the request, but rather the ID supplied here. This is good when you don’t need user-specific security around the data being accessed. If, however, you do require the data source to know who the Windows user is, you can check the final option Impersonate the Authenticated User. SSRS passes the Windows user ID through to the data source, allowing it to return data based on the user’s ID (or Active Directory group membership).
This is one of the two options, which enables you to run a report in unattended execution mode.
- Windows Integrated Security
With the Windows Integrated Security option, SSRS can automatically detect the Windows credentials of the user accessing SSRS and pass them along to the data source. This option cannot allow a report to be run in unattended execution mode.
- Credentials Are Not Required
There are some situations in which credentials are not required, or not even usable. A good example is a report generated from an XML file. XML has no concept of authentication. This mode enables unattended execution.
There are two basic methods for executing a report. With the first method, the report is executed on demand by a user. Commonly it is done via Report Manager, but it may also occur with reports launched from an application, such as an ASP.Net website. In this situation, Reporting Services knows who the user is and can pass their credentials to the data source. Refer to this mode as attended execution.
In the second method, it is SQL Server Report Services that launches the report. This occurs when a report is scheduled to be run or a snapshot is due to be created on a specific schedule. Thus the name unattended execution mode.
In this light the connection methods make sense. To run unattended, the credentials for the data source must be stored on the server or must not be required.
After you fill out all the information, be sure to click OK to save the shared Data Source.
You can set these same options for an individual report. You see where to do that in the next section; however, the connection options are identical for both shared and report specific data sources.
The third item in the task menu is Report Builder. This launches Report Builder for the user, and if Report Builder has not yet been installed, it installs it as well. See the “Report Builder” section earlier in this chapter for more information on how to use Report Builder.
The Folder Settings task enables you to set security for the current folder. The operation is similar to the site settings you saw in Figures 23-40 and 23-41, but specific to the current folder and by default any subfolders. The security options are slightly different though, as shown in Figure 22-45.

Microsoft did a great job on the screen shown in Figure 22-45, spelling out what rights each role has; thus they don’t need much more explanation. A user may have more than one role, as needed. As with most security, it’s best to start out with the most minimal right, Browser, and increase privileges as need.
In addition to saving reports directly to the server, Report Builder also enables you to save reports to a hard drive. This is a great option for reports that were built to run once and then discarded.
Some companies have tight security settings around their report servers. Users who want to develop reports must save them locally and then send the completed report (in the form of an RDL file) to IT where it can be validated.
To get the file into Report Manager, the Upload File task is used. It brings up a simple web page where a user can upload a report. When updating an existing report, the uploader must also check the Overwrite check box. This is a safety mechanism so that existing reports won’t be overwritten accidentally.
In the section on defining a data source, you saw an option Hide in Tile View (refer to Figure 22-44). Although tile view is the most common way to look at reports, there is another option, Details view, which can be accessed by picking the last option in the task menu, appropriately named Details View, as shown in Figure 22-46.

Details view provides additional information, such as the last run date for the report, the last modified date, and who did the modification. It also lists all objects in this folder, which might be hidden. This is how you can get to an item you may have hidden previously.
In addition, two more menu options appear in the task bar on the left: Delete and Move. When you check one or more of the objects, these buttons will be enabled, allowing you permanently delete the selected items or move them to another folder within the same Report Manager site.
So far you’ve seen how to manage the Report Manager, as well as manage the folders, data sources, and reports that reside in Report Manager. In the next section you see how to manage a report.
Managing Reports
Whether you are in Tile or Detail view, you begin by hovering over any report. A yellow border surrounds the report, and a yellow drop-down button appears on the right. Clicking that button opens up the report management menu, as shown in Figure 22-47.
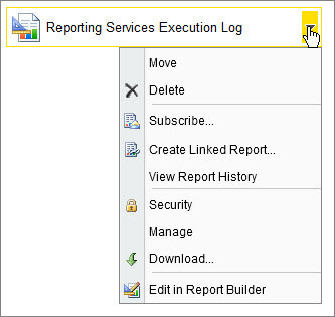
Some of the options are self-explanatory. Move and Delete behave like they do in detail view. Download enables you to save the report or data source to your hard drive. Edit in Report Builder launches Report Builder and loads the selected report for you, ready to edit.
The main way to manage a report is through the Manage web pages, which you see in a moment. Subscribe, View Report History, and Security are shortcuts to pages contained in the Manage web pages; you look at those in context of the Manage pages.
The last option is Create Linked Report. This is analogous to a shortcut within Windows. It creates a clone of the entry for the report, but not the report itself. You can then change all the properties (which you’ll see momentarily) in the Manage web pages. Thus you run the same report with two different sets of parameters, schedules, snapshots, and the like.
Creating a linked report is easy. After clicking the menu option, all you need to tell it is what you want the link to be named, and what folder you want to put it in. It defaults to the current folder, but you can change it if you want. From there you can alter any of the properties in the Manage area, as you see next.
Properties
When you open the Manage web page, you are greeted with the Properties page, as shown in Figure 22-48. By now you should be familiar with most of these properties and commands, having seen them in other places. The only new one here is Replace, which is just a shortcut to the Upload command. The only difference is Upload lacks the Overwrite if Exists check box. SSRS assumes if you are at this point, it’s a safe assumption you want to overwrite, so it doesn’t bother to ask.
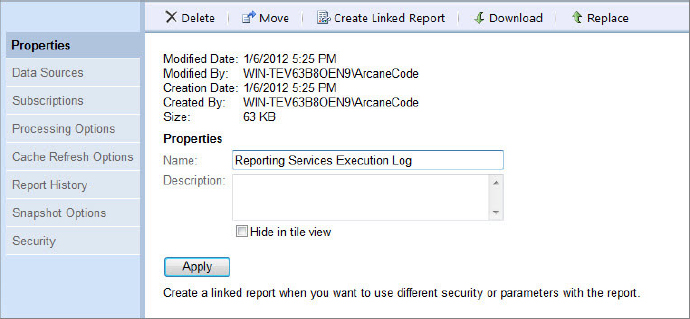
With all the pages in the Manage area, be sure to click the Apply button when you finish. If you move to another page within Manage web pages without pressing Apply first, you will lose your changes.
Data Sources
The next page in the Manage area enables you to set the Data Sources, as shown in Figure 22-49. At the top, you can select a shared data source. (See the previous section for more information on setting up a Shared Data Source.) When you pick that option, it enables the Browse button; it is then a simple matter to navigate the folder structure and pick the data source you previously set up.

Alternatively, as shown in Figure 22-49, you can establish a data source specific to this report. When you do, the options behave identically to the shared data source.
When the execution log report was saved from Report Builder, it used Windows integrated security as the default data source. To schedule this report, you needed to use a credential that allowed for unattended execution. Hence it was changed to store the credentials securely on the server.
Whenever you make changes it is always a good idea to test, so be sure to take advantage of the Test Connection button.
Subscriptions
Subscriptions are a useful tool in SSRS; they enable reports to be generated and delivered to the users without their intervention. This is an ideal solution for long running reports, or when a report will be run on a regular basis, such as daily.
When entering the Subscriptions page for the first time, there won’t be any subscriptions listed. You have two choices to create a subscription: New Subscription and New Data-Driven Subscription.
New Subscription
New subscriptions are run on a timed basis. When you select this option, you will be asked what delivery method you want, and when you want it to run (see Figure 22-50).

Assuming you set up an e-mail address in the Reporting Services Configuration Manager’s E-mail page, you can choose between two delivery methods: E-Mail and Windows File Share. Figure 22-50 shows the E-Mail option and gives you the chance to set basic details about the mail: what format should the report be in, who should it go to, and more. The Windows File Share is similar; in it you set the path to save to, the format of the report, and the credentials used to access the file share.
On the lower half of the New Subscription page, you specify when you want the report to run. The first option enables you to set a custom schedule for this specific report. The second option enables you to use a shared schedule. Shared schedules are set up in the Site Settings area, as discussed earlier in this chapter in the “Managing the Report Manager — The Navigation Menu” section.
New Data-Driven Subscription
The second option is data-driven subscriptions. This is a bit misleading because the data referred to is not the source data. Rather it is data used to set options around the report at the time it is run. Who gets the report, how should it be delivered, and what format should it be in are examples of report execution options that can be pulled from data.
Before you can create a data-driven subscription, you must first create a table to hold the data you need. There is no set format for the table; the number of columns, column names, and sizes are all up to you.
Perform the following steps to create a table:
1. First create a simple table to hold data that could be used to drive either e-mail or output to a Windows file path. Listing 22-2 lists the T-SQL for the table. Where you store the table is up to you. In this example a new database was created called ReportSubscriptions.
LISTING 22-2: Create a Table to Hold Subscription Information
CREATE TABLE [dbo].[SubscriptionInfo] (
      [SubscriptionInfoID] [int] NOT NULL PRIMARY KEY
    , [SubscriberName] [nvarchar] (50) NOT NULL
    , [EmailAddress] [nvarchar] (256) NOT NULL
    , [Path] [nvarchar] (256) NOT NULL
    , [FileName] [nvarchar] (256) NOT NULL
    , [Format] [nvarchar] (20) NOT NULL
    , [Comment] [nvarchar] (256) NOT NULL
    , [ReportNameFilter] [nvarchar] (200) NOT NULL
) ON [PRIMARY]
GO
2. Next, put some data in the table. That’s what the code in Listing 22-3 accomplishes.
LISTING 22-3: Load Subscriptions to the SubscriptionInfo Table
INSERT INTO [dbo].[SubscriptionInfo]
       ( [SubscriptionInfoID]
       , [SubscriberName]
       , [EmailAddress]
       , [Path]
       , [FileName]
       , [Format]
       , [Comment]
       , [ReportNameFilter]
       )
VALUES (   '1'
         , 'Brian Knight'
         , '[email protected]'
         , 'WIN-TEV63B8OEN9FileShare'
         , 'Brians File'
         , 'IMAGE'
         , 'Hi Brian, here is your report.'
         , 'Reporting Services Execution Log')
     , (   '2'
         , 'Adam Jorgensen'
         , '[email protected]'
         , 'WIN-TEV63B8OEN9FileShare'
         , 'Adams Data'
         , 'MHTML'
         , 'Greetings Adam, here is your report'
         , 'Reporting Services Execution Log'
       )
     , (   '3'
         , 'Robert Cain'
         , '[email protected]'
         , 'WIN-TEV63B8OEN9FileShare'
         , 'Roberts Stuff'
         , 'PDF'
         , 'Hi Mom!'
         , 'Reporting Services Execution Log'
       );
Now that you have data to work with, you can set up a data-driven subscription. On the subscriptions page select the New Data-Driven Subscription option. Now walk through a series of steps needed to set up the subscription.
1. The first step is illustrated in Figure 22-51. After giving your subscription a name, you are asked about your delivery option; you can pick from e-mail or a Windows File Share. In the previous section on regular nondata-driven subscriptions, you used e-mail, so for this example use Windows File Share. The final option is to indicate the data source.

2. Because in the previous step the data source select was for this report only, you are now prompted for connection information, as shown in Figure 22-52. If you select a shared data source, this step would instead give you the chance to select an existing shared data source.
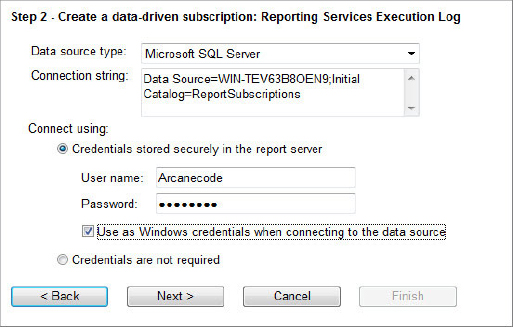
One annoyance: Each time performing this step, you must fill out the password. It won’t retain it, so if you return to edit this subscription later, be sure to have the password.
3. Now provide the appropriate SQL query to apply to the database specified in the previous step (see Figure 22-53). In addition to the query, you can override the default different time-out if you have a long running query. Finally, you should always use the Validate button to ensure the SQL query you entered is valid.
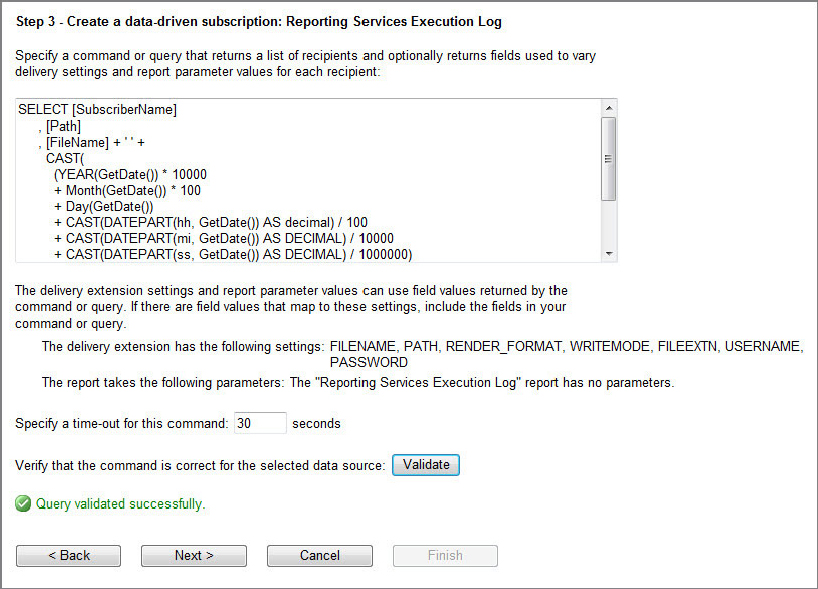
Because the screen is not big enough to see the full query, it is displayed here in Listing 22-4. When you run this query it returns the following information on the file share: where to put the output file, which filename to use, and what format the file should be in. Some date math is appended to the end of the filename. You typically want some mechanism to avoid duplicate files trying to be created in the target file share. The code in Listing 22-4 appends a number to the end of the filename in YYYYMMDD.HHMISS format. For example, 20121221.011221 would be 12 minutes and 21 seconds after one a.m. on the 21st of December, 2012.
LISTING 22-4: Query for a Data-Driven Subscription
SELECT [SubscriberName]
     , [Path]
     , [FileName] + ' ' +
       CAST(
         (YEAR(GetDate()) * 10000
         + Month(GetDate()) * 100
         + Day(GetDate())
         + CAST(DATEPART(hh, GetDate()) AS decimal) / 100
         + CAST(DATEPART(mi, GetDate()) AS DECIMAL) / 10000
         + CAST(DATEPART(ss, GetDate()) AS DECIMAL) / 1000000)
       AS nvarchar(20)) AS [FileName]
     , [Format]
     , [Comment]
  FROM [dbo].SubscriptionInfo
 WHERE [ReportNameFilter] = 'Reporting Services Execution Log'
Incorporating the date into the file name is just one method of creating unique file names. You might also use a GUID, or have another process update the subscription table to have a new filename each time. Finally, you might have a separate process that removes all files in the share prior to the time the report is scheduled to run.
4. Next you need to supply information specific to the output method you selected. Figure 22-54 shows the screen for your selected Windows file share output. Values can be supplied from static text, as you can see with the file share ID and password. They may also be mapped from the query you ran in Step 3. The filename, path, and render format have all been mapped from the query (refer to Figure 22-54). Finally, you can decide to supply no value at all, as done with the write mode and file extension.

The path must be in UNC naming format: \SERVERNAME\FILESHARENAME. In this example the UNC path to your file share (stored in the table, refer to Listing 22-3) was \WIN-TEV63BOEN9FileShare. If you had picked e-mail as your delivery option, then this step would have fields oriented toward sending e-mails. It would map the same way as you did with the file share in Figure 22-54.
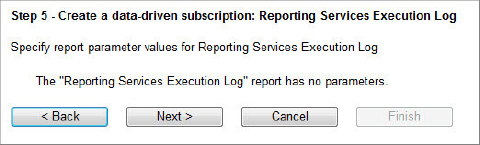
5. If you had put any parameters on your report, now is the time to map values from your SQL query to the report parameters. This can be an effective manner in which to reuse reports multiple ways.
For example, a report could be created for each manager that would list the employees and total number of hours worked for the week. In the subscription table for that report, the manager’s name, e-mail address, and department name could be stored. The data-driven subscription could map the department name to a parameter in the report, so only people in that department are on the instance of the report being e-mailed to the associated manager.
However, for the Report Execution Log report you created, there were no parameters. Figure 22-55 shows you that and allows you to move on to the next step.
6. Next you specify when the report should execute (see Figure 22-56). The first option, When the Report Data Is Updated on the Server, is just as it implies. SSRS monitors the report data for updates and fires when it sees changes. This is useful when you have data updated on a limited, infrequent basis on an unpredictable schedule.
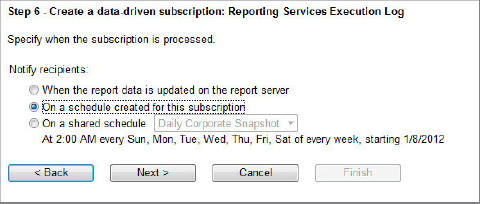
The other two options set the report to run on a time schedule. The lower option enables you to reuse an existing schedule (see the information on Site Settings in the “Navigation Menu” section earlier in this chapter). When either the first or last option is selected, the Finish button is enabled, and you are done.
If you select the middle option, you have one more step where you must set up the schedule for this subscription.
7. In the final step of setting up a data-driven subscription, you simply need to supply the information on when and how often the report should execute. Figure 22-57 shows there is a lot of flexibility when configuring the schedule.
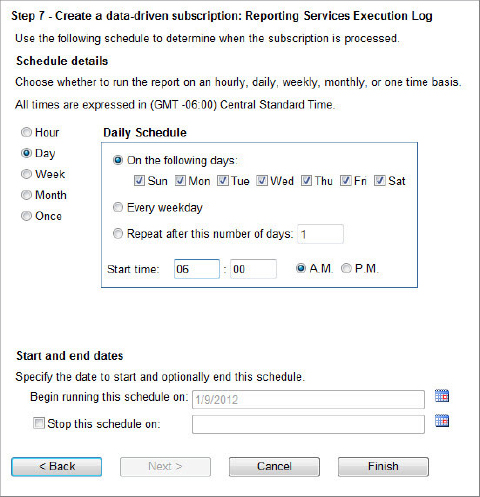
That was a lot of effort but well worth it. Data-driven subscriptions can be valuable when you need to run the same report many times, each time with different values for the parameters and processing options. Figure 22-58 shows the listing of existing subscriptions.

Processing Options
Figure 22-59 shows you a lot of different processing options, but they can be summarized as a choice between caching and snapshots. The report cache is for storing temporary copies of the report, whereas the snapshots can be retained for a specified duration. Users can see previous snapshots of reports, whereas cached reports are lost forever when they expire.

Of course, you can elect not to cache or snapshot reports at all, as the first option in Figure 22-59 shows. When you choose to neither cache nor snapshot the report, each time a user executes the report SSRS makes a call to the database to get the report data.
With the cache options, when a user runs a report, SSRS first checks to see if it is in the cache. If so, it returns the report from the cache instead of going to the source database. If not, it executes the report and adds it to the cache. The difference in the two options is simply when the cache expires: either after a set time or on a specific schedule.
The second option shown in Figure 22-59 enables the report to be rendered from a snapshot. As mentioned earlier, snapshots are copies of the report and its associated data that is stored long term. With this option you may also set a schedule for snapshots to be generated.
The final option enables you to override the standard settings for report timeouts for this specific report.
Cache Refresh Options
A report can get into the report cache in two ways. The first was discussed briefly in the previous section: processing options. When a report is run, if it is marked for caching but is not in the cache, it is executed and then added to the cache.
The second way is to set up a cache refresh plan, as shown in Figure 22-60. When you set up a new refresh plan, you are taken to a simple web page where you are asked if you want to create a specific schedule or reuse an existing one.
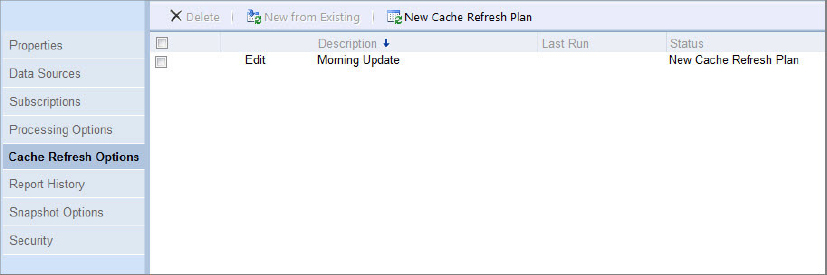
Using a cache refresh plan is a good way to ensure the reports in the cache stay fresh, while at the same time reducing the amount of time users must wait for the report.
Report History
This section talked about snapshots and the capability of SSRS to store copies of a report as it executes. To view past snapshots of a report, use the Report History screen, as shown in Figure 22-61.
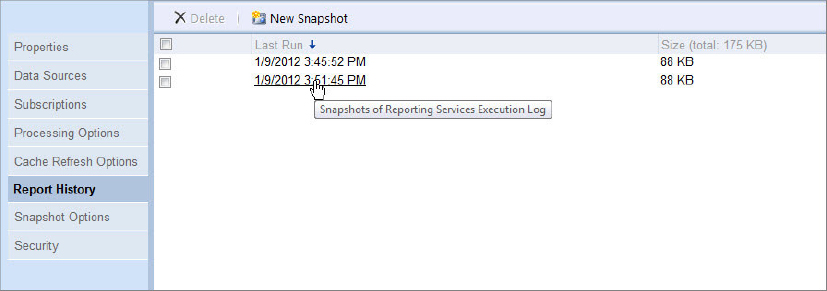
The Report History provides a listing of every snapshot of the report. To view one, simply click the last run date/time (refer to Figure 22-61). You also have the option to generate a new snapshot by clicking the New Snapshot button. This causes the report to execute immediately and be stored as a snapshot.
Snapshot Options
When you use snapshots you must manage them. Through the Snapshot Options, as shown in Figure 22-62, you can establish a schedule for automatically creating new snapshots. You can also determine how many snapshots should be retained.

Security
Security is the final section of the Manage web pages. This enables you to fine-tune access for this specific report. The dialog and actions are identical to those for the folders, as seen in Figure 22-40.
SQL Server Reporting Services offers a rich toolset around managing both the server and the reports it contains. The Reporting Services Configuration Manager enables you to configure critical options such as the databases SSRS needs to do its job, encryption keys, URLs, and more.
Using the properties settings in SQL Server Management Studio, you can fine-tune your instance of Reporting Services. Properties such as execution timeouts, logging, history, and security are set via SQL Server Management Studio.
Report Builder provides an easy-to-understand yet full-featured way to create the reports you’ll house in SSRS. It can even be useful to you, the DBA, in creating reports from SQL Server management data, such as the SSRS execution log.
Report Manager is the tool of choice for managing and executing your reports. You can configure reports to run on schedules and be placed into a cache for reuse. You can also store and track them as snapshots.
With the understanding acquired here, the DBA will be well equipped to manage Reporting Services.