
10
Tools and Techniques
All of the tools and techniques in this section appear in alphabetical order; therefore, no sections numbers are assigned.
Active listening. Techniques that involve acknowledging, clarifying and confirming, understanding, and removing barriers that adversely affect comprehension. Active listening is used to reduce misunderstandings and other miscommunications.
Advertising. Communications with users or potential users of a product, service, or result. Existing lists of potential sellers often can be expanded by placing advertisements in general circulation publications such as selected newspapers or in specialty trade publications. Most government jurisdictions require public advertising or online posting of pending government contracts.
Affinity diagrams. A technique that allows large numbers of ideas to be classified into groups for review and analysis. Affinity diagrams can also organize potential causes of defects into groups showing the areas that should be focused on the most.
Agile release planning. Agile release planning provides a high-level summary time line of the release schedule (typically 3 to 6 months) based on the product roadmap and the product vision for the product's evolution. Agile release planning determines the number of iterations or sprints in the release. It also allows the product owner and team to decide how much needs to be developed and how long it will take to have a releasable product based on business goals, dependencies, and impediments.
Since features represent value to the customer, the time line provides a more easily understood project schedule as it defines which features will be available at the end of each iteration, which is exactly the depth of information the customer is looking for.
Figure 10-1 shows the relationship among product vision, product roadmap, release planning, and iteration planning.

Figure 10-1. Relationship between Product Vision, Release Planning, and Iteration Planning
Alternatives analysis. Used to evaluate identified options in order to select the options or approaches to use to execute and perform project work. Alternatives analysis assists in providing the best solution to perform project activities, within the defined constraints.
Analogous estimating. Analogous estimating is a technique for estimating the duration or cost of an activity or a project using historical data from a similar activity or project. Analogous estimating uses parameters from a previous, similar project, such as duration, budget, size, weight, and complexity, as the basis for estimating the same parameter or measure for a future project. When estimating durations, this technique relies on the actual duration of previous, similar projects as the basis for estimating the duration of the current project. It is a gross value estimating approach, sometimes adjusted for known differences in project complexity. Analogous duration estimating is frequently used to estimate project duration when there is a limited amount of detailed information about the project.
Analogous estimating is generally less costly and less time-consuming than other techniques, but it is also less accurate. Analogous duration estimates can be applied to a total project or to segments of a project and may be used in conjunction with other estimating methods. Analogous estimating is most reliable when the previous activities are similar in fact and not just in appearance, and the project team members preparing the estimates have the needed expertise.
Assessment of other risk parameters. A project team may consider other characteristics of risk (in addition to probability and impact) when prioritizing individual project risks for further analysis and action. These characteristics may include but are not limited to:
▶Urgency. The period of time within which a response to the risk is to be implemented in order to be effective. A short period indicates high urgency.
▶Proximity. The period of time before the risk might have an impact on one or more project objectives. A short period indicates high proximity.
▶Dormancy. The period of time that may elapse after a risk has occurred before its impact is discovered. A short period indicates low dormancy.
▶Manageability. The ease with which the risk owner (or owning organization) can manage the occurrence or impact of a risk. Where management is easy, manageability is high.
▶Controllability. The degree to which the risk owner (or owning organization) is able to control the risk's outcome. Where the outcome can be easily controlled, controllability is high.
▶Detectability. The ease with which the results of the risk occurring, or being about to occur, can be detected and recognized. Where the risk occurrence can be detected easily, detectability is high.
▶Connectivity. The extent to which the risk is related to other individual project risks. Where a risk is connected to many other risks, connectivity is high.
▶Strategic impact. The potential for the risk to have a positive or negative effect on the organization's strategic goals. Where the risk has a major effect on strategic goals, strategic impact is high.
▶Propinquity. The degree to which a risk is perceived to matter by one or more stakeholders. Where a risk is perceived as very significant, propinquity is high.
The consideration of some of these characteristics can provide a more robust prioritization of risks than is possible by only assessing probability and impact.
Assumption and constraint analysis. Every project and its project management plan are conceived and developed based on a set of assumptions and within a series of constraints. These are often already incorporated in the scope baseline and project estimates. Assumption and constraint analysis explores the validity of assumptions and constraints to determine which pose a risk to the project. Threats may be identified from the inaccuracy, instability, inconsistency, or incompleteness of assumptions. Constraints may give rise to opportunities through removing or relaxing a limiting factor that affects the execution of a project or process.
Audits. An audit is a structured, independent process used to determine if project activities comply with organizational and project policies, processes, and procedures.
▶Procurement audits. Audits are a structured review of the procurement process, which includes the review of contracts and contracting processes for completeness, accuracy, and effectiveness. Rights and obligations related to audits should be described in the procurement contract. Resulting audit observations should be brought to the attention of the buyer's project manager and the seller's project manager for adjustments to the project, when necessary.
▶Quality audits. A quality audit is usually conducted by a team external to the project, such as the organization's internal audit department, project management office (PMO), or by an auditor external to the organization. Quality audit objectives may include but are not limited to:
![]() Identifying all good and best practices being implemented;
Identifying all good and best practices being implemented;
![]() Identifying all nonconformities, gaps, and shortcomings;
Identifying all nonconformities, gaps, and shortcomings;
![]() Sharing good practices introduced or implemented in similar projects in the organization and/or industry;
Sharing good practices introduced or implemented in similar projects in the organization and/or industry;
![]() Proactively offering assistance in a positive manner to improve the implementation of processes to help raise team productivity;
Proactively offering assistance in a positive manner to improve the implementation of processes to help raise team productivity;
![]() Highlighting contributions of each audit in the lessons learned repository of the organization;
Highlighting contributions of each audit in the lessons learned repository of the organization;
![]() Subsequent efforts to correct any deficiencies should result in a reduced cost of quality and an increase in sponsor or customer acceptance of the project's product.
Subsequent efforts to correct any deficiencies should result in a reduced cost of quality and an increase in sponsor or customer acceptance of the project's product.
![]() Quality audits may be scheduled or random, and may be conducted by internal or external auditors; and
Quality audits may be scheduled or random, and may be conducted by internal or external auditors; and
![]() Quality audits can confirm the implementation of approved change requests including updates, corrective actions, defect repairs, and preventive actions.
Quality audits can confirm the implementation of approved change requests including updates, corrective actions, defect repairs, and preventive actions.
▶Risk audits. Risk audits are a type of audit that may be used to consider the effectiveness of the risk management process. The project manager is responsible for ensuring that risk audits are performed at an appropriate frequency, as defined in the project's risk management plan. Risk audits may be included during routine project review meetings or may form part of a risk review meeting, or the team may choose to hold separate risk audit meetings. The format for the risk audit and its objectives should be clearly defined before the audit is conducted.
Autocratic decision making. In this decision-making technique, one individual takes responsibility for making the decision for the entire group.
Benchmarking. Benchmarking involves comparing actual or planned project practices or the project's quality standards to those of comparable projects to identify best practices, generate ideas for improvement, and provide a basis for measuring performance. Benchmarked projects may exist within the performing organization or outside of it; or can be within the same application area or other application area. Benchmarking allows analogies to be made for projects in different application areas or different industries.
Bidder conferences. Bidder conferences (also called contractor conferences, vendor conferences, and pre-bid conferences) are meetings between the buyer and prospective sellers prior to proposal submittal. They are used to ensure that all prospective bidders have a clear and common understanding of the procurement and no bidders receive preferential treatment.
Bottom-up estimating. Bottom-up estimating is a method of estimating project duration or cost by aggregating the estimates of the lower-level components of the work breakdown structure (WBS). When an activity's duration cannot be estimated with a reasonable degree of confidence, the work within the activity is decomposed into more detail. The detail durations are estimated. These estimates are then aggregated into a total quantity for each of the activity's durations. Activities may or may not have dependencies between them that can affect the application and use of resources. If there are dependencies, this pattern of resource usage is reflected and documented in the estimated requirements of the activity.
Brainstorming. This technique is used to identify a list of ideas in a short period of time. It is conducted in a group environment and is led by a facilitator. Brainstorming comprises two parts: idea generation and analysis. Brainstorming can be used to gather data and solutions or ideas from stakeholders, subject matter experts, and team members.
Cause-and-effect diagrams. Cause-and-effect diagrams are also known as fishbone diagrams, why-why diagrams, or Ishikawa diagrams. This type of diagram breaks down the causes of the problem statement identified into discrete branches, helping to identify the main or root cause of the problem. Figure 10-2 is an example of a cause-and-effect diagram.

Figure 10-2. Cause-and-Effect Diagram
Change control tools. Manual or automated tools to assist with change and/or configuration management. At a minimum, the tools should support the activities of the change control board (CCB).
In order to facilitate configuration and change management, manual or automated tools may be used. Configuration control is focused on the specification of both the deliverables and the processes, while change control is focused on identifying, documenting, and approving or rejecting changes to the project documents, deliverables, or baselines. Tool selection should be based on the needs of the project stakeholders, including organizational and environmental considerations and/or constraints.
Checklists. A checklist is a list of items, actions, or points to be considered. It is often used as a reminder. Checklists are developed based on historical information and knowledge that has been accumulated from similar projects and from other sources of information. They are an effective way to capture lessons learned from similar completed projects, listing specific individual project risks that have occurred previously and that may be relevant to this project. The organization may maintain checklists based on its own completed projects or may use generic checklists from the industry. While a checklist may be quick and simple to use, it is impossible to build an exhaustive one. The project team should also explore items that do not appear on the checklist. Additionally, the checklist should be reviewed from time to time to update new information as well as remove or archive obsolete information.
Check sheets. Check sheets are also known as tally sheets. They are used to organize facts in a way that facilitates the effective collection of useful data about a potential quality problem. They are especially useful for gathering attributes data while performing inspections to identify defects; for example, data about the frequencies or consequences of defects collected. See Figure 10-3.

Figure 10-3. Check Sheets
Claims administration. Claims administration is the process of processing, adjudicating, and communicating contract claims. Contested changes and potential constructive changes are those requested changes where the buyer and seller cannot reach an agreement on compensation for the change or cannot agree that a change has occurred. These contested changes are called claims. When they cannot be resolved, they become disputes and, finally, appeals. Claims are documented, processed, monitored, and managed throughout the contract life cycle, usually in accordance with the terms of the contract. If the parties themselves do not resolve a claim, it may have to be handled in accordance with alternative dispute resolution (ADR) typically following procedures established in the contract. Settlement of all claims and disputes through negotiation is the preferred method.
Colocation. An organizational placement strategy where the project team members are physically located close to one another in order to improve communication, working relationships, and productivity.
Colocation involves placing many or all of the most active project team members in the same physical location to enhance their ability to perform as a team. Colocation can be temporary, such as at strategically important times during the project, or can continue for the entire project. Colocation strategies can include a team meeting room, common places to post schedules, and other conveniences that enhance communication and a sense of community.
Communication competence. A combination of tailored communication skills that considers factors such as clarity of purpose in key messages, effective relationships and information sharing, and leadership behaviors.
Communication methods. A systematic procedure, technique, or process used to transfer information among project stakeholders.
There are several communication methods that are used to share information among project stakeholders. These methods are broadly classified as follows:
▶Interactive communication. Interactive communication takes place between two or more parties who are performing a multidirectional exchange of information in real time. It employs communications artifacts such as meetings, phone calls, instant messaging, some forms of social media, and videoconferencing.
▶Push communication. Push communications are sent or distributed directly to specific recipients who need to receive the information. This ensures that the information is distributed but does not ensure that it reached or was understood by the intended audience. Push communication artifacts include letters, memos, reports, emails, faxes, voice mails, blogs, and press releases.
▶Pull communication. A pull communication is used for large complex information sets or for large audiences, and requires the recipients to access content at their own discretion subject to security procedures. These methods include web portals, intranet sites, eLearning, lessons learned databases, or knowledge repositories.
Different approaches should be applied to meet the needs of the major forms of communication defined in the communications management plan:
▶Interpersonal communication. Information that is exchanged between individuals, typically face to face.
▶Small group communication. Communications that occur within groups of three to six people.
▶Public communication. A public communication occurs when a single speaker is addressing a group of people.
▶Mass communication. Mass communication is an approach with a minimal connection between the person or group sending the message and the large, sometimes anonymous, groups for whom the information is intended.
▶Networks and social computing communication. This type of approach supports emerging communication trends of many-to-many supported by social computing technology and media.
Possible communications artifacts and methods include but are not limited to:
▶Notice boards,
▶Newsletters/in-house magazines/e-magazines,
▶Letters to staff/volunteers,
▶Press releases,
▶Annual reports,
▶Emails and intranets,
▶Web portals and other information repositories (for pull communication),
▶Phone conversations,
▶Presentations,
▶Team briefings/group meetings,
▶Focus groups,
▶Face-to-face formal or informal meetings between various stakeholders,
▶Consultation groups or staff forums, and
▶Social computing technology and media.
Communication models. A description, analogy, or schematic used to represent how the communication process will be performed for the project.
Communication models can represent the communication process in its most basic linear form (sender and receiver), in a more interactive form that encompasses the additional element of feedback (sender, receiver, and feedback), or in a more complex model that incorporates the human elements of the sender(s) or receiver(s) and attempts to show the complexity of any communication that involves people.
▶Sample basic sender/receiver communication model. This model describes communication as a process and consists of two parties, defined as the sender and receiver. This model is concerned with ensuring that the message is delivered rather than understood. The sequence of steps in a basic communication model is:
![]() Encode. The message is coded into symbols, such as text, sound, or some other medium, for transmission (sending).
Encode. The message is coded into symbols, such as text, sound, or some other medium, for transmission (sending).
![]() Transmit message. The message is sent via a communication channel. The transmission of this message may be compromised by various physical factors such as unfamiliar technology or inadequate infrastructure. Noise and other factors may be present and contribute to loss of information in transmission and/or reception of the message.
Transmit message. The message is sent via a communication channel. The transmission of this message may be compromised by various physical factors such as unfamiliar technology or inadequate infrastructure. Noise and other factors may be present and contribute to loss of information in transmission and/or reception of the message.
![]() Decode. The data received is translated by the receiver back into a form useful to the receiver.
Decode. The data received is translated by the receiver back into a form useful to the receiver.
▶Sample interactive communication model. This model also describes communication as a process consisting of two parties, the sender and receiver, but recognizes the need to ensure that the message has been understood. In this model, noise includes any interference or barriers that might compromise the understanding of the message, such as the distraction of the receiver, variations in the perceptions of receivers, or lack of appropriate knowledge or interest. The additional steps in an interactive communication model are:
![]() Acknowledge. Upon receipt of a message, the receiver may signal (acknowledge) receipt of the message, but this does not necessarily mean agreement with or comprehension of the message—merely that it has been received.
Acknowledge. Upon receipt of a message, the receiver may signal (acknowledge) receipt of the message, but this does not necessarily mean agreement with or comprehension of the message—merely that it has been received.
![]() Feedback/response. When the received message has been decoded and understood, the receiver encodes thoughts and ideas into a message and then transmits this message to the original sender. If the sender perceives that the feedback matches the original message, the communication has been successful. In communication between people, feedback can be achieved through active listening.
Feedback/response. When the received message has been decoded and understood, the receiver encodes thoughts and ideas into a message and then transmits this message to the original sender. If the sender perceives that the feedback matches the original message, the communication has been successful. In communication between people, feedback can be achieved through active listening.
As part of the communication process, the sender is responsible for the transmission of the message, ensuring the information being communicated is clear and complete, and confirming the message is correctly interpreted. The receiver is responsible for ensuring that the information is received in its entirety, interpreted correctly, and acknowledged or responded to appropriately. These components take place in an environment where there will likely be noise and other barriers to effective communication.
Cross-cultural communication presents challenges to ensuring that the meaning of the message has been understood. Differences in communication styles can arise from differences in working methods, age, nationality, professional discipline, ethnicity, race, or gender. People from different cultures communicate using different languages (e.g., technical design documents, different styles) and expect different processes and protocols.
The communication model shown in Figure 10-4 incorporates the idea that the message itself, and how it is transmitted, is influenced by the sender's current emotional state, knowledge, background, personality, culture, and biases. Similarly, the receiver's emotional state, knowledge, background, personality, culture, and biases will influence how the message is received and interpreted, and will contribute to the barriers or noise.
This communication model and its enhancements can assist in developing communication strategies and plans for person-to-person or even small-group-to-small-group communications. It is not useful for other communications artifacts such as emails, broadcast messages, or social media.

Figure 10-4. Communication Model for Cross-Cultural Communication
Communication requirements analysis. An analytical technique to determine the information needs of the project stakeholders through interviews, workshops, study of lessons learned from previous projects, etc. Analysis of communication requirements determines the information needs of the project stakeholders. These requirements are defined by combining the type and format of information needed with an analysis of the value of that information.
Sources of information typically used to identify and define project communication requirements include but are not limited to:
▶Stakeholder information and communication requirements from within the stakeholder register and stakeholder engagement plan;
▶Number of potential communication channels or paths, including one-to-one, one-to-many, and many-to-many communications;
▶Organizational charts;
▶Project organization and stakeholder responsibilities, relationships, and interdependencies;
▶Development approach;
▶Disciplines, departments, and specialties involved in the project;
▶Logistics of how many persons will be involved with the project and at which locations;
▶Internal information needs (e.g., when communicating within organizations);
▶External information needs (e.g., when communicating with the media, public, or contractors); and
▶Legal requirements.
Communication styles assessment. A technique used to assess communication styles and identify the preferred communication method, format, and content for planned communication activities. Often used with unsupportive stakeholders, this assessment may follow a stakeholder engagement assessment to identify gaps in stakeholder engagement that require additional tailored communication activities and artifacts.
Communication technology. Specific tools, systems, computer programs, etc., used to transfer information among project stakeholders.
The methods used to transfer information among project stakeholders may vary significantly. Common methods used for information exchange and collaboration include conversations, meetings, written documents, databases, social media, and websites.
Factors that can affect the choice of communication technology include:
▶Urgency of the need for information. The urgency, frequency, and format of the information to be communicated may vary from project to project and within different phases of a project.
▶Availability and reliability of technology. The technology that is required for distribution of project communications artifacts should be compatible, available, and accessible for all stakeholders throughout the project.
▶Ease of use. The choice of communication technologies should be suitable for project participants and proper training events should be planned, where appropriate.
▶Project environment. Factors to consider are:
![]() Will the team meet and operate on a face-to-face basis or in a virtual environment?
Will the team meet and operate on a face-to-face basis or in a virtual environment?
![]() Will the team be located in one or multiple time zones?
Will the team be located in one or multiple time zones?
![]() Will the team use multiple languages for communication?
Will the team use multiple languages for communication?
![]() Are there any other project environmental factors, such as various aspects of culture, which may constrain the efficiency of the communication?
Are there any other project environmental factors, such as various aspects of culture, which may constrain the efficiency of the communication?
▶Sensitivity and confidentiality of the information. Some aspects to consider are:
![]() Will the information to be communicated be sensitive or confidential? If so, additional security measures may be required.
Will the information to be communicated be sensitive or confidential? If so, additional security measures may be required.
![]() Does the organization have social media policies for employees to ensure appropriate behavior, security, and the protection of proprietary information?
Does the organization have social media policies for employees to ensure appropriate behavior, security, and the protection of proprietary information?
Conflict management. Conflict is inevitable in a project environment. Sources of conflict include scarce resources, scheduling priorities, and personal work styles. Team ground rules, group norms, and solid project management practices, such as communication planning and role definition, reduce the amount of conflict.
Successful conflict management results in greater productivity and positive working relationships. When managed properly, differences of opinion can lead to increased creativity and better decision making. If the differences become a negative factor, project team members are initially responsible for their resolution. If conflict escalates, the project manager should help facilitate a satisfactory resolution. Conflict should be addressed early and usually in private, using a direct, collaborative approach. If disruptive conflict continues, formal procedures may be used, including disciplinary actions.
The success of project managers in managing their project teams often depends on their ability to resolve conflict. Different project managers may use different conflict resolution methods. Factors that influence conflict resolution methods include:
▶Importance and intensity of the conflict,
▶Time pressure for resolving the conflict,
▶Relative power of the people involved in the conflict,
▶Importance of maintaining a good relationship, and
▶Motivation to resolve conflict on a long-term or short-term basis.
There are five general techniques for resolving conflict. Each technique has its place and use:
▶Withdraw/avoid. Retreating from an actual or potential conflict situation; postponing the issue to be better prepared or to be resolved by others.
▶Smooth/accommodate. Emphasizing areas of agreement rather than areas of difference; conceding one's position to the needs of others to maintain harmony and relationships.
▶Compromise/reconcile. Searching for solutions that bring some degree of satisfaction to all parties in order to temporarily or partially resolve the conflict. This approach occasionally results in a lose-lose situation.
▶Force/direct. Pushing one's viewpoint at the expense of others; offering only win-lose solutions, usually enforced through a power position to resolve an emergency. This approach often results in a win-lose situation.
▶Collaborate/problem solve. Incorporating multiple viewpoints and insights from differing perspectives; requires a cooperative attitude and open dialogue that typically leads to consensus and commitment. This approach can result in a win-win situation.
Context diagram. A visual depiction of the product scope showing a business system (process, equipment, computer system, etc.), and how people and other systems (actors) interact with it. The context diagram is an example of a scope model. Context diagrams show inputs to the business system, the actor(s) providing the input, the outputs from the business system, and the actor(s) receiving the output.
Contingent response strategies. There are five alternative strategies that may be considered for dealing with opportunities, as follows:
▶Escalate. This risk response strategy is appropriate when the project team or the project sponsor agrees that an opportunity is outside the scope of the project or that the proposed response would exceed the project manager's authority. Escalated opportunities are managed at the program level, portfolio level, or other relevant part of the organization, but not on the project level. The project manager determines who should be notified about the opportunity and communicates the details to that person or part of the organization. It is important that ownership of escalated opportunities is accepted by the relevant party in the organization. Opportunities are usually escalated to the level that matches the objectives that would be affected if the opportunity occurred. Escalated opportunities are not monitored further by the project team after escalation, although they may be recorded in the risk register for information.
▶Exploit. The exploit strategy may be selected for high-priority opportunities where the organization wants to ensure that the opportunity is realized. This strategy seeks to capture the benefit associated with a particular opportunity by ensuring that it definitely happens, increasing the probability of occurrence to 100%. Examples of exploiting responses may include assigning an organization's most talented resources to the project to reduce the time to completion or using new technologies or technology upgrades to reduce cost and duration.
▶Share. Sharing involves transferring ownership of an opportunity to a third party so that it shares some of the benefit if the opportunity occurs. It is important to select the new owner of a shared opportunity carefully, so they are best able to capture the opportunity for the benefit of the project. Risk sharing often involves payment of a risk premium to the party taking on the opportunity. Examples of sharing actions include forming risk-sharing partnerships, teams, special-purpose companies, or joint ventures.
▶Enhance. The enhance strategy is used to increase the probability and/or impact of an opportunity. Early enhancement action is often more effective than trying to improve the benefit after the opportunity has occurred. The probability of occurrence of an opportunity may be increased by focusing attention on its causes. Where it is not possible to increase probability, an enhancement response might increase the impact by targeting factors that drive the size of the potential benefit. Examples of enhancing opportunities include adding more resources to an activity to finish early.
▶Accept. Accepting an opportunity acknowledges its existence but no proactive action is taken. This strategy may be appropriate for low-priority opportunities, and it may also be adopted where it is not possible or cost-effective to address an opportunity in any other way. Acceptance can be either active or passive. The most common active acceptance strategy is to establish a contingency reserve, including amounts of time, money, or resources to take advantage of the opportunity if it occurs. Passive acceptance involves no proactive action apart from periodic review of the opportunity to ensure that it does not change significantly.
Control charts. Control charts are used to determine whether or not a process is stable or has predictable performance. Upper and lower specification limits are based on the requirements and reflect the maximum and minimum values allowed. Upper and lower control limits are different from specification limits. The control limits are determined using standard statistical calculations and principles to ultimately establish the natural capability for a stable process. The project manager and appropriate stakeholders may use the statistically calculated control limits to identify the points at which corrective action will be taken to prevent performance that remains outside the control limits. Control charts can be used to monitor various types of output variables. Although used most frequently to track repetitive activities required for producing manufactured lots, control charts may also be used to monitor cost and schedule variances, volume, frequency of scope changes, or other management results to help determine if the project management processes are in control.
Cost aggregation. Cost estimates are aggregated by work packages in accordance with the work breakdown structure (WBS). The work package cost estimates are then aggregated for the higher component levels of the WBS (such as control accounts) and, ultimately, for the entire project.
Cost-benefit analysis. A financial analysis tool used to determine the benefits provided by a project against its costs. A cost-benefit analysis is used to estimate the strengths and weaknesses of alternatives in order to determine the best alternative in terms of benefits provided. A cost-benefit analysis will help the project manager determine if project activities are cost effective. A cost-benefit analysis compares the cost of an activity to the expected benefit.
Cost of quality. The cost of quality (COQ) associated with a project consists of one or more of the following costs (Figure 10-5 lists examples for each cost group):
▶Prevention costs. Costs related to the prevention of poor quality in products, deliverables, or services of the specific project.
▶Appraisal costs. Costs related to evaluating, measuring, auditing, and testing products, deliverables, or services of a specific project.
▶Failure costs (internal/external). Costs related to nonconformance of products, deliverables, or services based on the needs or expectations of the stakeholders.
The optimal COQ is one that reflects the appropriate balance for investing in the cost of prevention and appraisal to avoid failure costs. Models show that there is an optimal quality cost for projects, where investing in additional prevention/appraisal costs is neither beneficial nor cost effective.
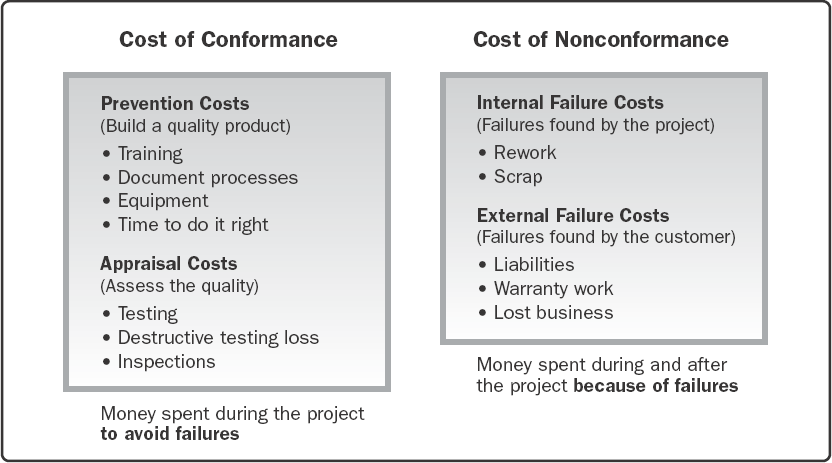
Figure 10-5. Cost of Quality
Critical path method. The critical path method is used to estimate the minimum project duration and determine the amount of schedule flexibility on the logical network paths within the schedule model. This schedule network analysis technique calculates the early start, early finish, late start, and late finish dates for all activities without regard for any resource limitations by performing a forward and backward pass analysis through the schedule network, as shown in Figure 10-6. In this example, the longest path includes activities A, C, and D, and therefore, the sequence of A-C-D is the critical path. The critical path is the sequence of activities that represents the longest path through a project, which determines the shortest possible project duration. The longest path has the least total float—usually zero. The resulting early and late start and finish dates are not necessarily the project schedule; rather they indicate the time periods within which the activity could be executed, using the parameters entered in the schedule model for activity durations, logical relationships, leads, lags, and other known constraints. The critical path method is used to calculate the critical path(s) and the amount of total and free float or schedule flexibility on the logical network paths within the schedule model.

Figure 10-6. Example of Critical Path Method
On any network path, the total float or schedule flexibility is measured by the amount of time that a schedule activity can be delayed or extended from its early start date without delaying the project finish date or violating a schedule constraint. A critical path is normally characterized by zero total float on the critical path. As implemented with the precedence diagramming method sequencing, critical paths may have positive, zero, or negative total float depending on the constraints applied. Positive total float is caused when the backward pass is calculated from a schedule constraint that is later than the early finish date that has been calculated during forward pass calculation. Negative total float is caused when a constraint on the late dates is violated by duration and logic. Negative float analysis is a technique that helps to find possible accelerated ways of bringing a delayed schedule back on track. Schedule networks may have multiple near-critical paths. Many software packages allow the user to define the parameters used to determine the critical path(s). Adjustments to activity durations (when more resources or less scope can be arranged), logical relationships (when the relationships were discretionary to begin with), leads and lags, or other schedule constraints may be necessary to produce network paths with a zero or positive total float. Once the total float and the free float have been calculated, the free float is the amount of time that a schedule activity can be delayed without delaying the early start date of any successor or violating a schedule constraint. For example, the free float for Activity B, in Figure 10-6, is 5 days.
Cultural awareness. Cultural awareness is an understanding of the differences between individuals, groups, and organizations and adapting the project's communication strategy in the context of these differences. This awareness and any consequent actions minimize misunderstandings and miscommunication that may result from cultural differences within the project's stakeholder community. Cultural awareness and cultural sensitivity help the project manager to plan communications based on the cultural differences and requirements of stakeholders and team members.
Decision making. Decision-making techniques include but are not limited to:
▶Voting. Voting is a collective decision-making technique and an assessment process having multiple alternatives with an expected outcome in the form of future actions. These techniques can be used to generate, classify, and prioritize product requirements. Examples of voting techniques include:
![]() Unanimity. A decision that is reached whereby everyone agrees on a single course of action.
Unanimity. A decision that is reached whereby everyone agrees on a single course of action.
![]() Majority. A decision that is reached with support obtained from more than 50% of the members of the group. Having a group size with an uneven number of participants can ensure that a decision will be reached rather than resulting in a tie.
Majority. A decision that is reached with support obtained from more than 50% of the members of the group. Having a group size with an uneven number of participants can ensure that a decision will be reached rather than resulting in a tie.
![]() Plurality. A decision that is reached whereby the largest block in a group decides, even if a majority is not achieved. This method is generally used when the number of options nominated is more than two.
Plurality. A decision that is reached whereby the largest block in a group decides, even if a majority is not achieved. This method is generally used when the number of options nominated is more than two.
▶Autocratic decision making. In this method, one individual takes responsibility for making the decision for the group.
▶Multicriteria decision analysis. A technique that uses a decision matrix to provide a systematic analytical approach for establishing criteria, such as risk levels, uncertainty, and valuation, to evaluate and rank many ideas.
Decision Tree Analysis. Decision tree analysis is a diagramming and calculation technique for evaluating the implications of a chain of multiple options in the presence of uncertainty. Decision trees are used to support selection of the best of several alternative courses of action. Alternative paths through the project are shown in the decision tree using branches representing different decisions or events, each of which can have associated costs and related individual project risks (including both threats and opportunities). The end points of branches in the decision tree represent the outcome from following that particular path, which can be negative or positive.
A decision tree is evaluated by calculating the expected monetary value of each branch, allowing the optimal path to be selected. An example of a decision tree is shown in Figure 10-7.
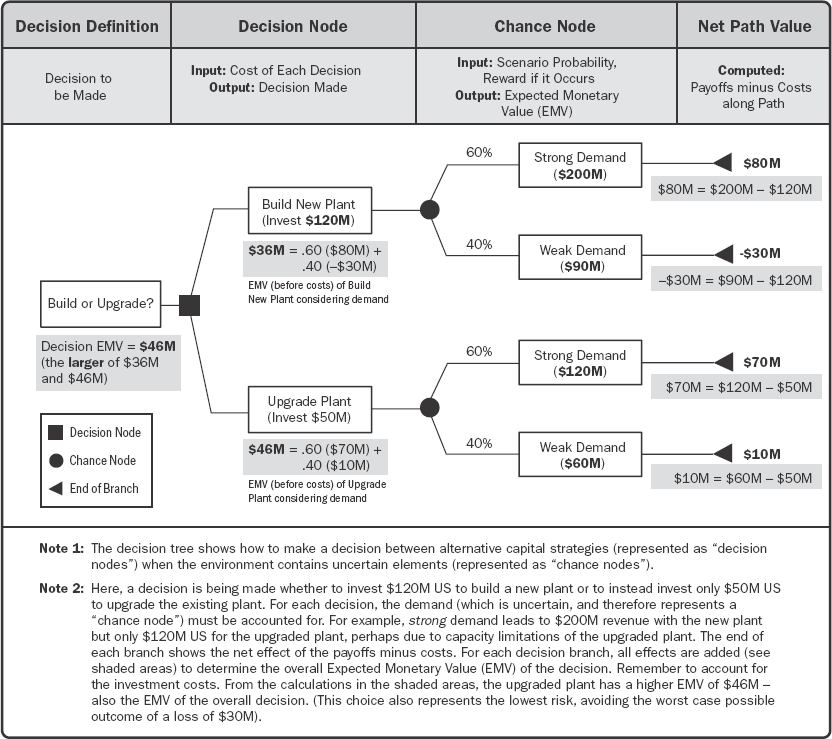
Figure 10-7. Example Decision Tree
Decomposition. A technique used for dividing and subdividing the project scope and project deliverables into smaller, more manageable parts. The work package is the work defined at the lowest level of the work breakdown structure (WBS) for which cost and duration can be estimated and managed. The level of decomposition is often guided by the degree of control needed to effectively manage the project. The level of detail for work packages varies depending on the size and complexity of the project. Decomposition of the total project work into work packages generally involves the following activities:
▶Identifying and analyzing the deliverables and related work,
▶Structuring and organizing the WBS,
▶Decomposing the upper WBS levels into lower-level detailed components,
▶Developing and assigning identification codes to the WBS components, and
▶Verifying that the degree of decomposition of the deliverables is appropriate.
A portion of a WBS with some branches of the WBS decomposed down through the work package level is shown in Figure 10-8.

Figure 10-8. Sample WBS Decomposed Down through Work Packages
A WBS structure may be created through various approaches. Some of the popular methods include the top-down approach, the use of organization-specific guidelines, and the use of WBS templates. A bottom-up approach can be used to group subcomponents. The WBS structure can be represented in various forms, such as:
▶Using phases of the project life cycle as the second level of decomposition, with the product and project deliverables inserted at the third level, as shown in Figure 10-9;
▶Using major deliverables as the second level of decomposition, as shown in Figure 10-10; and
▶Incorporating subcomponents that may be developed by organizations outside the project team, such as contracted work. The seller then develops the supporting contract WBS as part of the contracted work.

Figure 10-9. Sample WBS Organized by Phase

Figure 10-10. Sample WBS with Major Deliverables
Decomposition of the upper-level WBS components requires subdividing the work for each of the deliverables or subcomponents into its most fundamental components, where the WBS components represent verifiable products, services, or results. If an agile approach is used, epics can be decomposed into user stories. The WBS may be structured as an outline, an organizational chart, or other method that identifies a hierarchical breakdown. Verifying the correctness of the decomposition requires determining that the lower-level WBS components are those that are necessary and sufficient for completion of the corresponding higher-level deliverables. Different deliverables can have different levels of decomposition. To arrive at a work package, the work for some deliverables needs to be decomposed only to the next level, while others need additional levels of decomposition. As the work is decomposed to greater levels of detail, the ability to plan, manage, and control the work is enhanced. However, excessive decomposition can lead to nonproductive management effort, inefficient use of resources, decreased efficiency in performing the work, and difficulty aggregating data over different levels of the WBS.
Decomposition may not be possible for a deliverable or subcomponent that will be accomplished far into the future. The project management team usually waits until the deliverable or subcomponent is agreed on, so the details of the WBS can be developed. This technique is sometimes referred to as rolling wave planning.
The WBS represents all product and project work, including the project management work. The total of the work at the lowest levels should roll up to the higher levels so that nothing is left out and no extra work is performed. This is sometimes called the 100 percent rule.
For specific information regarding the WBS, refer to the Practice Standard for Work Breakdown Structures – Second Edition [10]. This standard contains industry-specific examples of WBS templates that can be tailored to specific projects in a particular application area.
Dependency determination and integration. Dependencies may be characterized by the following attributes: mandatory or discretionary, internal or external (as described below). Dependency has four attributes, but two can be applicable at the same time in the following ways: mandatory external dependencies, mandatory internal dependencies, discretionary external dependencies, or discretionary internal dependencies.
▶Mandatory dependencies. Mandatory dependencies are those that are legally or contractually required or inherent in the nature of the work. Mandatory dependencies often involve physical limitations, such as on a construction project, where it is impossible to erect the superstructure until after the foundation has been built, or on an electronics project, where a prototype has to be built before it can be tested. Mandatory dependencies are sometimes referred to as hard logic or hard dependencies. Technical dependencies may not be mandatory. The project team determines which dependencies are mandatory during the process of sequencing the activities. Mandatory dependencies should not be confused with assigning schedule constraints in the scheduling tool.
▶Discretionary dependencies. Discretionary dependencies are sometimes referred to as preferred logic, preferential logic, or soft logic. Discretionary dependencies are established based on knowledge of best practices within a particular application area or some unusual aspect of the project where a specific sequence is desired, even though there may be other acceptable sequences. For example, generally accepted best practices recommend that during construction, the electrical work should start after finishing the plumbing work. This order is not mandatory and both activities may occur at the same time (in parallel); however, performing the activities in sequential order reduces the overall project risk. Discretionary dependencies should be fully documented since they can create arbitrary total float values and can limit later scheduling options. When fast-tracking techniques are employed, these discretionary dependencies should be reviewed and considered for modification or removal. The project team determines which dependencies are discretionary during the process of sequencing the activities.
▶External dependencies. External dependencies involve a relationship between project activities and non-project activities. These dependencies are usually outside of the project team's control. For example, the testing activity in a software project may be dependent on the delivery of hardware from an external source, or governmental environmental hearings may need to be held before site preparation can begin on a construction project. The project management team determines which dependencies are external during the process of sequencing the activities.
▶Internal dependencies. Internal dependencies involve a precedence relationship between project activities and are generally inside the project team's control. For example, if the team cannot test a machine until they assemble it, there is an internal mandatory dependency. The project management team determines which dependencies are internal during the process of sequencing the activities
Design for X. Design for X (DfX) is a set of technical guidelines that may be applied during the design of a product for the optimization of a specific aspect of the design. DfX can control or even improve the product's final characteristics. The X in DfX can be different aspects of product development, such as reliability, deployment, assembly, manufacturing, cost, service, usability, safety, and quality. Using the DfX may result in cost reduction, quality improvement, better performance, and customer satisfaction.
Document analysis. Document analysis consists of reviewing and assessing any relevant documented information. There is a wide range of documents that may be analyzed. Examples of documents that may be analyzed include but are not limited to:
▶Agreements and contracts;
▶Business plans, processes, or interface documentation;
▶Business rules repositories;
▶Current process flows;
▶Marketing literature;
▶Plans, assumptions, constraints, historical files, and technical documentation;
▶Problem/issue logs;
▶Policies and procedures;
▶Quality reports, test reports, performance reports, and variance analysis;
▶Regulatory documentation such as laws, codes, or ordinances, etc.;
▶Requests for proposal; and
▶Use cases.
Earned value analysis. Earned value analysis compares the performance measurement baseline to the actual schedule and cost performance. EVM integrates the scope baseline with the cost baseline and schedule baseline to form the performance measurement baseline. EVM develops and monitors three key dimensions for each work package and control account:
▶Planned value. Planned value (PV) is the authorized budget assigned to scheduled work. It is the authorized budget planned for the work to be accomplished for an activity or work breakdown structure (WBS) component, not including management reserve. This budget is allocated by phase over the life of the project, but at a given point in time, PV defines the physical work that should have been accomplished. The total of the PV is sometimes referred to as the performance measurement baseline (PMB). The total PV for the project is also known as budget at completion (BAC).
▶Earned value. Earned value (EV) is a measure of work performed expressed in terms of the budget authorized for that work. It is the budget associated with the authorized work that has been completed. The EV being measured needs to be related to the PMB, and the EV measured cannot be greater than the authorized PV budget for a component. The EV is often used to calculate the percent complete of a project. Progress measurement criteria should be established for each WBS component to measure work in progress. Project managers monitor EV, both incrementally to determine current status and cumulatively to determine the long-term performance trends.
▶Actual cost. Actual cost (AC) is the realized cost incurred for the work performed on an activity during a specific time period. It is the total cost incurred in accomplishing the work that the EV measured. The AC needs to correspond in definition to what was budgeted in the PV and measured in the EV (e.g., direct hours only, direct costs only, or all costs including indirect costs). The AC will have no upper limit; whatever is spent to achieve the EV will be measured.
Emotional intelligence (EI). The ability to identify, assess, and manage the personal emotions of oneself and other people, as well as the collective emotions of groups of people. A project team can use emotional intelligence to reduce tension and increase cooperation by identifying, assessing, and controlling the sentiments of project team members, anticipating their actions, acknowledging their concerns, and following up on their issues.
A project manager should invest in personal EI by improving inbound (e.g., self-management and self-awareness) and outbound (e.g., relationship management) competencies. Research suggests that project teams that succeed in developing team EI or become an emotionally competent group are more effective. Additionally, there is a reduction in staff turnover.
Expert judgment. Judgment provided based upon expertise in an application area, discipline, industry, etc., as appropriate for the activity being performed. Such expertise may be provided by any group or person with specialized education, knowledge, skill, experience, or training.
Facilitation. Facilitation is the ability to effectively guide a group event to a successful decision, solution, or conclusion. A facilitator ensures the following:
▶There is effective participation.
▶Participants achieve a mutual understanding.
▶All contributions are considered.
▶Conclusions or results have full buy-in according to the decision process established for the project.
▶Actions and agreements that are achieved are appropriately dealt with afterward.
Feedback. Feedback is information about reactions to communications, a deliverable, or a situation. Feedback supports interactive communication between the project manager, project team, and all other project stakeholders. Examples include coaching, mentoring, and negotiating.
Financing. Financing entails acquiring funding for projects. It is common for long-term infrastructure, industrial, and public services projects to seek external sources of funds. If a project is funded externally, the funding entity may have certain requirements that are required to be met.
Flowcharts. Flowcharts are also referred to as process maps because they display the sequence of steps and the branching possibilities that exist for a process that transforms one or more inputs into one or more outputs. Flowcharts show the activities, decision points, branching loops, parallel paths, and the overall order of processing by mapping the operational details of procedures that exist within a horizontal value chain. One version of a value chain, known as a SIPOC (suppliers, inputs, process, outputs, and customers) model, is shown in Figure 10-11. Flowcharts may prove useful in understanding and estimating the cost of quality for a process. Information is obtained by using the workflow branching logic and associated relative frequencies to estimate the expected monetary value for the conformance and nonconformance work required to deliver the expected conforming output. When flowcharts are used to represent the steps in a process, they are sometimes called process flows or process flow diagrams and they can be used for process improvement as well as identifying where quality defects can occur or where to incorporate quality checks.

Figure 10-11. The SIPOC Model
Focus groups. An elicitation technique that brings together prequalified stakeholders and subject matter experts to learn about their expectations and attitudes about a proposed product, service, or result. A trained moderator guides the group through an interactive discussion designed to be more conversational than a one-on-one interview.
Funding limit reconciliation. The process of reconciling the expenditure of funds with any funding limits on the commitment of funds for the project. A variance between the funding limits and the planned expenditures will sometimes necessitate the rescheduling of work to level out the rate of expenditures. This is accomplished by placing imposed date constraints for work into the project schedule.
Ground rules. Defined in the team charter, ground rules set the expected behavior for project team members and other stakeholders with regard to stakeholder engagement.
Hierarchical charts. The traditional organizational chart structure can be used to show positions and relationships in a graphical, top-down format.
▶Work breakdown structures (WBS). The WBS is designed to show how project deliverables are broken down into work packages and provide a way of showing high-level areas of responsibility.
▶Organizational breakdown structure (OBS). While the WBS shows a breakdown of project deliverables, an OBS is arranged according to an organization's existing departments, units, or teams, with the project activities or work packages listed under each department. An operational department, such as information technology or purchasing, can see all of its project responsibilities by looking at its portion of the OBS.
▶Resource breakdown structure. The resource breakdown structure is a hierarchical list of team and physical resources related by category and resource type that is used for planning, managing, and controlling project work. Each descending (lower) level represents an increasingly detailed description of the resource until the information is small enough to be used in conjunction with the WBS to allow the work to be planned, monitored, and controlled.
Histograms. Histograms show a graphical representation of numerical data. Histograms can show the number of defects per deliverable, a ranking of the cause of defects, the number of times each process is noncompliant, or other representations of project or product defects.
Historical information review. Reviewing historical information can assist in developing parametric estimates or analogous estimates. Historical information may include project characteristics (parameters) to develop mathematical models to predict total project costs. Such models may be simple (e.g., residential home construction is based on a certain cost per square foot of space) or complex (e.g., one model of software development costing uses multiple separate adjustment factors, each of which has numerous points within it).
Both the cost and accuracy of analogous and parametric models can vary widely. They are most likely to be reliable when:
▶Historical information used to develop the model is accurate,
▶Parameters used in the model are readily quantifiable, and
▶Models are scalable, such that they work for large projects, small projects, and phases of a project.
Individual and team assessments. Individual and team assessment tools give the project manager and the project team insight into areas of strengths and weaknesses. These tools help project managers assess team members’ preferences, aspirations, how they process and organize information, how they make decisions, and how they interact with people. Various tools are available such as attitudinal surveys, specific assessments, structured interviews, ability tests, and focus groups. These tools can provide improved understanding, trust, commitment, and communications among team members and facilitate more productive teams throughout the project.
Influence diagrams. Influence diagrams are graphical aids to decision making under uncertainty. An influence diagram represents a project or situation within the project as a set of entities, outcomes, and influences, together with the relationships and effects between them. Where an element in the influence diagram is uncertain as a result of the existence of individual project risks or other sources of uncertainty, this can be represented in the influence diagram using ranges or probability distributions. The influence diagram is then evaluated using a simulation technique, such as Monte Carlo analysis, to indicate which elements have the greatest influence on key outcomes. Outputs from an influence diagram are similar to other quantitative risk analysis methods, including S-curves and tornado diagrams.
Influencing. Because project managers often have little or no direct authority over team members in a matrix environment, their ability to influence stakeholders on a timely basis is critical to project success. Key influencing skills include:
▶Ability to be persuasive,
▶Clearly articulating points and positions,
▶High levels of active and effective listening skills,
▶Awareness of, and consideration for, the various perspectives in any situation, and
▶Gathering relevant information to address issues and reach agreements while maintaining mutual trust.
Information management. Information management tools and techniques are used to create and connect people to information. They are effective for sharing simple, unambiguous, codified explicit knowledge. They include but are not limited to:
▶Methods for codifying explicit knowledge; for example, for producing lessons learned entries for the lessons learned register;
▶Lessons learned register;
▶Library services;
▶Information gathering, for example, web searches and reading published articles; and
▶Project management information system (PMIS). Project management information systems often include document management systems.
Tools and techniques that connect people to information can be enhanced by adding an element of interaction, for example, include a “contact me” function so users can get in touch with the originators of the lessons and ask for advice specific to their project and context.
Knowledge and information management tools and techniques should be connected to project processes and process owners. Communities of practice and subject matter experts (SMEs), for example, may generate insights that lead to improved control processes. Having an internal sponsor can ensure improvements are implemented. Lessons learned register entries may be analyzed to identify common issues that can be addressed by changes to project procedures.
Inspection. An inspection is the examination of a work product to determine if it conforms to documented standards. The results of inspections generally include measurements and may be conducted at any level. The results of a single activity can be inspected, or the final product of the project can be inspected. Inspections may be called reviews, peer reviews, audits, or walkthroughs. In some application areas, these terms have narrow and specific meanings. Inspections also are used to verify defect repairs.
Interviews. A formal or informal approach to elicit information from stakeholders by talking to them directly. It is typically performed by asking prepared and spontaneous questions and recording the responses. Interviews are often conducted on an individual basis between an interviewer and an interviewee but may involve multiple interviewers and/or multiple interviewees. Interviewing experienced project participants, sponsors, other executives, and subject matter experts can aid in identifying and defining the features and functions of the desired product deliverables. Interviews are also useful for obtaining confidential information.
Iteration burndown chart. This chart tracks the work that remains to be completed in the iteration backlog. It is used to analyze the variance with respect to an ideal burndown based on the work committed from iteration planning. A forecast trend line can be used to predict the likely variance at iteration completion and take appropriate actions during the course of the iteration. A diagonal line representing the ideal burndown and daily actual remaining work is then plotted. A trend line is then calculated to forecast completion based on remaining work. Figure 10-12 is an example of an iteration burndown chart.

Figure 10-12. Iteration Burndown Chart
Knowledge management. Knowledge management tools and techniques connect people so they can work together to create new knowledge, share tacit knowledge, and integrate the knowledge of diverse team members. The tools and techniques appropriate in a project depend on the nature of the project, especially the degree of innovation involved, the project complexity, and the level of diversity (including diversity of disciplines) among team members.
Tools and techniques include but are not limited to:
▶Networking, including informal social interaction and online social networking. Online forums where people can ask open questions (“What does anyone know about…?”) are useful for starting knowledge-sharing conversations with specialists;
▶Communities of practice (sometimes called communities of interest or just communities) and special interest groups;
▶Meetings, including virtual meetings where participants can interact using communications technology;
▶Work shadowing and reverse shadowing;
▶Discussion forums such as focus groups;
▶Knowledge-sharing events such as seminars and conferences;
▶Workshops, including problem-solving sessions and learning reviews designed to identify lessons learned;
▶Storytelling;
▶Creativity and ideas management techniques;
▶Knowledge fairs and cafés; and
▶Training that involves interaction between learners.
All of these tools and techniques can be applied face to face or virtually, or both. Face-to-face interaction is usually the most effective way to build the trusting relationships that are needed to manage knowledge. Once relationships are established, virtual interaction can be used to maintain the relationship.
Leadership. The knowledge, skills, and behaviors needed to guide, motivate, and direct a team to help an organization achieve its business goals. These skills may include demonstrating essential capabilities such as negotiation, resilience, communication, problem solving, critical thinking, and interpersonal skills. Projects are becoming increasingly more complicated with more and more businesses executing their strategy through projects. Project management is more than just working with numbers, templates, charts, graphs, and computing systems. A common denominator in all projects is people. People can be counted, but they are not numbers.
Leads and lags. A lead is the amount of time a successor activity can be advanced with respect to a predecessor activity. For example, on a project to construct a new office building, the landscaping could be scheduled to start 2 weeks prior to the scheduled punch list completion. This would be shown as a finish-to-start with a 2-week lead as shown in Figure 10-13. A lead is often represented as a negative value for lag in scheduling software.

Figure 10-13. Examples of Lead and Lag
A lag is the amount of time a successor activity will be delayed with respect to a predecessor activity. For example, a technical writing team may begin editing the draft of a large document 15 days after they begin writing it. This can be shown as a start-to-start relationship with a 15-day lag as shown in Figure 10-13. Lag can also be represented in project schedule network diagrams, as shown in Figure 10-14, in the relationship between activities H and I (as indicated by the nomenclature SS+10 (start-to-start plus 10 days lag) even though the offset is not shown relative to a timescale).

Figure 10-14. Project Schedule Network Diagram
The project management team determines the dependencies that may require a lead or a lag to accurately define the logical relationship. The use of leads and lags should not replace schedule logic. Also, duration estimates do not include any leads or lags. Activities and their related assumptions should be documented.
Logical data model. A logical data model is a visual representation of an organization's data, described in business language and independent of any specific technology. A logical data model can be used to identify where data integrity or other quality issues can arise.
Make-or-buy analysis. A make-or-buy analysis is used to determine whether work or deliverables can best be accomplished by the project team or should be purchased from outside sources. Factors to consider in the make-or-buy decision include the organization's current resource allocation and their skills and abilities, the need for specialized expertise, the desire to not expand permanent employment obligations, and the need for independent expertise. It also includes evaluating the risks involved with each make-or-buy decision.
A make-or-buy analysis may use payback period, return on investment (ROI), internal rate of return (IRR), discounted cash flow, net present value (NPV), benefit/cost analysis (BCA), or other techniques in order to decide whether to include something as part of the project or purchase it externally.
Market research. Market research is a data gathering technique that includes examination of industry and specific seller capabilities. Procurement teams may leverage information gained at conferences, online reviews, and a variety of sources to identify market capabilities. The team may also refine specific procurement objectives to leverage maturing technologies while balancing risks associated with the breadth of sellers who can provide the desired materials or services.
Matrix diagrams. Matrix diagrams help to find the strength of relationships among different factors, causes, and objectives that exist between the rows and columns that form the matrix. Depending on how many factors are compared, a project manager can use different shapes of matrix diagrams, for example, L, T, Y, X, C, and roof shaped. Matrix diagrams facilitate the identification of key quality metrics that are important for the success of the project.
Meeting management. An interpersonal and team skill used to ensure meetings meet their intended objectives effectively and efficiently. The following steps should be used for meeting planning:
▶Prepare and distribute the agenda stating the objectives of the meeting.
▶Ensure that the meeting starts and finishes at the published time.
▶Ensure the appropriate participants are invited and attend.
▶Stay on topic.
▶Manage expectations, issues, and conflicts during the meeting.
▶Record all actions along with the individual who has responsibility for completing the action.
Meetings. Project meetings can include virtual (e-meetings) or face-to-face meetings, and can be supported with document collaboration technologies, including email messages and project websites. Examples of meetings include but are not limited to the following:
▶Decision making,
▶Issue resolution,
▶Lessons learned and retrospectives,
▶Project kickoff,
▶Sprint planning, and
▶Status updates.
Mind mapping. Mind mapping consolidates ideas created through individual brainstorming sessions into a single map to reflect commonality and differences in understanding and to generate new ideas. Mind mapping is a diagrammatic method used to visually organize information.
Motivation. Motivation is providing a reason for someone to act. Teams are motivated by empowering them to participate in decision making and encouraging them to work independently.
Multicriteria decision analysis. This technique utilizes a decision matrix to provide a systematic analytical approach for establishing criteria, such as risk levels, uncertainty, and valuation, to evaluate and rank many ideas. Multicriteria decision analysis tools (e.g., prioritization matrix) can be used to identify the key issues and suitable alternatives to be prioritized as a set of decisions for implementation. Criteria are prioritized and weighted before being applied to all available alternatives to obtain a mathematical score for each alternative. The alternatives are then ranked by score.
Negotiation. Negotiation is a discussion aimed at reaching an agreement. Negotiation is used to achieve support or agreement that supports the work of the project or its outcomes and to resolve conflicts within the team or with other stakeholders. Negotiation among team members is used to reach consensus on project needs. Negotiation can build trust and harmony among team members.
Procurement negotiation clarifies the structure, rights, and obligations of the parties and other terms of the purchases so that mutual agreement can be reached prior to signing a contract. Final document language reflects all agreements reached. Negotiation concludes with a signed contract document or other formal agreement that can be executed by both buyer and seller.
The negotiation should be led by a member of the procurement team who has the authority to sign contracts. The project manager and other members of the project management team may be present during negotiation to provide assistance as needed.
Networking. The establishment of connections and relationships with other people from the same or other organizations for the purpose of exchanging information and developing contacts. Networks provide project managers and their teams with access to informal organizations to solve problems, influence actions of their stakeholders, and increase stakeholder support for the work and outcomes of the project, thus improving performance.
Nonverbal. Examples of nonverbal communication include appropriate body language to transmit meaning through gestures, tone of voice, and facial expressions. Mirroring and eye contact are also important techniques. The team members should be aware of how they are expressing themselves, both through what they say and what they don't say.
Nominal group technique. A technique that enhances brainstorming with a voting process used to rank the most useful ideas for further brainstorming or for prioritization. The nominal group technique is a structured form of brainstorming consisting of four steps:
▶Step 1. A question or problem is posed to the group. Each person silently generates and writes down their ideas.
▶Step 2. The moderator writes down the ideas on a flip chart until all ideas are recorded.
▶Step 3. Each recorded idea is discussed until all group members have a clear understanding.
▶Step 4. Individuals vote privately to prioritize the ideas, usually using a scale of 1 to 5, with 1 being the lowest and 5 being the highest. Voting may take place in many rounds to reduce and focus in on ideas. After each round, the moderator tallies the votes, and the highest scoring ideas are selected.
Observation/conversation. Observation and conversation provide a direct way of viewing individuals in their environment and to see how they perform their jobs or tasks and carry out processes. It is particularly helpful for detailed processes when the people who use the product have difficulty or are reluctant to articulate their requirements. Observation is also known as “job shadowing.” It is usually done externally by an observer viewing a business expert performing a job. It can also be done by a “participant observer” who performs a process or procedure to experience how it is done to uncover hidden requirements.
Organizational theory. Organizational theory provides information regarding the way in which people, teams, and organizational units behave. Effective use of common techniques identified in organizational theory can shorten the amount of time, cost, and effort needed to create the Plan Resource Management process outputs and improve planning efficiency. Applicable organizational theories may recommend exercising a flexible leadership style that adapts to the changes in a team's maturity level throughout the project life cycle. It is important to recognize that the organization's structure and culture impact the project organizational structure.
Parametric estimating. Parametric estimating is an estimating technique in which an algorithm is used to calculate cost or duration based on historical data and project parameters. Parametric estimating uses a statistical relationship between historical data and other variables (e.g., square footage in construction) to calculate an estimate for activity parameters, such as cost, budget, and duration.
Durations can be quantitatively determined by multiplying the quantity of work to be performed by the number of labor hours per unit of work. For example, duration on a design project is estimated by the number of drawings multiplied by the number of labor hours per drawing, or on a cable installation, the meters of cable multiplied by the number of labor hours per meter. If the assigned resource is capable of installing 25 meters of cable per hour, the duration required to install 1,000 meters is 40 hours (1,000 meters divided by 25 meters per hour).
This technique can produce higher levels of accuracy depending on the sophistication and underlying data built into the model. Parametric schedule estimates can be applied to a total project or to segments of a project, in conjunction with other estimating methods.
Performance reviews. Performance reviews measure, compare, and analyze actual performance of work in progress on the project against the schedule baseline, such as actual start and finish dates, percent complete, and remaining duration for work in progress.
Political awareness. Political awareness helps the project manager to plan communications based on the project environment as well as the organization's political environment. Political awareness concerns the recognition of formal and informal power relationships and the willingness to operate within these structures. Aspects of political awareness include:
▶Understanding the strategies of the organization,
▶Knowing who wields power and influence in this arena, and
▶Developing an ability to communicate with these stakeholders.
Precedence diagramming method (PDM). A technique used for constructing a schedule model in which activities are represented by nodes and are graphically linked by one or more logical relationships to show the sequence in which the activities are to be performed.
PDM includes four types of dependencies or logical relationships. A predecessor activity is an activity that logically comes before a dependent activity in a schedule. A successor activity is a dependent activity that logically comes after another activity in a schedule. These relationships are defined below and are illustrated in Figure 10-15:
▶Finish-to-start (FS). A logical relationship in which a successor activity cannot start until a predecessor activity has finished. For example, installing the operating system on a PC (successor) cannot start until the PC hardware is assembled (predecessor).
▶Finish-to-finish (FF). A logical relationship in which a successor activity cannot finish until a predecessor activity has finished. For example, writing a document (predecessor) is required to finish before editing the document (successor) can finish.
▶Start-to-start (SS). A logical relationship in which a successor activity cannot start until a predecessor activity has started. For example, leveling concrete (successor) cannot begin until pouring the foundation (predecessor) begins.
▶Start-to-finish (SF). A logical relationship in which a predecessor activity cannot finish until a successor activity has started. For example, a new accounts payable system (successor) has to start before the old accounts payable system can be shut down (predecessor).
In PDM, FS is the most commonly used type of precedence relationship. The SF relationship is very rarely used, but it is included here to present a complete list of the PDM relationship types.
Two activities can have two logical relationships at the same time (for example, SS and FF). Multiple relationships between the same activities are not recommended, so a decision has to be made to select the relationship with the highest impact. Closed loops are also not recommended in logical relationships.

Figure 10-15. Precedence Diagramming Method (PDM) Relationship Types
Presentations. A presentation is the formal delivery of information and/or documentation. Clear and effective presentations of project information to relevant stakeholders can include but are not limited to:
▶Progress reports and information updates to stakeholders;
▶Background information to support decision making;
▶General information about the project and its objectives, for the purposes of raising the profile of the work of the project and the team; and
▶Specific information aimed at increasing understanding and support of the work and objectives of the project.
Presentations will be successful when the content and delivery take the following into account:
▶Expectations and needs of the audience; and
▶Needs and objectives of the project and project team.
Prioritization/ranking. Stakeholder requirements need to be prioritized and ranked, as do the stakeholders themselves. Stakeholders with the most interest and the highest influence are often prioritized at the top of the list.
Probability and impact matrix. A probability and impact matrix is a grid for mapping the probability of each risk occurrence and its impact on project objectives if that risk occurs. This matrix specifies combinations of probability and impact that allow individual project risks to be divided into priority groups (see Figure 10-16). Risks can be prioritized for further analysis and planning of risk responses based on their probability and impacts. The probability of occurrence for each individual project risk is assessed as well as its impact on one or more project objectives if it does occur, using definitions of probability and impact for the project as specified in the risk management plan. Individual project risks are assigned to a priority level based on the combination of their assessed probability and impact, using a probability and impact matrix.
An organization can assess a risk separately for each objective (e.g., cost, time, and scope) by having a separate probability and impact matrix for each. Alternatively, it may develop ways to determine one overall priority level for each risk, either by combining assessments for different objectives, or by taking the highest priority level regardless of which objective is affected.

Figure 10-16. Example of Probability and Impact Matrix with Scoring Schemes
Problem solving. Problem solving entails finding solutions for issues or challenges. It can include gathering additional information; critical thinking; and creative, quantitative, and/or logical approaches. Effective and systematic problem solving is a fundamental element in quality assurance and quality improvement. Problems can arise as a result of the Control Quality process or from quality audits and can be associated with a process or deliverable. Using a structured problem-solving method will help eliminate the problem and develop a long-lasting solution. Problem-solving methods generally include the following actions:
▶Define the problem,
▶Identify the root cause,
▶Generate possible solutions,
▶Choose the best solution,
▶Implement the solution, and
▶Verify solution effectiveness.
Process analysis. Process analysis identifies opportunities for process improvements. This analysis also examines problems, constraints, and non-value-added activities that occur during a process.
Product analysis. Product analysis can be used to define products and services. It includes asking questions about a product or service and forming answers to describe the use, characteristics, and other relevant aspects of what is going to be manufactured or delivered.
Each application area has one or more generally accepted methods for translating high-level product or service descriptions into meaningful deliverables. Requirements are captured at a high level and decomposed to the level of detail needed to design the final product. Examples of product analysis techniques include but are not limited to:
▶Product breakdown,
▶Requirements analysis,
▶Systems analysis,
▶Systems engineering,
▶Value analysis, and
▶Value engineering.
Project management information system (PMIS). An information system consisting of the tools and techniques used to gather, integrate, and disseminate the outputs of project management processes. A PMIS provides access to information technology software tools, such as scheduling software tools, work authorization systems, configuration management systems, information collection and distribution systems, as well as interfaces to other online automated systems such as organizational knowledge repositories. Automated gathering and reporting on key performance indicators (KPIs) can be part of this system.
Project reporting. Project reporting is the act of collecting and distributing project information. Project information is distributed to many groups of stakeholders and should be adapted to provide information at an appropriate level, format, and detail for each type of stakeholder. The format may range from a simple communication to more elaborate custom reports and presentations. Information may be prepared regularly or on an exception basis. While work performance reports are the output of the Monitor and Control Project Work process, the Manage Communications process develops ad hoc reports, project presentations, blogs, and other types of communication about the project.
Prompt lists. A prompt list is a predetermined list of risk categories that might give rise to individual project risks and that could also act as sources of overall project risk. The prompt list can be used as a framework to aid the project team in idea generation when using risk identification techniques. The risk categories in the lowest level of the risk breakdown structure can be used as a prompt list for individual project risks. Some common strategic frameworks are more suitable for identifying sources of overall project risk, for example PESTLE (political, economic, social, technological, legal, environmental), TECOP (technical, environmental, commercial, operational, political), or VUCA (volatility, uncertainty, complexity, ambiguity).
Proposal evaluation. Proposals are evaluated to ensure they are complete and respond in full to the bid documents, procurement statement of work, source selection criteria, and any other documents that went out in the bid package.
Prototypes. A method of obtaining early feedback on requirements by providing a working model of the expected product before building it. Examples of prototypes are small-scale products, computer-generated 2D and 3D models, mock-ups, or simulations. Prototypes allow stakeholders to experiment with a model of the final product rather than being limited to discussing abstract representations of their requirements. Prototypes support the concept of progressive elaboration in iterative cycles of mock-up creation, user experimentation, feedback generation, and prototype revision. When enough feedback cycles have been performed, the requirements obtained from the prototype are sufficiently complete to move to a design or build phase.
Storyboarding is a prototyping technique showing sequence or navigation through a series of images or illustrations. Storyboards are used on a variety of projects in a variety of industries, such as film, advertising, instructional design, and on agile and other software development projects. In software development, storyboards use mock-ups to show navigation paths through web pages, screens, or other user interfaces.
Quality improvement methods. Quality improvements can occur based on findings and recommendations from quality control processes, the findings of the quality audits, or problem solving in the Manage Quality process. Plan-do-check-act and Six Sigma are two of the most common quality improvement tools used to analyze and evaluate opportunities for improvement.
Questionnaires and surveys. Questionnaires and surveys are written sets of questions designed to quickly accumulate information from a large number of respondents. Questionnaires and/or surveys are most appropriate with varied audiences, when a quick turnaround is needed, when respondents are geographically dispersed, and where statistical analysis could be appropriate.
Recognition and rewards. Part of the team development process involves recognizing and rewarding desirable behavior. The original plan for rewarding people is developed during the Plan Resource Management process. Rewards will be effective only if they satisfy a need that is valued by that individual. Reward decisions are made, formally or informally, during the process of managing the project team. Cultural differences should be considered when determining recognition and rewards.
People are motivated when they feel they are valued in the organization and this value is demonstrated by the rewards given to them. Generally, money is viewed as a tangible aspect of any reward system, but intangible rewards could be equally or even more effective. Most project team members are motivated by an opportunity to grow, accomplish, be appreciated, and apply their professional skills to meet new challenges. A good strategy for project managers is to give the team recognition throughout the life cycle of the project rather than waiting until the project is completed.
Regression analysis. Regression analysis is an analytical technique where a series of input variables are examined in relation to their corresponding output results in order to develop a mathematical or statistical relationship. This technique analyzes the interrelationships between different project variables that contributed to project outcomes in order to improve performance on future projects.
Representations of uncertainty. Quantitative risk analysis requires inputs to a quantitative risk analysis model that reflect individual project risks and other sources of uncertainty.
Where the duration, cost, or resource requirement for a planned activity is uncertain, the range of possible values can be represented in the model as a probability distribution. The most commonly used forms are triangular, normal, lognormal, beta, uniform, or discrete distributions. Care should be taken when selecting an appropriate probability distribution to reflect the range of possible values for the planned activity.
Individual project risks may be covered by probability distributions. Alternatively, risks may be included in the model as probabilistic branches, where optional activities are added to the model to represent the time and/or cost impact of the risk should it occur, and the chance that these activities actually occur in a particular simulation run matches the risk's probability. Branches are most useful for risks that might occur independently of any planned activity. Where risks are related, for example, with a common cause or a logical dependency, correlation is used in the model to indicate this relationship.
Other sources of uncertainty may be represented using branches to describe alternative paths through the project.
Reserve analysis. Reserve analysis is an analytical technique to determine the essential features and relationships of components in the project management plan in order to establish a reserve for the schedule duration, budget, estimated cost, or funds for a project.
Cost estimates may include contingency reserves (sometimes called contingency allowances) to account for cost uncertainty. Contingency reserves are the budget within the cost baseline that is allocated for identified risks. Contingency reserves are often viewed as the part of the budget intended to address the known-unknowns that can affect a project. For example, rework for some project deliverables could be anticipated, while the amount of this rework is unknown. Contingency reserves may be estimated to account for this unknown amount of rework. Contingency reserves can be provided at any level from the specific activity to the entire project. The contingency reserve may be a percentage of the estimated cost, a fixed number, or may be developed by using quantitative analysis methods.
As more precise information about the project becomes available, the contingency reserve may be used, reduced, or eliminated. Contingency should be clearly identified in the cost documentation. Contingency reserves are part of the cost baseline and the overall funding requirements for the project.
Resource optimization. Resource optimization is used to adjust the start and finish dates of activities to adjust planned resource use to be equal to or less than resource availability. Examples of resource optimization techniques that can be used to adjust the schedule model due to demand and supply of resources include but are not limited to:
▶Resource leveling. A technique in which start and finish dates are adjusted based on resource constraints with the goal of balancing the demand for resources with the available supply. Resource leveling can be used when shared or critically required resources are available only at certain times or in limited quantities, or are overallocated, such as when a resource has been assigned to two or more activities during the same time period (as shown in Figure 10-17), or there is a need to keep resource usage at a constant level. Resource leveling can often cause the original critical path to change. Available float is used for leveling resources. Consequently, the critical path through the project schedule may change.
▶Resource smoothing. A technique that adjusts the activities of a schedule model such that the requirements for resources on the project do not exceed certain predefined resource limits. In resource smoothing, as opposed to resource leveling, the project's critical path is not changed, and the completion date may not be delayed. In other words, activities may only be delayed within their free and total float. Resource smoothing may not be able to optimize all resources.

Figure 10-17. Resource Leveling
Responsibility assignment matrix (RAM). A grid that shows the project resources assigned to each work package. A RAM shows the project resources assigned to each work package. It is used to illustrate the connections between work packages, or activities, and project team members. On larger projects, RAMs can be developed at various levels. For example, a high-level RAM can define the responsibilities of a project team, group, or unit within each component of the WBS. Lower-level RAMs are used within the group to designate roles, responsibilities, and levels of authority for specific activities. The matrix format shows all activities associated with one person and all people associated with one activity. This also ensures that there is only one person accountable for any one task to avoid confusion about who is ultimately in charge or has authority for the work. One example of a RAM is a RACI (responsible, accountable, consulted, and informed) chart, shown in Figure 10-18. The sample chart shows the work to be done in the left column as activities. The assigned resources can be shown as individuals or groups. The project manager can select other options, such as “lead” and “resource” designations, as appropriate for the project. A RACI chart is a useful tool to ensure the clear assignment of roles and responsibilities when the team consists of internal and external resources.
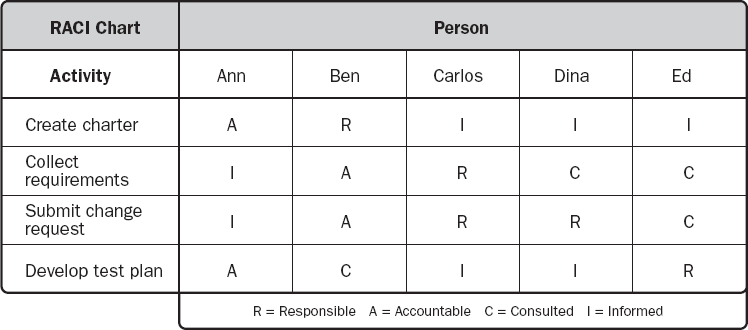
Figure 10-18. Sample RACI Chart
Risk categorization. Risks to the project can be categorized by sources of risk (e.g., using the risk breakdown structure [RBS]); the area of the project affected (e.g., using the work breakdown structure [WBS]); or other useful categories (e.g., project phase, project budget, and roles and responsibilities) to determine the areas of the project most exposed to the effects of uncertainty. Risks can also be categorized by common root causes. Risk categories that may be used for the project are defined in the risk management plan.
Grouping risks into categories can lead to the development of more effective risk responses by focusing attention and effort on the areas of highest risk exposure, or by developing generic risk responses to address groups of related risks.
Risk data quality assessment. Risk data quality assessment evaluates the degree to which the data about individual project risks is accurate and reliable as a basis for qualitative risk analysis. The use of low-quality risk data may lead to a qualitative risk analysis that is of little use to the project. If data quality is unacceptable, it may be necessary to gather better data. Risk data quality may be assessed via a questionnaire measuring the project's stakeholder perceptions of various characteristics, which may include completeness, objectivity, relevancy, and timeliness. A weighted average of selected data quality characteristics can then be generated to give an overall quality score.
Risk probability and impact assessment. Risk probability assessment considers the likelihood that a specific risk will occur. Risk impact assessment considers the potential effect on one or more project objectives such as schedule, cost, quality, or performance. Impacts will be negative for threats and positive for opportunities. Probability and impact are assessed for each identified individual project risk. Risks can be assessed in interviews or meetings with participants selected for their familiarity with the types of risk recorded in the risk register. Project team members and knowledgeable persons external to the project are included. The level of probability for each risk and its impact on each objective are evaluated during the interview or meeting. Differences in the levels of probability and impact perceived by stakeholders are to be expected, and such differences should be explored. Explanatory detail, including assumptions justifying the levels assigned, are also recorded. Risk probabilities and impacts are assessed using the definitions given in the risk management plan. Risks with low probability and impact may be included within the risk register as part of a watch list for future monitoring. Refer to Table 9-2 for an example of definitions of probability and impacts.
Rolling wave planning. Rolling wave planning is an iterative planning technique in which the work to be accomplished in the near term is planned in detail, while work further in the future is planned at a higher level. It is a form of progressive elaboration applicable to work packages, planning packages, and release planning when using an agile or waterfall approach. Therefore, work can exist at various levels of detail depending on where it is in the project life cycle. During early strategic planning when information is less defined, work packages may be decomposed to the known level of detail. As more is known about the upcoming events in the near term, work packages can be decomposed into activities.
Root cause analysis. Root cause analysis is an analytical technique used to determine the basic underlying reason that causes a variance, defect, or risk. A root cause may underlie more than one variance, defect, or risk. It may also be used as a technique for identifying root causes of a problem and solving them. When all root causes for a problem are removed, the problem does not recur.
Scatter diagrams. A scatter diagram is a graph that shows the relationship between two variables. Scatter diagrams can demonstrate a relationship between any element of a process, environment, or activity on one axis and a quality defect on the other axis.
Schedule compression. Schedule compression techniques are used to shorten or accelerate the schedule duration without reducing the project scope in order to meet schedule constraints, imposed dates, or other schedule objectives. A helpful technique is the negative float analysis. The critical path is the one with the least float. Due to violating a constraint or imposed date, the total float can become negative. Schedule compression techniques are compared in Figure 10-19 and include:
▶Crashing. A technique used to shorten the schedule duration for the least incremental cost by adding resources. Examples of crashing include approving overtime, bringing in additional resources, or paying to expedite delivery to activities on the critical path. Crashing works only for activities on the critical path where additional resources will shorten the activity's duration. Crashing does not always produce a viable alternative and may result in increased risk and/or cost.
▶Fast tracking. A schedule compression technique in which activities or phases normally done in sequence are performed in parallel for at least a portion of their duration. An example is constructing the foundation for a building before completing all of the architectural drawings. Fast tracking may result in rework and increased risk. Fast tracking only works when activities can be overlapped to shorten the project duration on the critical path. Using leads in case of schedule acceleration usually increases coordination efforts between the activities concerned and increases quality risk. Fast tracking may also increase project costs.
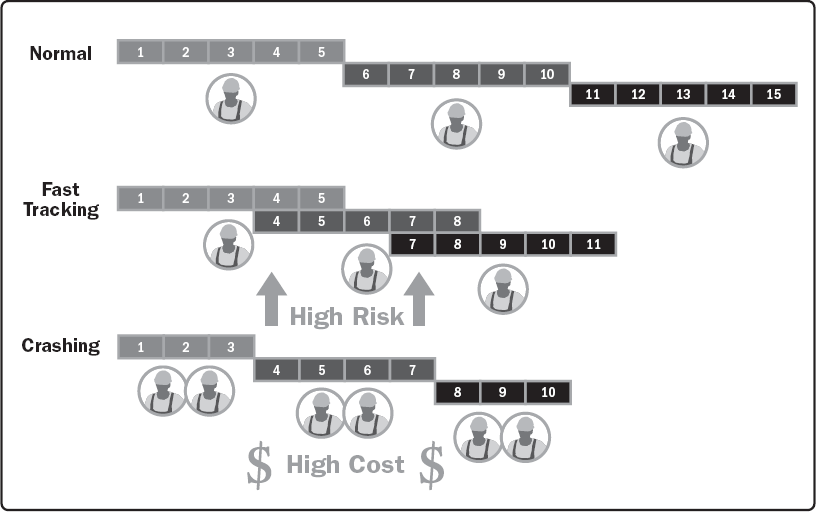
Figure 10-19. Schedule Compression Comparison
Schedule network analysis. Schedule network analysis is a technique to identify early and late start dates, including early and late finish dates, for the uncompleted portions of project activities. Schedule network analysis is the overarching technique used to generate the project schedule model. It employs several other techniques such as critical path method, resource optimization techniques, and modeling techniques. Additional analysis includes but is not limited to:
▶Assessing the need to aggregate schedule reserves to reduce the probability of a schedule slip when multiple paths converge at a single point in time, or when multiple paths diverge from a single point in time, to reduce the probability of a schedule slip.
▶Reviewing the network to see if the critical path has high-risk activities or long-lead items that would necessitate use of schedule reserves or the implementation of risk responses to reduce the risk on the critical path.
Schedule network analysis is an iterative process that is employed until a viable schedule model is developed.
Sensitivity analysis. An analysis technique to determine which individual project risks or other sources of uncertainty have the most potential impact on project outcomes, by correlating variations in project outcomes with variations in elements of a quantitative risk analysis model.
Sensitivity analysis helps to determine which individual project risks or other sources of uncertainty have the most potential impact on project outcomes. It correlates variations in project outcomes with variations in elements of the quantitative risk analysis model.
One typical display of sensitivity analysis is the tornado diagram, which presents the calculated correlation coefficient for each element of the quantitative risk analysis model that can influence the project outcome. This can include individual project risks, project activities with high degrees of variability, or specific sources of ambiguity. Items are ordered by descending strength of correlation, giving the typical tornado appearance. An example tornado diagram is shown in Figure 10-20.

Figure 10-20. Example of a Tornado Diagram
Simulation. Simulation models the combined effects of individual project risks and other sources of uncertainty to evaluate their potential impact on achieving project objectives. The most common simulation technique is Monte Carlo analysis, in which risks and other sources of uncertainty are used to calculate possible schedule outcomes for the total project. Simulation involves calculating multiple work package durations with different sets of activity assumptions, constraints, risks, issues, or scenarios using probability distributions and other representations of uncertainty. Figure 10-21 shows a probability distribution for a project with the probability of achieving a certain target date (i.e., project finish date). In this example, there is a 10% probability that the project will finish on or before the target date of 13 May 2022, while there is a 90% probability of completing the project by 28 May 2022.
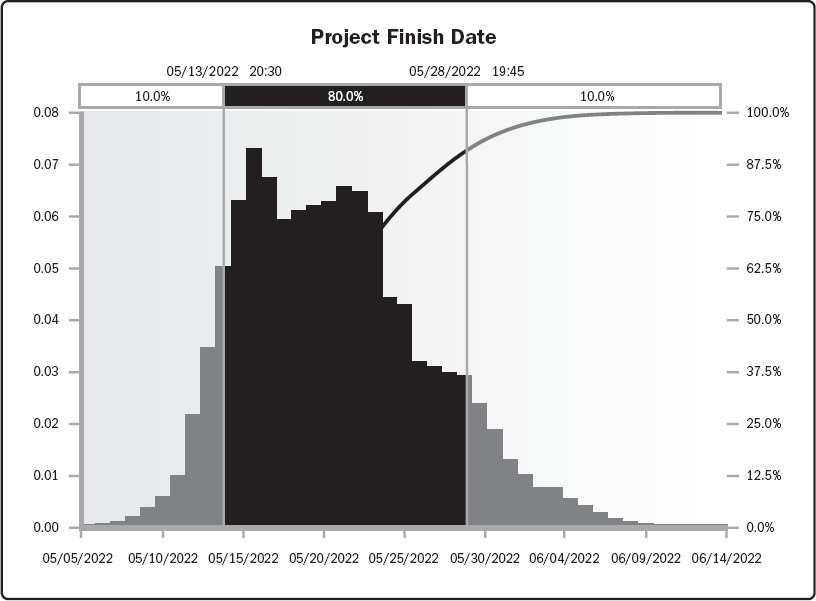
Figure 10-21. Example of a Probability Distribution of a Target Milestone
For more information on how Monte Carlo simulation is used for schedule models, see the Practice Standard for Scheduling [8].
Source selection analysis. It is necessary to review the prioritization of the competing demands for the project before deciding on the selection method. Since competitive selection methods may require sellers to invest a large amount of time and resources up front, it is a good practice to include the evaluation method in the bid documents so bidders know how they will be evaluated. Commonly used selection methods include the following:
▶Least cost. The least cost method may be appropriate for procurements of a standard or routine nature where well-established practices and standards exist and from which a specific and well-defined outcome is expected, which can be executed at different costs.
▶Qualifications only. The qualifications only selection method applies when the time and cost of a full selection process would not make sense because the value of the procurement is relatively small. The buyer establishes a short list and selects the bidder with the best credibility, qualifications, experience, expertise, areas of specialization, and references.
▶Quality-based/highest technical proposal score. The selected firm is asked to submit a proposal with both technical and cost details and is then invited to negotiate the contract if the technical proposal proves acceptable. Using this method, technical proposals are first evaluated based on the quality of the technical solution offered. The seller who submitted the highest-ranked technical proposal is selected if their financial proposal can be negotiated and accepted.
▶Quality- and cost-based. The quality- and cost-based method allows cost to be included as a factor in the seller selection process. In general, when risk and/or uncertainty are greater for the project, quality should be a key element when compared to cost.
▶Sole source. The buyer asks a specific seller to prepare technical and financial proposals, which are then negotiated. Since there is no competition, this method is acceptable only when properly justified and should be viewed as an exception.
▶Fixed budget. The fixed-budget method requires disclosing the available budget to invited sellers in the request for proposal (RFP) and selecting the highest-ranking technical proposal within the budget. Because sellers are subject to a cost constraint, they will adapt the scope and quality of their offer to that budget. The buyer should therefore ensure that the budget is compatible with the statement of work (SOW) and that the seller will be able to perform the tasks within the budget. This method is appropriate only when the SOW is precisely defined, no changes are anticipated, and the budget is fixed and cannot be exceeded.
Stakeholder analysis. Stakeholder analysis results in a list of stakeholders and relevant information such as their positions in the organization, roles on the project, “stakes,” expectations, attitudes (their levels of support for the project), and their interest in information about the project. Stakeholders’ stakes can include but are not limited to a combination of:
▶Interest. A person or group can be affected by a decision related to the project or its outcomes.
▶Rights (legal or moral rights). Legal rights, such as occupational health and safety, may be defined in the legislation framework of a country. Moral rights may involve concepts of protection of historical sites or environmental sustainability.
▶Ownership. A person or group has a legal title to an asset or a property.
▶Knowledge. Specialist knowledge, which can benefit the project through more effective delivery of project objectives, organizational outcomes, or knowledge of the power structures of the organization.
▶Contribution. Provision of funds or other resources, including human resources, or providing support for the project in more intangible ways, such as advocacy in the form of promoting the objectives of the project or acting as a buffer between the project and the power structures of the organization and its politics.
Stakeholder engagement assessment matrix. A stakeholder engagement assessment matrix supports comparison between the current engagement levels of stakeholders and the desired engagement levels required for successful project delivery. One way to classify the engagement level of stakeholders is shown in Figure 10-22. The engagement level of stakeholders can be classified as follows:
▶Unaware. Unaware of the project and potential impacts.
▶Resistant. Aware of the project and potential impacts but resistant to any changes that may occur as a result of the work or outcomes of the project. These stakeholders will be unsupportive of the work or outcomes of the project.
▶Neutral. Aware of the project, but neither supportive nor unsupportive.
▶Supportive. Aware of the project and potential impacts and supportive of the work and its outcomes.
▶Leading. Aware of the project and potential impacts and actively engaged in ensuring that the project is a success.
In Figure 10-22, C represents the current engagement level of each stakeholder and D indicates the level that the project team has assessed as essential to ensure project success (desired). The gap between current and desired for each stakeholder will direct the level of communications necessary to effectively engage the stakeholder. The closing of this gap between current and desired is an essential element of monitoring stakeholder engagement.

Figure 10-22. Stakeholder Engagement Assessment Matrix
Stakeholder mapping/representation. Stakeholder mapping and representation is a method of categorizing stakeholders using various methods. Categorizing stakeholders assists the team in building relationships with the identified project stakeholders. Common methods include:
▶Power/interest grid, power/influence grid, or impact/influence grid. Each of these techniques supports a grouping of stakeholders according to their level of authority (power), level of concern about the project's outcomes (interest), ability to influence the outcomes of the project (influence), or ability to cause changes to the project's planning or execution. These classification models are useful for small projects or for projects with simple relationships between stakeholders and the project, or within the stakeholder community itself.
▶Stakeholder cube. This is a refinement of the grid models previously mentioned. This model combines the grid elements into a three-dimensional model that can be useful to project managers and teams in identifying and engaging their stakeholder community. It provides a model with multiple dimensions that improves the depiction of the stakeholder community as a multidimensional entity and assists with the development of communication strategies.
▶Salience model. The salience model describes classes of stakeholders based on assessments of their power (level of authority or ability to influence the outcomes of the project), urgency (need for immediate attention, either time-constrained or relating to the stakeholders’ high stakes in the outcome), and legitimacy (their involvement is appropriate). There is an adaptation of the salience model that substitutes proximity for legitimacy (applying to the team and measuring their level of involvement with the work of the project). The salience model is useful for large, complex communities of stakeholders or where there are complex networks of relationships within the community. It is also useful in determining the relative importance of the identified stakeholders.
▶Directions of influence. This technique classifies stakeholders according to their influence on the work of the project or the project team itself. Stakeholders can be classified in the following ways:
![]() Upward (senior management of the performing organization or customer organization, sponsor, and steering committee),
Upward (senior management of the performing organization or customer organization, sponsor, and steering committee),
![]() Downward (the team or specialists contributing knowledge or skills in a temporary capacity),
Downward (the team or specialists contributing knowledge or skills in a temporary capacity),
![]() Outward (stakeholder groups and their representatives outside the project team, such as suppliers, government departments, the public, end users, and regulators), or
Outward (stakeholder groups and their representatives outside the project team, such as suppliers, government departments, the public, end users, and regulators), or
![]() Sideward (the peers of the project manager, such as other project managers or middle managers who are in competition for scarce project resources or who collaborate with the project manager in sharing resources or information).
Sideward (the peers of the project manager, such as other project managers or middle managers who are in competition for scarce project resources or who collaborate with the project manager in sharing resources or information).
▶Prioritization. Prioritizing stakeholders may be necessary for projects with a large number of stakeholders, where the membership of the stakeholder community is changing frequently, or when the relationships between stakeholders and the project team or within the stakeholder community are complex.
Statistical sampling. Statistical sampling involves choosing part of a population of interest for inspection (for example, selecting 10 engineering drawings at random from a list of 75). The sample is taken to measure controls and verify quality. Sample frequency and sizes should be determined during the Plan Quality Management process.
Strategies for overall project risk. Risk responses should be planned and implemented not only for individual project risks but also to address overall project risk. The same risk response strategies that are used to deal with individual project risks can also be applied to overall project risk:
▶Avoid. Where the level of overall project risk is significantly negative and outside the agreed-upon risk thresholds for the project, an avoid strategy may be adopted. This involves taking focused action to reduce the negative effect of uncertainty on the project as a whole and bring the project back within the thresholds. An example of avoidance at the overall project level would include removal of high-risk elements of scope from the project. Where it is not possible to bring the project back within the thresholds, the project may be canceled. This represents the most extreme degree of risk avoidance and it should be used only if the overall level of threat is, and will remain, unacceptable.
▶Exploit. Where the level of overall project risk is significantly positive and outside the agreed-upon risk thresholds for the project, an exploit strategy may be adopted. This involves taking focused action to capture the positive effect of uncertainty on the project as a whole. An example of exploiting at the overall project level would include addition of high-benefit elements of scope to the project to add value or benefits to stakeholders. Alternatively the risk thresholds for the project may be modified with the agreement of key stakeholders in order to embrace the opportunity.
▶Transfer/share. If the level of overall project risk is high but the organization is unable to address it effectively, a third party may be involved to manage the risk on behalf of the organization. Where overall project risk is negative, a transfer strategy is required, which may involve payment of a risk premium. In the case of high positive overall project risk, ownership may be shared in order to reap the associated benefits. Examples of both transfer and share strategies for overall project risk include but are not limited to setting up a collaborative business structure in which the buyer and the seller share the overall project risk, launching a joint venture or special-purpose company, or subcontracting key elements of the project.
▶Mitigate/enhance. These strategies involve changing the level of overall project risk to optimize the chances of achieving the project's objectives. The mitigation strategy is used where overall project risk is negative, and enhancement applies when it is positive. Examples of mitigation or enhancement strategies include replanning the project, changing the scope and boundaries of the project, modifying project priority, changing resource allocations, adjusting delivery times, etc.
▶Accept. Where no proactive risk response strategy is possible to address overall project risk, the organization may choose to continue with the project as currently defined, even if overall project risk is outside the agreed-upon thresholds. Acceptance can be either active or passive. The most common active acceptance strategy is to establish an overall contingency reserve for the project, including amounts of time, money, or resources to be used if the project exceeds its thresholds. Passive acceptance involves no proactive action apart from periodic review of the level of overall project risk to ensure that it does not change significantly.
Strategies for threats. There are five alternative strategies that may be considered for dealing with threats, as follows:
▶Escalate. Escalation is appropriate when the project team or the project sponsor agrees that a threat is outside the scope of the project or that the proposed response would exceed the project manager's authority. Escalated risks are managed at the program level, portfolio level, or other relevant part of the organization, but not on the project level. The project manager determines who should be notified about the threat and communicates the details to that person or part of the organization. It is important that the ownership of escalated threats is accepted by the relevant party in the organization. Threats are usually escalated to the level that matches the objectives that would be affected if the threat occurred. Escalated threats are not monitored further by the project team after escalation, although they may be recorded in the risk register for information.
▶Avoid. Risk avoidance is when the project team acts to eliminate the threat or protect the project from its impact. Avoidance may be appropriate for high-priority threats with a high probability of occurrence and a large negative impact. Avoidance may involve changing some aspect of the project management plan or changing the objective that is in jeopardy in order to eliminate the threat entirely, reducing its probability of occurrence to zero. The risk owner may also take action to isolate the project objectives from the risk's impact if it were to occur. Examples of avoidance actions may include removing the cause of a threat, extending the schedule, changing the project strategy, or reducing scope. Some risks can be avoided by clarifying requirements, obtaining information, improving communication, or acquiring expertise.
▶Transfer. Transfer involves shifting ownership of a threat to a third party to manage the risk and to bear the impact if the threat occurs. Risk transfer often involves the payment of a risk premium to the party taking on the threat. The risk transfer can be achieved by a range of actions, which include but are not limited to the use of insurance, performance bonds, warranties, guarantees, etc. Agreements may be used to transfer ownership and liability for specified risks to another party.
▶Mitigate. In risk mitigation, action is taken to reduce the probability of occurrence and/or impact of a threat. Early mitigation action is often more effective than trying to repair the damage after the threat has occurred. Adopting less complex processes, conducting more tests, or choosing a more stable seller are examples of mitigation actions. Mitigation may involve prototype development to reduce the risk of scaling up from a bench-scale model of a process or product. Where it is not possible to reduce probability, a mitigation response might reduce the impact by targeting the factors that drive the severity. For example, designing redundancy into a system may reduce the impact from a failure of the original component.
▶Accept. Risk acceptance acknowledges the existence of a threat, but no proactive action is taken. This strategy may be appropriate for low-priority threats, and it may also be adopted where it is not possible or cost-effective to address a threat in any other way. Acceptance can be either active or passive. The most common active acceptance strategy is to establish a contingency reserve, including amounts of time, money, or resources to handle the threat if it occurs. Passive acceptance involves no proactive action apart from periodic review of the threat to ensure that it does not change significantly.
Strategies for opportunities. There are five alternative strategies that may be considered for dealing with opportunities, as follows:
▶Escalate. This risk response strategy is appropriate when the project team or the project sponsor agrees that an opportunity is outside the scope of the project or that the proposed response would exceed the project manager's authority. Escalated opportunities are managed at the program level, portfolio level, or other relevant part of the organization, and not on the project level. The project manager determines who should be notified about the opportunity and communicates the details to that person or part of the organization. It is important that ownership of escalated opportunities is accepted by the relevant party in the organization. Opportunities are usually escalated to the level that matches the objectives that would be affected if the opportunity occurred. Escalated opportunities are not monitored further by the project team after escalation, although they may be recorded in the risk register for information.
▶Exploit. The exploit strategy may be selected for high-priority opportunities where the organization wants to ensure that the opportunity is realized. This strategy seeks to capture the benefit associated with a particular opportunity by ensuring that it definitely happens, increasing the probability of occurrence to 100%. Examples of exploiting responses may include assigning an organization's most talented resources to the project to reduce the time to completion or using new technologies or technology upgrades to reduce cost and duration.
▶Share. Sharing involves transferring ownership of an opportunity to a third party so that it shares some of the benefit if the opportunity occurs. It is important to select the new owner of a shared opportunity carefully, so they are best able to capture the opportunity for the benefit of the project. Risk sharing often involves payment of a risk premium to the party taking on the opportunity. Examples of sharing actions include forming risk-sharing partnerships, teams, special-purpose companies, or joint ventures.
▶Enhance. The enhance strategy is used to increase the probability and/or impact of an opportunity. Early enhancement action is often more effective than trying to improve the benefit after the opportunity has occurred. The probability of occurrence of an opportunity may be increased by focusing attention on its causes. Where it is not possible to increase probability, an enhancement response might increase the impact by targeting factors that drive the size of the potential benefit. Examples of enhancing opportunities include adding more resources to an activity to finish early.
▶Accept. Accepting an opportunity acknowledges its existence but no proactive action is taken. This strategy may be appropriate for low-priority opportunities, and it may also be adopted where it is not possible or cost-effective to address an opportunity in any other way. Acceptance can be either active or passive. The most common active acceptance strategy is to establish a contingency reserve, including amounts of time, money, or resources to take advantage of the opportunity if it occurs. Passive acceptance involves no proactive action apart from periodic review of the opportunity to ensure that it does not change significantly.
SWOT analysis. The analysis of strengths, weaknesses, opportunities, and threats of an organization, project, or option. This technique examines a project from each of the strengths, weaknesses, opportunities, and threats (SWOT) perspectives. For risk identification, it is used to increase the breadth of identified risks by including internally generated risks. The technique starts with the identification of strengths and weaknesses of the organization, focusing on either the project, organization, or the business area in general. SWOT analysis then identifies any opportunities for the project that may arise from strengths, and any threats resulting from weaknesses. The analysis also examines the degree to which organizational strengths may offset threats and determines if weaknesses might hinder opportunities.
Team building. Team building is conducting activities that enhance the team's social relations and build a collaborative and cooperative working environment. Team-building activities can vary from a 5-minute agenda item in a status review meeting to an off-site, professionally facilitated event designed to improve interpersonal relationships. The objective of team-building activities is to help individual team members work together effectively. Team-building strategies are particularly valuable when team members operate from remote locations without the benefit of face-to-face contact. Informal communication and activities can help in building trust and establishing good working relationships. While team building is essential during the initial stages of a project, it should be a continuous process. Changes in a project environment are inevitable, and to manage them effectively, a continuous or renewed team-building effort may be applied. The project manager should continually monitor team functionality and performance to determine if any actions are needed to prevent or correct various team problems.
Technical performance analysis. Technical performance analysis compares technical accomplishments during project execution to the schedule of technical achievement. It requires the definition of objective, quantifiable measures of technical performance, which can be used to compare actual results against targets. Such technical performance measures may include weight, transaction times, number of delivered defects, storage capacity, etc. Deviation can indicate the potential impact of threats or opportunities.
Test and inspection planning. During the planning phase, the project manager and the project team determine how to test or inspect the product, deliverable, or service to meet the stakeholders’ needs and expectations, as well as how to meet the goal for the product's performance and reliability. The tests and inspections are industry dependent and can include, for example, alpha and beta tests in software projects, strength tests in construction projects, inspection in manufacturing, and field tests and nondestructive tests in engineering.
Testing/product evaluations. Testing is an organized and constructed investigation conducted to provide objective information about the quality of the product or service under test in accordance with the project requirements. The intent of testing is to find errors, defects, bugs, or other nonconformance problems in the product or service. The type, amount, and extent of tests needed to evaluate each requirement are part of the project quality plan and depend on the nature of the project, time, budget, and other constraints. Tests can be performed throughout the project, as different components of the project become available, and at the end of the project on the final deliverables. Early testing helps identify nonconformance problems and helps reduce the cost of fixing the nonconforming components.
Different application areas require different tests. For example, software testing may include unit testing, integration testing, black-box, white-box, interface testing, regression testing, alpha testing, etc. In construction projects, testing may include cement strength, concrete workability tests, nondestructive tests at construction sites for testing the quality of hardened concrete structures, and soil tests. In hardware development, testing may include environmental stress screening, burn-in tests, system testing, and more.
Text-oriented formats. Team member responsibilities that require detailed descriptions can be specified in text-oriented formats. Usually in outline form, these documents provide information such as responsibilities, authority, competencies, and qualifications. The documents are known by various names including position descriptions and role-responsibility-authority forms. These documents can be used as templates for future projects, especially when the information is updated throughout the current project by applying lessons learned.
Three-point estimating. The accuracy of single-point duration estimates may be improved by considering estimation uncertainty and risk. Using three-point estimates helps define an approximate range for an activity's duration:
▶Most likely (tM). This estimate is based on the duration of the activity, given the resources likely to be assigned, their productivity, realistic expectations of availability for the activity, dependencies on other participants, and interruptions.
▶Optimistic (tO). The activity duration based on analysis of the best-case scenario for the activity.
▶Pessimistic (tP). The duration based on analysis of the worst-case scenario for the activity.
Depending on the assumed distribution of values within the range of the three estimates, the expected duration, tE, can be calculated. One commonly used formula is triangular distribution:
tE = (tO + tM + tP) / 3.
Triangular distribution is used when there is insufficient historical data or when using judgmental data. Duration estimates based on three points with an assumed distribution provide an expected duration and clarify the range of uncertainty around the expected duration.
To-complete performance index (TCPI). The to-complete performance index (TCPI) is a measure of the cost performance that is required to be achieved with the remaining resources in order to meet a specified management goal, expressed as the ratio of the cost to finish the outstanding work to the remaining budget. TCPI is the calculated cost performance index that is achieved on the remaining work to meet a specified management goal, such as the budget at completion (BAC) or estimate at completion (EAC). If it becomes obvious that the BAC is no longer viable, the project manager should consider the forecasted EAC. Once approved, the EAC may replace the BAC in the TCPI calculation. The equation for TCPI is: (BAC − EV) / (BAC − AC) where: BAC = budget at completion, EV = earned value, and AC = actual cost.
The TCPI is conceptually displayed in Figure 10-23. The equation for the TCPI is shown in the lower left as the work remaining (defined as the BAC minus the EV) divided by the funds remaining (which can be either the BAC minus the AC, or the EAC minus the AC).
If the cumulative CPI falls below the baseline (as shown in Figure 10-23), all future work of the project will need to be performed immediately in the range of the TCPI (BAC) (as reflected in the top line of Figure 10-23) to stay within the authorized BAC. Whether this level of performance is achievable is a judgment call based on several considerations, including risk, time remaining in the project, and technical performance. This level of performance is displayed as the TCPI (EAC) line. The equation for the TCPI is based on the EAC: (BAC − EV) / (EAC − AC). The EVM formulas are provided in Table 10-1.

Figure 10-23. To-Complete Performance Index (TCPI)
Table 10-1. Earned Value Calculations Summary Table

Training. Training includes all activities designed to enhance the competencies of the project team members. Training can be formal or informal. Examples of training methods include classroom, online, computer-based, on-the-job training from another project team member, mentoring, and coaching. If project team members lack the necessary management or technical skills, such skills can be developed as part of the project work.
Scheduled training takes place as stated in the resource management plan. Unplanned training takes place as a result of observation, conversation, and project performance appraisals conducted during management of the project team. Training costs could be included in the project budget or supported by the performing organization if the added skills may be useful for future projects. It may be performed by in-house or by external trainers.
Trend analysis. An analytical technique that uses mathematical models to forecast future outcomes based on historical results. It looks ahead in the project for expected slippages and warns the project manager ahead of time that there may be problems later in the schedule if established trends persist. This information is made available early enough in the project time line to give the project team time to analyze and correct any anomalies. The results of trend analysis can be used to recommend preventive actions if necessary.
Variance analysis. An analytical technique that uses mathematical models to forecast future outcomes based on historical results. Variance analysis reviews the differences (or variances) between planned and actual performance. This can include duration estimates, cost estimates, resources utilization, resources rates, technical performance, and other metrics.
Variance analysis reviews the variances from an integrated perspective considering cost, time, technical, and resource variances in relation to each other to get an overall view of variance on the project. This allows for the appropriate preventive or corrective actions to be initiated.
Voting. Voting is a collective decision-making technique and an assessment process having multiple alternatives with an expected outcome in the form of future actions. These techniques can be used to generate, classify, and prioritize product requirements. Examples of voting techniques include:
▶Unanimity. A decision that is reached whereby everyone agrees on a single course of action.
▶Majority. A decision that is reached with support obtained from more than 50% of the members of the group. Having a group size with an uneven number of participants can ensure that a decision will be reached rather than resulting in a tie.
▶Plurality. A decision that is reached whereby the largest block in a group decides, even if a majority is not achieved. This method is generally used when the number of options nominated is more than two.
What-if scenario analysis. What-if scenario analysis is the process of evaluating scenarios in order to predict their effect, positive or negative, on project objectives. This is an analysis of the question, “What if the situation represented by scenario X happens?” A schedule network analysis is performed using the schedule to compute the different scenarios, such as delaying a major component delivery, extending specific engineering durations, or introducing external factors, such as a strike or a change in the permit process. The outcome of the what-if scenario analysis can be used to assess the feasibility of the project schedule under different conditions, and in preparing schedule reserves and response plans to address the impact of unexpected situations.