
Perform the following steps to set a threshold and create an estimated failover time metric:
- Open the database home page for the standby database by navigating to Targets | Databases and then clicking on the name of the standby database.
- Navigate to the metrics page by navigating to Oracle Database | Monitoring | All Metrics.
- Expand the Data Guard Performance category and click on the Estimated Failover Time section:
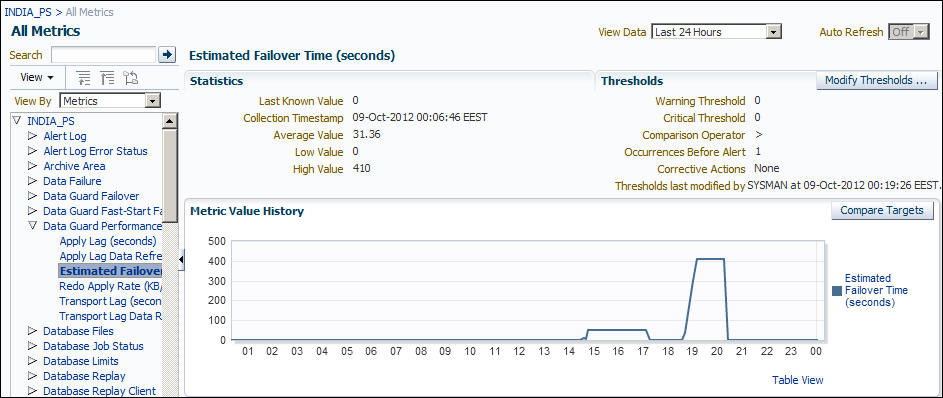
- Click on Modify Thresholds. Enter
15for Warning Threshold and20for Critical Threshold. Then click on Save Thresholds: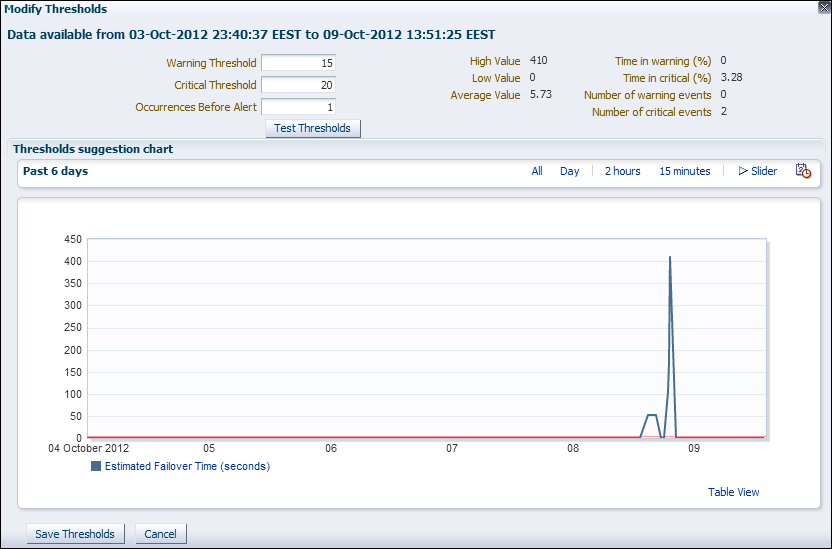
- Navigate to the Data Guard Administration page by navigating to Availability | Data Guard Administration. Click on Edit to edit the standby database properties.
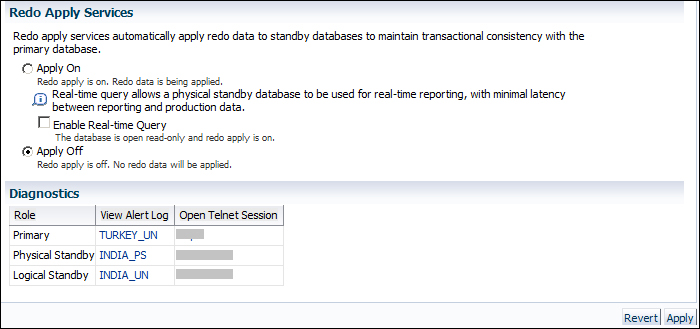
- Stop the Redo Apply process by selecting Apply Off and click on Apply:
- Navigate to the Data Guard performance page by navigating to Availability | Data Guard Performance and start the test application. After the test application is started, load will be generated on the primary database. Because we have stopped the Redo Apply process on the standby database, an apply lag will occur and the estimated failover time will increase.
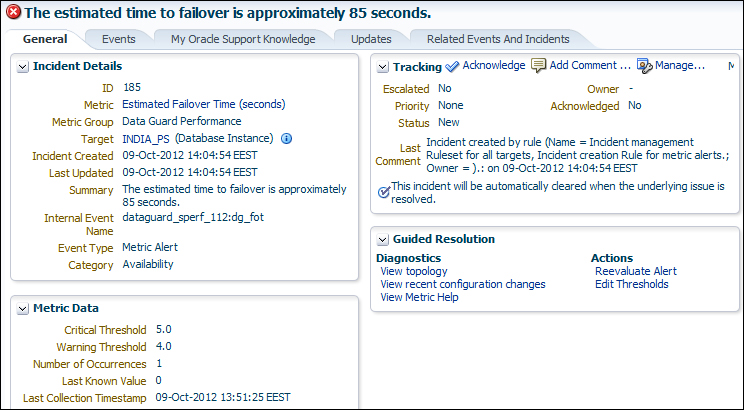
- Open the Incident Manager by navigating to Enterprise | Monitoring | Incident Manager. Refresh the page until an incident comes up about the estimated failover time. We can see an example incident in the following screenshot:
- Stop the test application and then start the Redo Apply process on the standby database.
We've seen the Data Guard performance monitoring and the Incident Management properties of Cloud Control. We've also run an example to automatically create an incident on an estimated failover time metric. These incidents may help database administrators a lot, for monitoring their Data Guard environments.
..................Content has been hidden....................
You can't read the all page of ebook, please click here login for view all page.