Chapter 2
Getting Up to Speed with Fundamental Analysis
IN THIS CHAPTER
![]() Comprehending what fundamental analysis is and how it can help your portfolio
Comprehending what fundamental analysis is and how it can help your portfolio
![]() Finding out what’s involved in using fundamental analysis
Finding out what’s involved in using fundamental analysis
![]() Comparing fundamental analysis with other ways of selecting investments
Comparing fundamental analysis with other ways of selecting investments
![]() Getting an understanding of what tools are needed to analyze an investment
Getting an understanding of what tools are needed to analyze an investment
Try to remember what it was like being a beginner at something you’re good at now. Whether it was karate, ballet, or basketball, as a newbie, you may have been tempted to bypass all the basics and go straight for the advanced techniques. It’s natural to want to try breaking boards with your bare hands or doing pirouettes or slam-dunks on your first day of trying something new.
Good coaches, though, encourage you to slow down and start from the very beginning. It’s almost always best to start working on the basic karate stances, ballet poses, and basketball dribbling before even thinking about moving to the showy and advanced aspects of each sport.
Beginning investors often experience a similar overconfidence at first. Many hope they can skip mundane things — like reading accounting statements, understanding basic financial ratios, and calculating discounted cash-flow models — and get right to the exotic rapid-fire trading. It’s tempting to think you can trade complex securities, dabble in highly volatile stocks, and dart in and out of investments with ease right away. Realistically, though, investors usually lose money when they try to get too advanced too soon. And unfortunately, there’s no coach to cool off investors who are just starting out.
So, consider this book to be your coach as you begin. Starting with this chapter, this book will introduce you to the basic skills that make up fundamental analysis. The basics explained in this chapter will set you up for taking fundamental analysis to the next level in chapters deeper in the book.
What Is Fundamental Analysis?
Ask 20 people how they choose their investments, and you’ll hear 20 different methods. Some like to buy stocks recommended by a friend or broker. Others think it’s wise to invest in companies making products they personally enjoy and use. A few even consult with astrologers (seriously). What most people, though, have in common is that they feel they’re always paying too much for stocks and selling them when they’re too cheap.
Perhaps you swing between different investment strategies like some folks switch diets to lose weight. Experimenting with different ways of picking stocks may have worked fine as stocks made breathtaking advances in the 1990s. But the financial crisis of 2008 and 2009, as well as the bear market of 2022 that crushed many popular stocks, changed everything, serving up another harsh reminder to many investors today that it’s possible to overpay for stocks. Not realizing that ahead of time can be hazardous to your portfolio, and perhaps after losing money a few too many times, you’re looking for a method with a little more science behind it.
That’s where fundamental analysis comes in. Fundamental analysis is one of the most sound and primary ways to evaluate investments. As a fundamental analyst, you carefully and thoroughly study every aspect of a company’s operations. Much of your analysis will be focused on financial statements companies provide, as described briefly in this chapter and in more detail later in this book.
Going beyond betting
If you’re like most investors, even the words fundamental analysis may turn you off a bit. Fundamental analysis sounds somewhat stuffy and academic. And it’s true that fundamental analysis finds much of its roots in academia. But you might be surprised to find you probably are using some basic forms of fundamental analysis in your life, perhaps even in places you wouldn’t expect.
One of my favorite examples of where a type of fundamental analysis is used is at the horse races. Before a race, you’ll notice groups of bettors doing some serious work trying to pick the day’s winning horses. Some may pore over the life histories of horses in the race, getting to know the jockeys and their techniques, and even studying how wet or dry the track is.
Although investing isn’t exactly like horse racing, the analogy is a helpful way to understand fundamental analysis. For instance, some fundamental analysts will study a company like a bettor will study a horse. How successful has the company been recently, and is it healthy and well-cared for? Next, in fundamental analysis you might study a company’s management like a bettor would consider the jockey. Is the management experienced, and has it competed against rivals before like the ones its facing now? Lastly, you must evaluate the broad economic climate, just like a bettor will consider the weather and condition of the track.
But here’s where things get even trickier. It’s not good enough to find the best company, or horse, to take the metaphor a little further. After all, if all the other bettors at the track did the same work and picked the same horse that you selected, you have a problem. The odds would be adjusted so that the payout on the favorite horse will fall. Bettors know that picking a favorite horse to win doesn’t pay off much. And you’re also taking a chance that the favorite will surprise almost everyone by losing and cost you money. Similarly, if you invest in a company that’s widely considered to be a darling with other investors, your payoff is reduced for reasons you can discover in Chapter 3.
Now that you see what fundamental analysis is, broadly speaking, consider how it can be applied to investing. Fundamental analysis is used to size up investments in several key ways:
- Analyzing the financial statements: Fundamental analysts pore over public documents companies provide to understand how the business is performing. Many fundamental analysts’ starting point is digging into a company’s financial statements to see how profitable a company is, how rapidly it is growing, what kind of financial health it’s in, and whether it has the ability to withstand tough economic times.
- Getting an idea of how solid a company is: Many fundamental analysts are fixed-income investors. These investors have loaned money to companies, usually by buying bonds. Bond investors give money to a company in exchange for an agreed-upon payment each month, quarter, or year. Because bond investors get a fixed amount of pay, they don’t care if a company is wildly successful. Bond investors, unlike stock investors, don’t get a share of future earnings and growth. Bond investors just want to know the company is healthy enough so it can keep paying interest and return the money it borrowed.
- Understanding the value of a company: Stock investors use fundamental analysis to gauge whether a company’s stock is a good deal or not. By studying financial statements, financial analysts determine whether a stock’s price undervalues or overvalues the company. You can find out how to value a company using the discounted cash flow analysis — a favorite with fundamental analysts — in Chapter 11.
- Going beyond the financials: Fundamental analysis goes beyond where accounting stops. Accountants’ goal is to precisely measure business activity. Fundamental analysts are looking for much more: They want to understand how a business actually works and what it’s worth. Using fundamental analysis, you will evaluate other factors that affect a company’s prospects that go beyond what an accountant would care about. Common factors you might consider include sizing up a company against its rivals, determining how skilled a company’s management team is in navigating through boom and bust times, and understanding the broad economic climate.
- Comparing a company’s performance with its industry and competitors: A company’s value, financial resources, or performance is measured relative to its peers. Fundamental analysis will show you how to not just size up the company you’re interested in, but see how it measures up with the companies it is competing with.
 Fundamental analysts take all the intelligence they gather to arrive at an investment decision and to take action. The most common question fundamental analysts ask themselves is whether a stock, at its current price, is cheap or expensive. The answer to that question will determine whether you choose to invest or not.
Understanding how fundamental analysis works
 Fundamental analysts often dig well beyond a company’s financial statements and try to unearth things. Sometimes fundamental analysts might spot a trend forming before a company’s management acknowledges it. A fundamental analyst, for instance, might visit a retailer’s stores and see how crowded they are to get an idea of what earnings might be in the future. Similarly, the fundamental analyst may try to get an idea of future demand by considering how busy a company’s suppliers are. The goal of fundamental analysis is to measure how much a company is worth by using any shred of information possible.
The way you use fundamental analysis to understand what a company is worth gets down to the core essence of what a business is. With fundamental analysis, your goal is to monitor a company to see how it brings in money by selling goods and services to generate revenue. Next, you’ll determine how much of revenue a company manages to keep after paying its expenses. What’s left after paying all the bills is profit, or earnings.
The fact that fundamental analysts take action on their research is what separates them from accountants. Fundamental analysts compare what they think a company is worth with what other investors think. If the stock is undervalued, the fundamental analyst will buy the stock. Accountants, on the other hand, have the job of recording sales and revenue, but not trying to profit off their findings.
Who can perform fundamental analysis?
You don’t have to be a high-powered investor to use fundamental analysis. If you have an interest in finding out more deeply about how companies work, you’re a candidate for learning about fundamental analysis. In fact, knowing how to read, analyze, and take action from information you glean about a company can be helpful for many users, including:
- Stock investors: Those looking to take an ownership stake in a company have a great financial incentive to master fundamental analysis. What they find out about companies may help them to decide when a good time to buy or sell may be.
- Lenders: When you give someone a loan, you want to make sure they have the ability to pay you back. If you lend money to a company, perhaps by buying bonds it issues, you’re more concerned about getting your money back than about making a killing on the investment.
- Mutual fund and exchange-traded fund (ETF) investors: Even if you don’t pick individual stocks or bonds to invest in, you probably own mutual funds or ETFs that do. Mutual funds and ETFs are investments that invest in a basket of individual securities. Using fundamental analysis, you can investigate some of the stocks your mutual funds may own. You might take a look at the top holdings of your mutual fund and question why your mutual fund owns them.
- Employees: Workers may be anxious about the health of their company for several reasons. Using the same techniques an investor would use, you can study your company’s financial resources and roughly estimate how likely it might be to pursue aggressive cost-cutting, like layoffs. Employees who depend on a pension paid by a former employer might also want to study the health of the company and make sure it will stick around.
- Board members: Whether you’re a board member of a large company, your local museum, or your condominium association, understanding the flow of money in and out can make you more valuable. Understanding fundamental analysis will help you be a solid watchdog of the organization’s management by looking at facts, not promises.
- Donors: Even some nonprofit charities disclose their financial standing. Fundamental analysis will help you see where donations are being spent and whether or not money is getting to those in need or being soaked up by the bureaucracy.
- Consumers: When you buy a product or service, you may not think of yourself as investing in a company. Most of the time, you’re not. But sometimes by buying a product you are forming a long-term relationship with a company. Take a car or an insurance product. These types of long-lived assets can attach you to the hip of a company for years. It’s a good idea to know how to analyze a company if you plan on relying on its products for a long time.
Above all, fundamental analysts are good at not getting hoodwinked by companies. That’s a good skill to have. Fundamental analysis gives you the tools you’ll need to get to the truth beyond the numbers.
Fundamental analysts spend quite a bit of time looking at companies’ financial statements, as you’ll learn in Part 2 of this book. But skilled fundamental analysts do more than just pick apart financial statements. After all, if that’s all it was, fundamental analysis would be synonymous with accounting. Fundamental analysts use their findings to make investment decisions.
Following the money using fundamentals
Tracing the movement of dollars through an organization will quickly show you the motives of the leaders, availability of resources, and vulnerabilities. Regulators will often follow the movement of money to pinpoint illegal cartels, Ponzi schemes, and other frauds.
All this might sound very cloak-and-dagger. But there’s something to be learned from approaching fundamental analysis with the mind of an investigator. Your job is to take available information and dig up data yourself to get a complete picture of a company and whether or not it’s a suitable place for you to entrust your money. Following the way money moves through a company will tell you more about it than just about anything else.
While no two companies are the same, the basics of business are universal. That’s why fundamental analysis is such a powerful tool you can apply to high-tech companies, low-tech companies, and everything in between.
Companies are merely in the business of selling things they acquire for more than what they paid. Sounds simple. But that can be easy to forget after you get mired in details like profit margins, earnings per share, and P-E ratios.
Following the money at a company, so to speak, traces a predictable cycle. Just like the cycle of life repeats and refreshes, companies follow a pretty predictable pattern, too. Fundamental analysts call this the trade cycle — and understanding the cycle is pretty important if you want the financial statements to make sense.
The trade cycle begins with a business idea, but more specifically it starts when a company raises money so it can buy the equipment it needs to get started. Money might be raised by borrowing it, called debt, or by lining up investors willing to bet their money for a piece of future profits, called equity. The money raised is then used to acquire raw materials, office space, or whatever the company needs.
Next, the company tries to add value to the raw materials in some way and sell the product to customers. Typically, companies will also incur indirect costs, or overhead, to make all this happen. Overhead costs include everything from advertising, to research and development, to hiring skilled managers. The products are created and (hopefully) sold to the consumers. The cash collected from customers is then used to repay debt. The cycle then repeats all over again. Isn’t this fun?
Now here’s where fundamental analysis comes in. Here are a few questions a fundamental analyst might ask when taking a look at a company:
- After factoring in all the costs, did the company make money?
- How much money did the company raise to get started?
- Is the company able to maintain itself without borrowing more or getting more investors?
- Can the company create new products to keep buyers coming back?
- Are competitors catching onto the idea and selling a similar product for less?
Comparing Fundamental Analysis with Other Ways of Picking Investments
Fundamental analysis is a well-known way of choosing investments. It’s often the preferred method taught in business schools, largely because of its roots in things that can be measured and understood. But it’s not, by any means, the only method of choosing stocks.
How fundamental analysis stacks up against index investing
If fundamental analysis seems like a lot of work, you can probably identify with index investors. Index investors think taking the time to pore over companies’ financial statements is a whole lot of trouble for nothing. Index investors figure any information to be gleaned from company reports has already been extracted by other investors and acted upon.
For instance, if a company’s stock was truly undervalued, other investors will have already recognized it and bought the stock. If enough investors buy a stock, they push the price up, and the shares are no longer undervalued. And thanks to the proliferation of online investing, analysts and investment firms with access to instantaneous information feeds can make such trading moves very quickly.
For that reason, index investors think trying to buy and sell stocks at just the right time, or use market timing, is impossible. In addition, index investors say that if there is an edge to fundamental analysis, it’s wiped out by the cost and time consumed digging out the information. For that reason, index investors skip the fundamental analysis, and instead:
- Diversify: Rather than trying to pick the companies and stocks that will do best, fundamental analysts buy small stakes in as many stocks as possible. Generally, index investors will buy mutual funds that own hundreds, if not thousands, of stocks. That way, if any one company stumbles badly, the loss is very small as a percentage of the portfolio.
- Buy index funds: Because index investors don’t think fundamental analysis gives investors an edge, they don’t see any reason to pay a mutual fund manager to pick stocks for them. Instead, they buy mutual funds that own all the stocks in popular stock indexes, such as the Dow Jones Industrial Average or Standard & Poor’s 500. The Dow mirrors the ups and downs of 30 large, well-known companies, and the S&P 500 measures the market’s performance using 500 of the largest companies’ shares.
- Focus on costs: Index investors assume the best way to make money in the stock market is by keeping costs low. Index funds generally have low expenses. And rather than spend personal time researching stocks, index investors generally buy a diversified basket of stocks and then forget about the holdings.
Comparing fundamental analysis with technical analysis
Like index investors, investors who use technical analysis shake their heads in disapproval when they see fundamental analysts carefully examining spreadsheets and financial statements. They, like index investors, see all the effort that goes into fundamental analysis as a waste of time and calculator batteries. That’s because technical analysts assume any information worth knowing is reflected in a stock price.
But technical analysts agree with fundamental analysts in one important way: They, too, think it’s possible to beat the stock market. Unlike index investors, who think that timing the market is futile, technical analysts think stock prices move up and down in observable patterns. Knowing how to recognize patterns in stock price movements can signal a technical analyst the best times to get in, and out, of stocks. Technical analysts may not even care what a company does, because they’re just looking at the price chart. To a technical analyst, buying and selling at the right time is more important than buying and selling the right stock. Technical analysts pay close attention to:
- Stock price charts: Technical analysts focus on stock price charts, which are graphs that plot a stock’s movement over a period of time. These charts will show instantly whether a stock is rising or falling in addition to how many trades, or volume, are occurring.
- Trading patterns: Much as an astronomer sees patterns of stars in the sky, technical analysts look for stock price movements that follow a pattern. For instance, if a stock price falls to a low level, rises a bit, and sinks back down to near that same low level, technical analysts call that a support level. A support level is considered a point where demand for a stock is strong enough to stop it from sinking much further.
- Moving averages: Technical analysts often pay close attention to a stock’s average price over a period of time, say 200 days. When a stock falls below its 200-day moving average, or its average price over the past 200 days, that means the stock is vulnerable to fall further, technicians say. The idea is that when stocks fall below their 200-day-moving average, many investors who bought within the past year are losing money and may be nervous and quick to sell.
Putting Fundamental Analysis to Work For You
If you ever see the library of a fundamental analyst, it can be a pretty intimidating sight. Inevitably, there will be a copy of Security Analysis (McGraw-Hill), a 766-page tome stuffed with gnarly formulas and arcane wording that makes your high-school algebra book look like a comic book. There will also be dog-eared copies of books with words like “value,” “financial statements,” and “ratios.” You will see Fundamental Analysis For Dummies on the shelf as well. (Shameless plug, I know.)
Fundamental analysis has the rap of being for people who wouldn’t be caught dead without a pen, mechanical pencil, and calculator in their shirt pocket. But even if you don’t walk around carrying such instruments, you too, can benefit from fundamental analysis. With an understanding of a few terms and basic techniques, fundamental analysis is within reach if you’re interested and willing to put in a bit of time.
Who knows, maybe after reading this book you’ll want to dig deeper into fundamental analysis. After all, fundamental analysis is a bit like art: As you learn a little you naturally get curious and want to learn more.
How difficult is fundamental analysis? Do I need to be math wizard?
Contrary to popular belief, you don’t need to be a math wizard to use fundamental analysis. Most of the math you’ll use is pretty basic arithmetic. And there’s no need to memorize formulas, because I’ll put most of the important ones all together for you in Chapter 8. You will need to know how to build some financial models, which try to forecast how much profit a company will make in the future. But to help you out, I’ll point out some online tools and calculators to crunch some of the more tricky stuff for you.
Some of the more advanced techniques of fundamental analysis might require you to fire up a spreadsheet. If you want to get up to speed, Microsoft provides free help and tutorials for its Excel spreadsheet program at http://support.office.com/en-us/excel. You might also take a look at Microsoft Excel All-In-One For Dummies by Paul McFedries and Greg Harvey, PhD (Wiley).
Is fundamental analysis for you?
If you’re tired of trusting other people to tell you how a company is doing financially, you’re a prime candidate for fundamental analysis. The whole premise of fundamental analysis is to reduce, if not eliminate, speculation and wild guesswork from investing. Fundamental analysis is rooted in the idea that you want to look at cold, hard data to make informed decisions on why an investment might be worth buying. If someone tells you a company is “doing well,” fundamental analysis gives you the background to know whether that claim is really true.
Above all, fundamental analysis is ideal for people who want to approach an investment fully informed of the risks and with their eyes wide open. An in-depth fundamental analysis on a stock will not only alert you to potentially troubling trends at a company, but also give you clues to whether a stock may be overvalued by investors who aren’t paying attention. An overvalued company is one that commands a stock price that well exceeds any possible profit it could generate for investors.
In many ways, fundamental analysis is as much about helping you avoid poor investments as it is about helping you find good ones.
The risks of fundamental analysis
Fundamental analysis, while it’s rooted in math and objective information, isn’t without its flaws. After all, if fundamental analysis were perfect, everyone would quit their day jobs, analyze stocks, and make bundles of money. That’s why it’s important to understand the shortcomings of fundamental analysis, which include:
- Vulnerability to wrong data, including your assumptions: Fundamental analysis is heavily based in fact. But if a company incorrectly reports data or you misinterpret them, you’re going to have a false conclusion. Miscalculations are especially likely when making assumptions about things like a company’s future growth rate, future interest rates, or profits. Even fundamental analysts are human, you know.
- Overreliance on past data: Perhaps the biggest knock against fundamental analysis is how much weight it puts in a company’s past performance. There is some truth to that, because numbers companies report can be a month or more old. However, true fundamental analysis uses historical numbers to make an educated guess about the future.
- Bad timing: Let’s say you do all the homework in researching a stock. You find a stock that appears to be a screaming buy, so you buy it. Guess what? A stock can remain a screaming buy for many years or even decades until investors come to the same conclusion. Fundamental analysts often have to be wrong for a long time before making money.
- Betting against the market: If you buy a stock because you think it’s a steal, you’re in effect betting against thousands of the most sophisticated trading desks around the world with access to the same data. If you think a stock is too cheap, you’re making the gamble that other investors are missing something you can see.
Concentrated positions: If you’re going to the trouble to meticulously study a company, you’re going to want to make sure you’re positioned to profit if you’re right. Unless you have a team of analysts working for you, when you find a stock that fits your fundamental criteria, you’re going to want to own a large chunk of it. As a result, investors who use fundamental analysis may have large exposure to individual companies.
This concept contradicts the idea of diversification, which is owning hundreds and hundreds of small pieces of many companies. With diversification, you’re spreading your risk over many companies so if one has a problem, it doesn’t hurt so badly. Fundamental analysts, though, think that owning just a few investments that you know inside and out is actually safer than owning everything.
Making Money with Fundamental Analysis
Face it. You’re probably not reading this book because you have a deep yearning to understand how to read and analyze company information. You’re looking to dig into company reports for a reason, which is most likely to make money.
Fundamental analysis can be profitable. If you’re able to find hidden value in a company or its stock and buy in before other investors discover what you know, you’ll cash in once the rest of Wall Street catches up to you.
Putting a price tag on a stock or bond
If you’ve ever wondered whether a stock is “cheap” or “pricey,” fundamental analysis can be a big help. Fundamental analysis helps you understand exactly what you’re getting when you buy an investment.
Here’s an example to help you see what I mean. Let’s say you have the opportunity to buy a tree that literally grows dollar bills. Sounds great, right? How much should you pay for the tree? You might be tempted to pay millions of dollars, especially if others have their wallets out and start bidding.
But, fundamental analysis can help you intelligently put a price tag on this amazing plant. By asking some questions and doing some due diligence, you can actually arrive at a correct price. The farmer tells you the tree grows 20 one-dollar bills every month. He also says the tree will likely die in a year and then stop growing money. Lastly, the farmer promises to pay you $20 a month if, for any reason, the tree stops growing money in less than a year. Suddenly this tree that grows money doesn’t sound so wonderful.
Knowing these fundamental details, the tree can be priced. You now know the tree is expected to generate about $240 over the next 12 months until it shrivels up and dies. So, is the tree worth $240? Not so fast. Remember, the tree won’t grow the $240 right away. You have to wait a year to get the entire wad of cash — as you’ll only harvest $20 a month. Because you have to wait a year to get the $240, the tree is worth less than $240. That’s because of the time value of money — a key principle to fundamental analysis — which essentially means a dollar received now is worth more than one received tomorrow. So if there’s a bidding war for the tree that drives the price over $240, you know to walk away based on your fundamental research.
Being profitable by being a “contrarian”
Being a successful fundamental analyst can be pretty lonely. If you’re trying to make money from studying a company and determining the company is worth more than its stock price, you’re betting that other investors bidding for the stock are wrong.
Fundamental analysis, therefore, is somewhat at odds with the efficient market theory. Efficient market theory says that trying to beat the market by picking winning stocks is futile. The strong form of the efficient market theory says that all information that’s knowable about a company is reflected in a company’s stock price. So, let’s say that after reading this book you dig through a company’s financial statements and find that a company has great prospects. Efficient market theory would suggest that you’re not the first person to discover this, and that other investors have already bid the stock up with the same information.
But before you throw your hands up and give up on fundamental analysis, there are some caveats to the efficient market theory worth noting. Most importantly, while stocks may reflect all information over the long term, there can be short-term periods when prices might excessively rise or fall due to extreme and fleeting optimism or pessimism. For instance, many high-technology stocks skyrocketed during the late 1990s, as investors bid up share prices on the idea that they’d be worth a fortune in the future. Fundamental analysts, looking at the fact many of the companies didn’t make money and never would, avoided the dot-com bubble. Eventually, the fundamentals caught up to them and many of the stocks collapsed 90 percent or more. In some cases, the companies completely failed.
To profit from fundamental analysis, you have to be comfortable going against the crowd — or in Wall Street parlance — being a contrarian. When other investors are overly enthusiastic about a stock, they bid the price so high that it’s practically impossible for anyone to make money. A contrarian would not be buying those stocks.
The Fundamental Analysis Toolbox
One of the great things about fundamental analysis is that you don’t really need much to get started. If you have a computer and calculator, you’re pretty much set.
Unlike technical analysis, which may require sophisticated and costly stock chart services, most of the data you need for fundamental analysis is provided free from nearly every company. Plus, many free online services offer increasingly detailed access to company financial data, making it easy for you to download and analyze. There are three key financial documents that are the cornerstone of financial analysis: the income statement, balance sheet, and statement of cash flows.
Introducing the income statement
Want to know how much a company made or lost during a year or a quarter? The income statement is for you. This financial statement steps you through all the money a company brought in and how much it spent to make that money. If you’ve ever read news stories about how much a company earned during a quarter, for instance, the information was taken off the company’s income statement.
The income statement is the financial statement containing data you probably hear the most about, including revenue, net income, and earnings per share. You can find out more about reading this important document in Chapter 5.
Balance-sheet basics
Want to know how much money a company has or how much it owes to others? That’s where the balance sheet comes in. This financial statement spells out all the cash a company has in addition to its debt. The difference between what a company owns (its assets) and what it owes (its liabilities) is its equity. The basic formula is:
Assets = Liabilities + Equity
Sometimes it’s helpful to understand corporate-finance jargon by putting it in personal-finance terms. If you’ve ever calculated your personal net worth by subtracting all your loans from all your savings, you’ve essentially created a balance sheet.
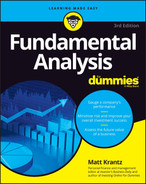
Figure 2-1 shows a favorite way to look at the relationship between assets, liabilities, and equity. Think of the company’s financial position as a square. Next, cut the square in half. The left-hand side of the square, which we’ll call assets, is worth the same as the right-hand side of the square, which we’ll call liabilities and equity. The left-hand side of the square must always equal the right hand side of the square. Remember that liabilities and equity don’t have to equal each other, but together they must equal the assets.

© John Wiley & Sons, Inc.
FIGURE 2-1: A square with three slices is the best way to understand the relationship between assets, liabilities, and equity.
Getting the mojo of cash flows
One of the first things fundamental analysts need to understand is that earnings aren’t necessarily cash. Accounting rules, for instance, allow companies to include in their income statement revenue from products they may have sold to consumers, but haven’t actually collected dollars from customers yet. Yes, you read that right. A company might say it earned $100 million, even though it hasn’t collected a dime from customers. This method of accounting, called accrual accounting, is done for a good reason. Accrual accounting lets analysts see more accurately how much it cost a company to generate sales.
But accrual accounting makes it critical for investors to monitor not just a company’s earnings, but how much cash it brings in. The statement of cash flows holds a company’s feet to the fire and requires it to disclose how much cold, hard cash is coming into the company. The statement of cash flows lets you see how much cash a company generated from its primary business operations. The statement, though, also lets you see how much cash a company brought in from lenders and investors.
Familiarizing yourself with financial ratios (including the P-E)
While the financial statements are enormously valuable to financial analysts, they only go so far. Not only do companies tend to only give the information they’re required to, the data can only tell you so much. You didn’t expect companies to do everything for you, right? That’s how financial ratios can be very important.
Financial ratios take different numbers from the income statement, balance sheet, and statement of cash flows, and compare them with each other. You’ll be amazed at what you can find out about a company by mixing numbers from different statements. Financial ratios can provide great insight when applied to analysis.
There are dozens of helpful financial ratios, which you can read about in more detail in Chapter 8. But at this point, you’ll just want to know the basic flavors and ratios and what they tell you, including:
- Valuation: If you’ve ever heard of the price-to-earnings ratio, or P-E, you’ve used a financial ratio. The P-E is one of many valuation ratios. Valuation ratios help fundamental analysts find out if a stock is cheap or expensive by comparing the stock price to a basic piece of data about a company. For instance, the P-E ratio compares a stock’s price to its earnings. The higher the P-E, the more richly valued a stock is.
- Financial health: If a company is no longer a going concern and isn’t functioning, it’s not a great idea to invest in it. Some ratios, called liquidity ratios, measure how easily a company is able to keep up with its bills. Fundamental analysts will look for red flags that a company might be about to face some tough times.
- Return on investment: If you’re going to give your money to a company, either as a loan or investment, you want to make sure you’re getting enough in return. Return on investment ratios help you determine how well the company is putting your money to work.
- Operating performance: The more a company can increase its sales, while at the same time lowering costs, the more profitable it is. This balancing act is the essence of business. And the stakes for investors are huge, because the more profit a company generates, the bigger piece of the pie that’s left for investors. Operating performance ratios let you quickly see how well a company is managing its costs and increasing sales.
All the types of ratios and financial measures in this list are best understood when put into context. Fundamental analysts typically compare financial metrics to those of a company’s rivals. It can be useful to have financial data not just on the company you’re interested in, but on the industry for comparison.