“And you may ask yourself—Well ... how did I get here?”
(Talking Heads, Once In A Lifetime. Remain In Light)
“Unconventional monetary policy.” You might have heard it many times, but it’s a misleading term.
What mainstream media and consensus call “unconventional” is and has been the most conventional policy of the past 600 years: to try to solve structural imbalances and macroeconomic problems through inflationary measures; creating money out of thin air.
Printing money, of course, is not exactly what the major central banks have been doing. What they have been doing in the past eight years is more complex. The idea of using the apparently endless balance sheet of a nation’s central bank to absorb government bonds and similar instruments to free up banks’ capacity and allow them to lend more to Small and Medium Enterprises (SMEs) and families has a logic—but only when it is a temporary measure to provide liquidity, reduce unwarranted risk perception, and return to normal. The idea seemed good at the time. Until the “temporary” and “extraordinary” measures became the norm.
And therein lies the problem. Monetary policy is nothing more than a short-term tool, but it does not solve structural imbalances. At best, as Mr. Mario Draghi, president of the European Central Bank (ECB), reminds every time he speaks, it is a measure that buys time and allows governments and other economic agents to sort out problems, mostly derived from excess debt and poor capital allocation.
But even the most carefully planned program creates significant perverse incentives. The most obvious one is to make the same mistakes repeatedly.
By the end of 2015, more than 25 central banks in the world were following the same path: “Easing,” or, lowering interest rates and increasing money supply.
After eight years, more than $24 trillion of fiscal and monetary expansion, and over 650 rate cuts, the balance is certainly disappointing. It was very easy to get in the liquidity trap of endless cheap money, and in this book, we will explore how to escape from it unharmed.
Let us look at the results achieved from years of stimulus and hundreds of rate cuts:
At 3.1 percent, the year 2016 saw the poorest global GDP growth since the crisis.
The U.S. growth is the poorest of any recovery and half of its potential, with labor participation at 1978 levels.1
World trade has fallen to 2010 levels.2
Global debt has ballooned to an all-time high of $152 trillion, or 225 percent of world GDP.3
Rise in government debt as a percentage of GDP from 2007 to 2015:
-
United States, from 64 percent in 2007 to 105 percent in 2015
-
China, from 35 to 45 percent
-
Eurozone, from 65 to 97 percent
-
Japan, from 183 to 230 percent4
Meanwhile, the largest bubble in bonds ever seen was created, with $11 trillion of negative-yielding bonds issued and high yield at the lowest rate in 30 years.5
Yet the media calls this a success.
Are these the results anyone would have expected from a massive monetary stimulus? Clearly not.
While media and consensus economists were calling for devaluation policies to increase exports, these have stalled;6 and the boost to global growth ended at the weakest level in decades.
But ... How Did We Get Here?
Through the same measures that we have used to “tackle the crisis.”
We got here doing exactly what the media is offering as “the solution”—a massive expansion of credit and money supply. If we ask any economist in the world about the origins of the financial crisis, they will immediately answer pointing out to “excess leverage” and “too much risk” as the causes. However, this is partially true, because those were effects, not causes.
The origin of this crisis,7 like every other financial crisis in history, was the massive increase in risk generated by manipulating the amount or price of money; in this case, it was lowering interest rates artificially.
Crises are not generated in assets that the public or economic agents perceive as risky, but in those where the consensus is that the risk is very low. In 2008 it was housing; in 2016 it is bonds.
In the origin of all financial crises, we see the stubborn determination of governments and central banks of ignoring economic cycles as if monetary policy will change them—the magical idea that imbalances will be solved by perpetuating and increasing those same imbalances. Excess debt and misallocation of capital are not problems that will be solved by lower interest rates and more liquidity; in fact, those measures simply prolong the same course of action by economic agents.
Low interest rates and high liquidity fuel the fire; they don’t extinguish it. At best, the measure should be aimed at helping deleverage and cutting the chain of risk taking while the economy recovers, but that does not happen. The incentive for misallocation of capital is too large.

Figure 1.1 Historical chart of the effective Federal Funds Rate. From 2001 to 2006 interest rates were dramatically lowered
Creating money, lowering interest rates, forcing credit growth at any cost, and increasing money supply are the same measures, just with different tools. In the years 2001 to 2008 the excessive risk taking was promoted by central banks and governments’ lowering interest rates dramatically;8 the conduit for debt-fueled growth was the private sector, with the financial system as the facilitator. See Figure 1.1. Money was too cheap to ignore.
After September 11, 2001, the U.S. Federal Reserve began to inflate credit supply to try to prevent an economic crisis. Low interest rates, which reached around 1 percent in 2003, made commercial banks and other financial agents have excess cash to lend even to individuals with poor solvency ratios (what we called “subprime”).
The largest originators of these loans were two public-sector entities, Freddie Mac and Fannie Mae. See Figure 1.2. Were the banks reckless and taking unwarranted risk? No. The public and expert opinions were that housing was a safe bet. The safest bet, actually. It was a low-risk and very liquid asset that could be sold at a higher price quickly if the borrower could not meet payments.

Figure 1.2 Value of mortgage-backed security issuances in $trillions, 1990 to 2009
Source: Securities Industry and Financial Markets Association (SIFMA) statistics.
The process by which this credit was generated violated the traditional principles of bank management. Or did it? Banks invested in long-term assets (mortgages) the funds they received in the form of short-term debt (public deposits), hoping to meet these short-term obligations by repaying in the interbank money markets. The reason to do this was the widespread perception that the asset was liquid and very profitable because the underlying (real estate) demand was virtually inelastic and prices would not drop, and, if they did, it would be by a very small amount.
The result of it was a brutal credit expansion fueled by the relentless message that houses were a secure and ever-rising asset. Like all bubbles, this one lasted longer than any skeptic could have imagined, making even the most doubtful of analysts question their position. Rising demand for credit meant higher housing prices, which in turn led to more risky mortgages and the prospect of higher returns. Liquidity was such that economic and financial agents would absorb any asset, no matter how speculative it was, because the risk seemed inexistent and prices kept rising. It seemed there was never enough supply of home and risky assets.
Household debt went from 100 percent of disposable income to 160 percent, and suitably, house prices doubled.9
By 2004 many borrowers began to experience difficulties in repaying their loans, but demand remained healthy and house prices were slowing down, but not falling. The bubble was bursting, but the consensus was that it was no real issue. Credit for housing exceeded 20 percent of all outstanding credit. However, by early 2007 reality started to kick in and the chain of nonperforming loans started to explode, as household debt exceeded disposable income by more than 60 percent and thus began a series of massive defaults.
These defaults sank the market value of all the related mortgage loans. Given that banks had to pay for their short-term debts while a substantial part of their income disappeared, a liquidity crisis was generated. As the market value of subprime loans fell further, the liquidity crisis deepened, so much that banks themselves did not want to lend to each other.
The risk of a run on the banks increased, as customers and the general public feared for their deposits.
Central banks decided to come help contain the fire they had created with a massive liquidity injection.
Central banks behaved, again, as the “Pyromaniac Fireman,” as I always say.
I remember when Christine Lagarde, then head of the IMF said, “Central banks have been the heroes of this crisis.”10 She completely ignored the role of the same central banks in fueling the housing bubble by slashing interest rates.
The Federal Reserve launched QE111 and the mirage of growth and stability through monetary policy emerged. But evidence shows that monetary stimulus simply does not work.
In a report titled “A report card for unconventional monetary policy,” Deutsche Bank analyzed in 2016 the impact of “unconventional” monetary policies, quantitative easing (QE), and negative interest rates on the economy.
Studying the impact on manufacturing indexes of these measures from the launch until the end of each unconventional policy, the bank found the following results:
-
In eight of the twelve cases analyzed, the impact on the economy was negative.
-
In three cases, it was completely neutral.
-
The measures only worked in the case of the so-called QE1 in the United States, and fundamentally because the starting base was very low and the United States became a major oil and gas producer.
How do you evaluate if QE and negative interest rates are working? When I discuss this with clients, I sometimes get the response that QE and negative interest rates are working well because the payment systems are running and the financial system still functions. But the issue is not if computers can deal with negative interest rates. The issue is if QE and negative rates have been supporting the economy. The conclusion is that U.S. QE1 had an impact but in all other cases the impact of QE and negative interest rates has been insignificant. And in 8 out of 12 cases, the economic impact has been negative. Once again, there is too big of a burden on monetary policy and it is time for fiscal and structural policy to step up and begin to support GDP growth.12
The fact that in eight out of twelve cases the impact was negative speaks for itself.
Would it have been worse if these measures had not been implemented? The debate is open, but I will make my own analysis. Kenneth Rogoff states, “QE was worth taking the added risk entailed by having more short-term debt. But as the recession abates, the calculus of risk and benefit changes.”13
My view is somewhat different. I use risk compared to reward and I get to the conclusion that it would not have made much difference compared to a short-term liquidity injection measure targeted exclusively to the banks. The Troubled Asset Relief Program (TARP),14 which created incentives to restructure banks while at the same time generating profits for the government, would have been more than enough, and the other negatives would have been avoided.
At the end of the day, when we measure the success or failure of a particular policy we must have a clear analysis of the negative and positive effects achieved with it. Assuming that household income and employment would have worsened if such measures had not been implemented is more than questionable. In fact, looking at the examples of both the European Union (EU) and the United States immediately prior to QE and QE1, we can see that the economy had already bottomed out and started to bounce.15
Other important factors that help us know if things would have “really” worsened had it not been for monetary stimulus are money velocity, investment (capex or capital expenditure), and debt. While none of them have improved since the implementation of nonconventional measures, we simply cannot assume that they would have deteriorated much more than they have in the past years.
What about inflation? The same. Combating deflation in itself is no evident requirement. But if monetary stimulus of the size and period as the ones implemented does not even do it, the “it would have been worse” argument does not stack up.
Four Trillion for Nothing
“Money for nothing and chicks for free” (Dire Straits, Money For Nothing, Brothers In Arms).
We mentioned before the negatives generated by monetary stimulus.
Which negatives?
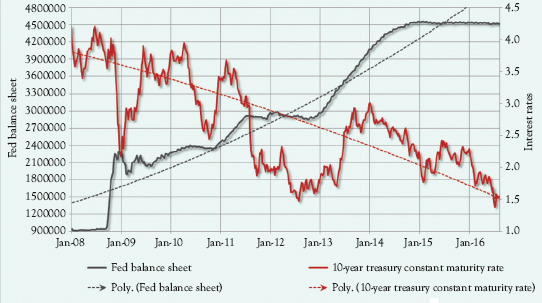
Figure 1.3 Fed Balance Sheet vs. Interest Rates
Source: Realinvestmentadvice, Bloomberg.
Let us remember what was promised to support the massive stimulus plan:
The White House predicted an average growth in the economy of 4 to 4.5 percent, unemployment would drop to 5 percent, and the budget deficit would shrink to a mere 3.5 percent of GDP.
During the Obama administration and the implementation of massive expansionary policies of three QE programs and ultra-low rates (see Figure 1.3), economic growth was a mere average of 1.4 percent. That compares to an average 3.5 percent with Reagan, 3.9 percent with Clinton, and 2.1 percent with Bush Jr.16
The recovery growth gap, compared to other recoveries since 1960, has been set at $1.67 trillion. That means the weakest recovery in recent history, as well as an economic growth that has stalled at almost half of the promised growth. The Federal Reserve expected 1.9 percent growth for 2016 going to 2 percent in 2018, the weakest relative to potential and previous recoveries.
All of this is after a massive $4.7 trillion monetary stimulus and $10 trillion in new debt, a fiscal deficit increase of $13 trillion at state, local, and federal levels. Public debt ballooned from 48 to 75 percent of GDP. Average annual deficit was 5.2 percent.
Quantitative easing was launched under four premises: provide liquidity to reduce the risk of contagion after the financial crisis; add jobs; inflation; and growth.
Its first objective was clear and worked. Unfortunately, it went from solving a problem of liquidity to creating the largest bubble in financial history: high-yield bonds at the lowest interest rate seen in 30 years, and stocks at all-time highs, exceeding fundamental valuations and real earnings growth.
But job creation was a success. Or was it? Unemployment at 4.6 percent and 9.3 million jobs created. Though good, these employment figures are far from what is expected of the world’s leading economy after a $24.7 trillion fiscal and monetary stimulus. Under President Reagan 12.6 million jobs were created; under Clinton, 21 million. Even with massive crisis, Bush Jr. saw 5.7 million jobs created.
On the one hand, more than 11 million people are out of the labor force, leaving the labor participation rate at 1978 levels. Some argue that it is explained by demographics, but that is incorrect. The United States and the United Kingdom have similar demographics; yet the former’s labor force participation is almost ten points lower. In addition, labor force participation rate has fallen in almost all segments of age, including the important segment of 25 to 35 years.17
A total of 94.6 million working-age Americans are not participating in the system or looking for a job. That shows a labor participation rate of 62.8 percent—not seen since 1978. In addition, the number of U.S. citizens who supplement their income with food stamps has doubled from 20 million to more than 40 million.
Temporary employment stands at 18.2 percent (less than 35 hours per week)—a level that is considered as like recessionary periods. In times of growth, the United States has always had a 16.6 percent lower temporary rate. In the recession of 2001 it was 17 percent and in 2008 the maximum was 20 percent. With the biggest stimulus in history, it has only reduced slightly to 18.2 percent, even with the aforementioned poor labor participation.
Since 2009, while national debt has doubled, the average household income in the United States has fallen in all segments (the median of $ 55,000 to $ 54,000 and the poorest segment from $13,000 to $12,000) and real wages continue to be at 2008 levels.
To top it all, in the last five years, the United States’ annual productivity growth has been 0.6 percent on average, the poorest since 1978.18
Inflation expectations have also been consistently revised down throughout the period.
What is more interesting is that QE has been disinflationary as money velocity has collapsed and capacity utilization remains poor, at 75 percent. The massive creation of money has gone to create huge inflation in financial assets and disinflation in the real economy, laying the grounds for one of the most dramatic imbalances seen between asset classes and industry and consumption since the 70s.
The argument against all this is that “it would have been worse” and that the crisis was too big. None of these arguments work, and sound more like excuses, as other presidents lived through deep crises as well.
But those excuses don’t stack up against the fact that the United States created more than half of all the money supply in its history in the past eight years and has seen the longest period with ultra-low rates.
In summary, the Federal Reserve’s policy has generated results that range from disappointing liquidity to complete failure in terms of jobs, growth, and inflation—but it leaves behind a massive bubble in financial assets that will not be easily sorted.
“You can do anything you want to do, Do what you want” (Phil Lynott)
“Monetary laughing gas.” I have been using this term for a number of years because the effect on the real economy, the healing power of monetary policies is simply a placebo effect. It does not solve the problems of the economy, it just sugarcoats it with the elusive “wealth effect.”
What is “wealth effect”? Devaluation policies, massive liquidity, and lowered interest rates do not help the real economy directly; anyone thinking otherwise is simply fooling himself. But the expected result is that stocks will rise, bond yields will fall, asset prices—particularly home prices—will rise, and this will make citizens feel richer. The “wealth effect.” It would make sense if not for a small problem—it is utter rubbish.
Less than 10 percent of the wealth of U.S. citizens is in stocks and bonds, and most homeowners have large mortgages. In most OECD countries, less than 6 percent of an average family’s wealth is in equities and bonds.
Guess where most of the average citizen’s wealth is? In cash.19 This shows why governments find so appealing the temptation of solving imbalances through devaluation, inflation, and demonetization—eliminating cash, as seen in India, Pakistan, and Venezuela. It is exactly the same as slipping the hand into savers’ pockets to pay for the government’s lunch. Indebted governments benefit from inflation and increasing money in circulation; savers lose purchasing power and their wealth.
Through massive monetary policies, what governments basically do is erode the middle class’s wealth by destroying the value and price of money.
By injecting massive amounts of liquidity into the system, central banks effectively transfer wealth from the savers to indebted governments and to the financial system.
However, most consensus economists will tell you that this is essential to fight deflation.
What is deflation, and is it something negative?
Deflation is, in simple terms, the process by which prices fall.
Deflation is a contraction in the supply of circulated money within an economy, and therefore the opposite of inflation. In times of deflation, the purchasing power of currency and wages are higher than they otherwise would have been. This is distinct from but similar to price deflation, which is a general decrease in the price level, though the two terms are often mistaken for each other and used interchangeably.20
But deflation is also caused by technology and by improvements in productivity, so there should be at least a different way to measure inflation and deflation as positive or negative.
For example, a moderate level of inflation can be positive if the rise in prices comes from higher wages, better growth, and a healthier improvement in consumption patterns. It comes as a result of tightening supply and better demand and, most importantly, it does not attack purchasing power as wages improve.
However, when inflation comes from the increase in the price of commodities essential for energy supply, such as oil or coal, and the rise in food prices, it does not generate any positive effect. That is why most economists look at core inflation—excluding food and energy—as a more robust means of analyzing inflation. Additionally, even core inflation rises can be negative if—as we have seen almost every time in the past two decades—real wages do not rise and purchasing power is eroded.
Have you ever seen anyone leaving a supermarket shouting, “Damn, prices have fallen again?” Never.
There has never been a single citizen in the world that has complained about lower prices. Yet consensus Keynesian economists will tell you it’s the worst thing in the world.
Why?
Inflation is taxation without legislation.21
When inflation rises, debts fall. And the most benefitted are the indebted entities that can increase their prices as well with inflation, because of a semimonopolistic nature. That is, government and crony semimonopolistic sectors, those that many countries love to call “strategic sectors.”
It is, therefore, logical, that these entities, particularly governments, do all they can to “combat deflation” even if it is—and it is—against the savings and deposits of their own citizens.
However, there is a case to be made for moderate deflation, as George Selgin, professor of economics at the University of Georgia,22 points out:
Deflation. For many people the word evokes images of the Great Depression, when prices fell dramatically in most of the world. The decline in prices was the counterpart of the collapse in sales, widespread bankruptcies, and the armies of unemployed workers. If a little inflation is the only guarantee against another calamity like that of the thirty, then it is certainly a price that should be paid.
The truth, however, is that deflation does not have to be a recipe for depression. On the contrary, a moderate deflation may be good news, as long as it is the correct type of deflation.
Since the disastrous thirties, economists and central bankers seem to have lost sight of the fact that there are two kinds of deflation-one malignant, the other benign. Malignant deflation, of the type that accompanied the Great Depression, is a consequence of the contraction in spending, corporate profits, and wages. In fact, even in this case, it is not deflation itself which is harmful, but its underlying cause, an inadequate stock of money. The hoarding of money, or its current disappearance (the amount of money in the U.S. economy actually contracted 35 percent between 1930 and 1933), causes demand for goods and services to evaporate. In response, firms are forced to reduce production and lay off workers. Prices fall, not because goods and services abound, but because money is scarce.
Benign deflation is something completely different. It is the result of improvements in productivity, that is to say, times when technological or administrative advances allow the obtaining of greater real quantities of final goods and services with the use of a given amount of land, labor, and capital. Since a rise in productivity is the same as a decrease in production costs, a reduction in prices in the final goods and services due to higher productivity does not imply any fall in the profits of producers or the wages of their workers. The lower costs are matched by lower consumer prices, not by lower wages or revenues. Such deflation—originated in productivity—is good news for the average wage earner.
The case for moderate deflation has been instrumental in the recovery of the EU after the 2008 crisis. The reduction in wages and the employment loss after the crisis were mitigated by price stability, and the strengthening of the currency helped families recover their wealth, mostly accumulated in bank deposits, quickly, before 2012. Had the EU decided to resort to the historical measures of massive competitive devaluations, the impact of higher unemployment with rising prices would have impoverished families further. This is not a counterfactual argument—it is the evidence of years of incorrect monetary policies from the part of peripheral European countries.
Between 1980 and 1996, all peripheral European countries used constant devaluations as a form of trying to improve competitiveness and reduce imbalances. However, despite a devaluation of more than 60 percent to the U.S. dollar, Greek fiscal deficits averaged 7.3 percent of annual GDP deficit in the 20 years before entering the EU, and unemployment multiplied by four.23
In Spain, the local currency depreciated more than 50 percent against the U.S. dollar in the same period; public spending doubled in real terms; inflation tripled (an average annual Consumer Price Index (CPI) rate of 7.2 percent); and unemployment did not fall from 15 percent—in fact it was above 20 percent for half of the period.24
These projects of competitive devaluations did not work even though national and international conditions were propitious, since the world growth was higher and with much less debt than in 2010–2016.
The crisis of 2008 did not come from lack of stimulus, but from the excess of it.
To look back at the same mistakes made in the past as the solution does not work.
Central banks, in the period before and after the crisis, have played the role of the pyromaniac fireman, creating the conditions for the crisis and offering the same tools to solve it.
For an investor, or somebody interested in economics, there are a few lessons to be drawn, particularly in the face of significant changes in the course of policy making:
-
Always look at real changes in the economy relative to the imbalances created.
-
Always analyze the improvements or weakening of the economy relative to the amount of debt accumulated and the changes in microeconomic metrics.
-
Always analyze consensus estimates with a critical eye. Consensus and major economic bodies have traditionally missed their estimates due to overly optimistic predictions.25
-
Being overly pessimistic is as dangerous as being excessively optimistic. Cycles happen, and investors must understand these cycles to profit from expansionary periods without taking them for granted.
-
Massive debt and large monetary imbalances make economic cycles shorter and more abrupt, so the investor’s mind and the holding period have to be adjusted accordingly.
1 Labor force participation 62.7% in 2016, growth expectations were halved by the Federal Reserve from January to December 2016.
2 World Trade Organization (WTO), December 2016.
3 International Monetary Fund (IMF) Global Outlook.
4 World Bank, 2015.
5 Bloomberg, November 2016.
6 Global exports growth 2010–2016 flat, according to WTO.
7 Recommended reading: The Origin of Financial Crises: Central Banks, Credit Bubbles, and the Efficient Market Fallacy (October 29, 2008) by George Cooper.
8 Since 2008 we have seen more than 650 cuts to interest rates (Alex Dryden at JP Morgan Asset Management).
9 Bank of International Settlements (BIS).
10 “In many ways, the central banks have been the heroes of the worldwide financial crisis,” Lagarde Jackson Hole, Wyoming, 2013.
11 Quantitative Easing: using the Central Bank balance sheet to purchase government bonds and mortgage-backed securities to free space in banks’ balance sheets to improve lending to the real economy.
12 Torsten Slok, Deutsche Bank, “A report card for unconventional monetary policy” November 2016.
13 Kenneth Rogoff, “Was quantitative easing best way to boost U.S. economy?” March 2015.
14 TARP was a program to purchase toxic assets from financial institutions to strengthen the U.S. financial sector. It generated a profit for the government of almost 20 billion US$ from the $426.4 billion invested.
15 U.S. employment and GDP growth, same with EU.
16 Average annual GDP growth.
17 Labor Statistics, November 2016.
18 All data from 2008 to 2016 from official figures.
19 Average of the OECD is 80 percent.
20 Investopedia.
21 Milton Friedman.
22 A Case For Moderate Deflation, Cato Policy Report, May 2003.
23 Michael Mitsopoulos, Understanding the Crisis in Greece: From Boom to Bust. 2011. Palgrave Macmillan.
24 Juan Rallo, The Failure of Competitive Devaluations.
25 In the past 30 years, the IMF, Federal Reserve, ECB, and the Bank of Japan (BOJ) have missed their own estimates more than 80 percent of the time. Ned Davis explains in “Being Right or Making Money” (2000, Ned Davis Research) that international organizations’ average hit in their expectations is 26 percent and, more importantly, that they have a historical upward bias, that is, they tend to err on the side of optimism, not for being prudent.