
|
|

In this chapter, we’ll see how the different aspects of the data scientist fit together organically to form a certain process that defines his work. We will see how the data scientist makes use of his qualities and skills to formulate hypotheses, discover noteworthy information, create what is known as a data product and provide insight and visualizations of the useful things he finds, all through a data-driven approach that allows the data to tell its story. The whole process is quite complicated and often unpredictable, but the different stages are clearly defined and are straightforward to comprehend. You can think of it as the process of finding, preparing and eventually showcasing (and selling) a diamond, starting from the diamond mine all the way to the jewelry store. Certainly not a trivial endeavor, but one that’s definitely worth learning about, especially if you value the end result (and know people who can appreciate it). Let us now look into the details of the process, which includes data preparation, data exploration, data representation, data discovery, learning from data, creating a data product and, finally, insight, deliverance and visualization (see Fig 11.1).
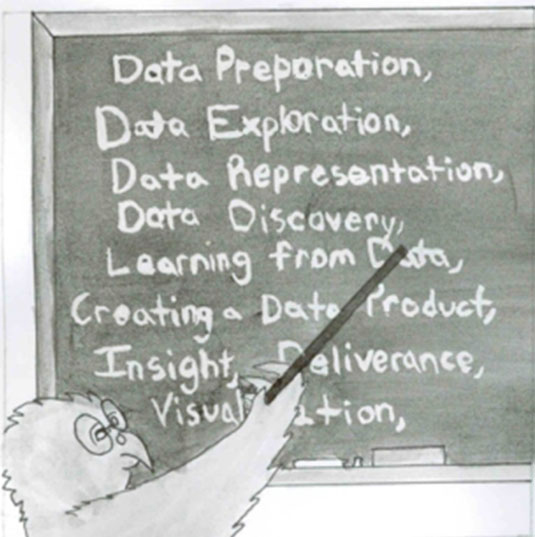
Fig. 11.1 Different stages of the data science process.
Note that understanding this process and being able to apply it is a fundamental part of becoming a good data scientist.
11.1 Data Preparation
Data preparation is probably the most time-consuming and uninteresting part of the data science process, partly because it involves minimal creativity and little skill. However, it is a very important step, and if it doesn’t receive the attention it needs, you will have problems in the steps that follow. In general, data preparation involves reading the data and cleansing it. This is the first step in turning the available data into a dataset, i.e. a group of data points, usually normalized, that can be used with a data analysis model or a machine learning system (often without any additional preprocessing). There are datasets for a variety of data analysis applications available in data repositories that are often used for benchmarking machine learning algorithms, the most well-known of which is the UCI machine learning repository, which we’ve already noted as a good place to find practice problems.
Reading the data is relatively straightforward. However, when you are dealing with big data, you often need to employ an HDFS to store the data for further analysis and the data needs to be read using a MapReduce system (if you use Hadoop or a similar big data ecosystem). The latter will help in both entering the data into an HDFS cluster and also in employing a number of machines in that cluster to cut down the required time significantly. Fortunately, there are premade programs for doing all this, so you will not need to write a lot of code for reading your data. However, you may need to supply it in .JSON or some other similar format type. Also, if your data is in a completely custom form, you may need to write your own program(s) for accessing and restructuring it into a format that can be understood by the mappers and the reducers of your cluster. This is a very important step, especially if you want to save resources by implementing the optimum data types for the various variables involved. More on that sub-process in the data representation subchapter later on.
When reading a very large amount of data, it is wise to first do a sample run on a relatively small subset of your data to ensure that the resulting dataset will be useable and useful for the analysis you plan to perform. Some preliminary visualization of the resulting sample dataset would also be quite useful as this will ensure that the dataset is structured correctly for the different analyses you will do in the later stages of the process.
Cleansing the data is a very time-consuming part of data preparation and requires a level of understanding of the data. This step involves filling in missing values, often removing those records that may contain corrupt or problematic data and normalizing28 the data in a way that makes sense for the analysis that ensues. To comprehend this point better, let us examine the rationale behind normalization and how distributions (mathematical models of the frequency of the values of a variable) come into play.
When we think of data, particularly relatively large amounts of data, we often use distributions to map them in our minds. Although the most commonly used distribution is the normal distribution (N), there are several others that often come into play such as the uniform distribution (U), the student distribution (T), the Poisson distribution (P) and the binomial distribution (B) among several others (see Fig. 11.2 for examples. Distribution B was omitted as it is the discreet version of distribution N). Of course, a group of data points may not follow any one of these distributions, but in order to make use of the various statistical tools that have been developed over the years, we often make use of one of these distributions as a template for the data we have. Normalization enables us to see how the data we have fits these distributions and whether a data point is an outlier or not (i.e., whether it has an extreme value for a given distribution). Note that normalization applies only to numeric data, particularly continuous variables.
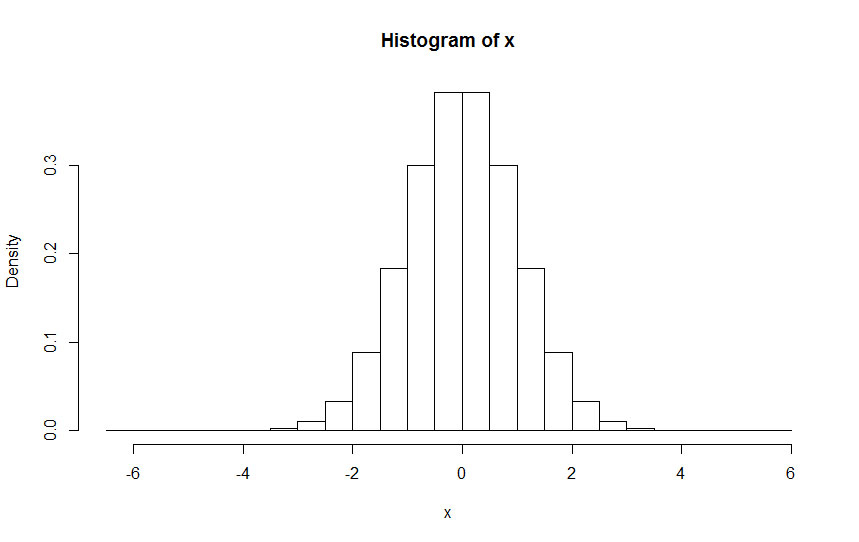
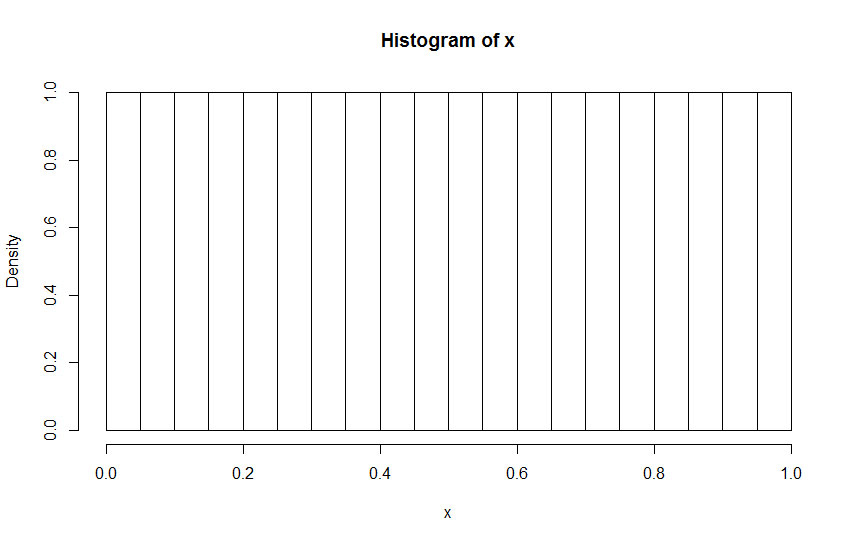

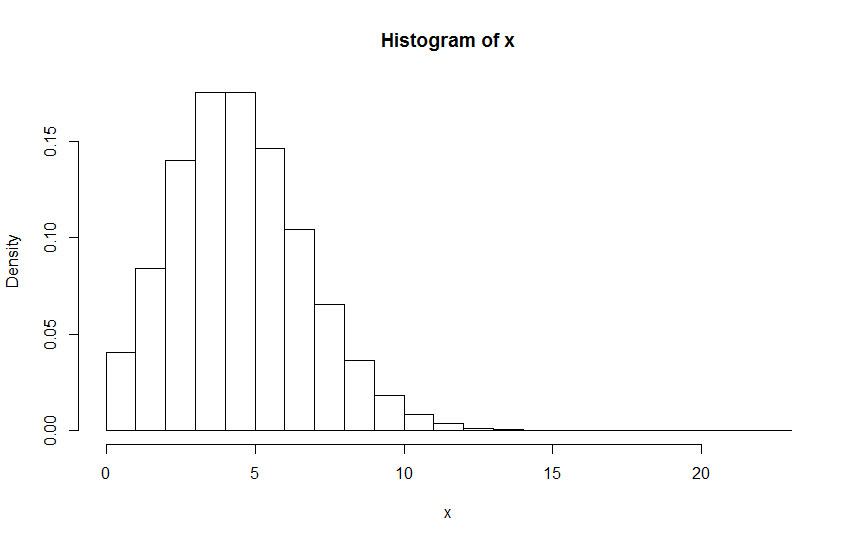
Fig. 11.2 Histogram examples of different distributions. From top to bottom: Normal, Uniform, Student and Poisson.
Cleansing the data also involves dealing with many of these outliers (in rare cases, all of them). This means that they may need to be removed or the model may need to be changed to accommodate their existence. This is a call you need to make as there is no fool-proof strategy for this kind of situation; sometimes outliers are useful to include in your analysis. What you decide depends on factors such as the number of extreme data points and the types of variables that make up your data. Also, whether or not you remove any outliers depends on how sensitive your model is to their existence. Normally, when dealing with big data, outliers shouldn’t be an issue, but it depends on their values; extremely large or small values may affect the basic statistics of the dataset, especially if there are many outliers in it.
Normalizing your data will sometimes change the shape of its distribution, so it makes sense to try out a few normalizing approaches before deciding on one. The approaches that are most popular are:
- Subtracting the mean and dividing by the standard deviation, (x – μ) / σ. This is particularly useful for data that follows a normal distribution; it usually yields values between -3 and 3, approximately.
- Subtracting the mean and dividing by the range, (x – μ) / (max-min). This approach is a bit more generic; it usually yields values between -0.5 and 0.5, approximately.
- Subtracting the minimum and dividing by the range, (x-min) / (max-min). This approach is very generic and always yields values between 0 and 1, inclusive.
When dealing with text data, which is often the case if you need to analyze logs or social media posts, a different type of cleansing is required. This involves one or more of the following:
- removing certain characters (e.g., special characters such as @,*, and punctuation marks)
- making all words either uppercase or lowercase
- removing certain words that convey little information (e.g., “a”, “the”, etc.)
- removing extra or unnecessary spaces and line breaks
All these data preparation steps (and other methods that may be relevant to your industry), will help you turn the data into a dataset. Having done that, you are ready to continue to the next stages of the data science process. Make sure you keep a record of what you have done though, in case you need to redo these steps or describe them in a report.
11.2 Data Exploration
After the data has been cleaned and shaped into a useful and manageable form, it is ready to be processed. First, some exploration of it is performed to figure out the potential information that could be hiding within it. There is a common misconception that the more data one has, the better the results of the analysis will be. A data scientist, however, does not embrace this belief. It is very easy to fall victim to the illusion that a large dataset is all you need, but more often than not such a dataset will contain noise and several irrelevant attributes. All of these wrinkles will need to be ironed out in the stages that follow, starting with data exploration.
According to Techopedia (www.techopedia.com), “data exploration is an informative search used by data consumers to form true analysis from the information gathered.” It involves carefully selecting which data to use for a particular data analysis task from the data warehouse in which the dataset is stored. It can be thought of as the manual approach to searching through the data in order to find relevant or necessary information. The alternative to this, employing an automatic approach to the same objective, is data mining. Note that data exploration and data mining can also be performed on an unstructured pool of data. Quite often, data exploration is done in parallel to data preparation. It is an essential prerequisite to any analysis that ensues.
The big advantage of human-based data exploration over data mining is that it makes use of a human being’s intuition. Sophisticated data mining algorithms may work well with some datasets and are very efficient, but they may not always pinpoint certain key aspects of the dataset that an individual (particularly one who is familiar with the data domain) may spot through a data exploration approach. Ideally, a data scientist will do both types but will rely primarily on the data exploration approach.
11.3 Data Representation
Data representation is the step of the data science process that comes right after data exploration. According to the McGraw-Hill Dictionary of Scientific & Technical Terms, it is “the manner in which data is expressed symbolically by binary digits in a computer.” This basically involves assigning specific data structures to the variables involved and serves a dual purpose: completing the transformation of the original (raw) data into a dataset and optimizing the memory and storage usage for the stages to follow. For example, if you have a variable that takes the values 1, 2, 3, etc., then it would be more meaningful to allocate the corresponding data into an integer data structure rather than a double or a float one. Also, if you have variables that take only two values (true or false), it makes sense to represent them with a logical data structure. Note that regardless of how you represent your data, you can always switch from one data type to another if necessary (e.g., in the case where you want to merge a Boolean variable with a few numeric ones for a regression model).
All this may seem very abstract to someone who has never dealt with data before, but it becomes very clear once you start working with R or any other statistical analysis package. Speaking of R, the data structure of a dataset in that programming platform is referred to as a data frame, and it is the most complete structure you can find as it includes useful information about the data (e.g. names, modality, etc.). However, certain Python libraries also employ this kind of structure. R also allows for names for the variables that make up the dataset in an easily accessible field, making the whole data analysis process that follows much more user-friendly and straightforward, even for beginners.
11.4 Data Discovery
Data discovery is the core of the data science process. Although there is no definition on which everyone agrees, data discovery can be seen as the process that involves finding patterns in a dataset through hypothesis formulation and testing. It makes use of several statistical methods to prove the significance of the relationships that the data scientist observes among the variables of the dataset or among different clusters of data points (i.e., how unlikely each is to happen by chance). In essence, it is the only known cure to the problem that plagues big data: too many relationships! Data discovery enables you to filter out less robust relationships based on statistics and also throw away the less meaningful relationships based on your judgment.
Unfortunately there is no fool-proof methodology for data discovery although there are several tools that can be used to make the whole process more manageable. How effective you are regarding this stage of the data science process will depend on your experience, your intuition and how much time you spend on it. Good knowledge of the various data analysis tools (especially machine learning techniques) can prove very useful here.
Data discovery can be quite overwhelming, especially when dealing with complex datasets, so it makes sense to apply some data visualization, which we will examine in more depth in a separate subchapter later on. Good knowledge of statistics will definitely help as it will enable you to focus most of your energy on the intuitive aspect of the process. In addition, experience with scientific research in data analysis will also prove to be priceless in this stage.
11.5 Learning from Data
Learning from data is a crucial stage in the data science process and involves a lot of intelligent (and often creative) analysis of a dataset using statistical methods and machine learning systems. In general, there are two types of learning: supervised and unsupervised. The former involves any system or algorithm that helps a computer learn how to distinguish and predict new data points based on a training set, which it uses to understand the data and draw generalizations from. The latter has to do with enabling the computer to learn on its own what the data structure can reveal about the data itself; this is done through the use of certain evaluation metrics that help the computer know when it has found a worthy result. The results of this type of learning are often used afterwards in supervised learning.
It may seem that using unsupervised and supervised learning may guarantee a more or less automated way of learning from data. However, without feedback from the user/programmer, this process is unlikely to yield any good results for the majority of cases. (This feedback can take the form of validation or corrections/tweaks that provide more meaningful results.) It is possible, though, for the process to be quite autonomous for a specific type of problem that has been analyzed extensively or in the case of deep learning networks. It is good to remember that all of these are quite robust tools, but it is the user of these tools (the data scientist) that makes them useful and able to yield worthy results consistently. For example, artificial neural networks (ANNs), a very popular artificial intelligence tool that emulates the way the human brain works, are a great tool for supervised learning, but if you don’t know how to use them properly, they are bound to yield poor results and/or require extensive amounts of time to learn from a dataset.
Another point to keep in mind is that some data learning tools are better than others for specific problems even if all of them could work on a dataset prepared in the previous stages of the data science process. Knowing which tool to use can make the difference between a successful data analysis and a poor one; something to keep in mind at all times.
11.6 Creating a Data Product
All of the aforementioned parts of the data science process are precursors to developing something concrete that can be used as a product of sorts. This part of the process is referred to as creating a data product and was defined by influential data scientist Hilary Mason as “a product that is based on the combination of data and algorithms.”29
Let’s elaborate on this simple but dense definition. A data product is something a company can sell to its clients and potentially make a lot of money from because it is something that can be supplied in practically unlimited quantities for a limited cost. So it can be quite valuable. Why? Because it provides useful information to these organizations. How? It takes data that these organizations have (and value) and applies an intelligent data processing method (the algorithms that Ms. Mason mentions) to extract this information from it. Why? Because that’s what data science does and why it is useful in today’s information-driven world. So a data product is not some kind of luxury that marketing people try to force us to buy. It is something the user cares about and could find good use for, something that has a lot of (intelligent) work behind it, something that is tailored for every particular user (information consumer). So it is something worth building and something worth paying for.
Typical examples of data products are all the network statistics and graphs that LinkedIn provides to its members (particularly its premium and golden members); the results pages of a good search engine (i.e., one that provides relevant results based on your query and adds useful metadata to them such as how popular and how reliable the webpages are); a good geographic information system, such as MapQuest, that provides useful geographic information overlaid on the map of the place(s) you are querying, etc. Note that many data product providers don’t ask you for money in exchange for what they offer. Also note that the vast majority of them are online.
A data product is not something new though. Data products have been around since the dawn of data technologies. Even printed newspapers can be seen as a data product of sorts. However, today’s data products are a bit different. They make use of big data in one way or another and do so in an extremely fast manner. This is accomplished through the use of efficient algorithms and parallel computing; in other words, data science.
Not all of the various outputs that the learning algorithms yield, based on the processed data you feed them, turn into data products. A data scientist picks the most useful and most relevant of his results and packages them into something that the end user can understand and find useful. For example, through rigorous data analysis of the various features of the car industry, you may discover several useful facts about modern cars and their road behavior. The average user may not be interested in how many cylinders there are in an SUV, especially if they live outside the US. If, however, you tell that user that the average fuel efficiency of his car is X and that it fluctuates over this range over the time of the day in such and such ways, and that by avoiding these routes he can save about X gallons per week, and that this translates into X dollars saved, based on the current fuel prices, then he may want to listen to you and pay a premium for this information. So a data product is similar to having a data expert in your pocket who can afford to give you useful information at very low rates due to the economies of scale employed.
To create a data product, you need to understand the end users and become familiar with their expectations. You also need to exercise good judgment on the algorithms you will use and (particularly) on the form that the results will take. You need to strip any technical jargon that they may not comprehend from the resulting information and make the product as straightforward as possible. Imagination is key here.
Graphs, particularly interactive ones, are a very useful form in which to present information if you want to promote it as a data product (more on that in the subchapter that follows). In addition, clever and simple-to-use applications can be another form of a data product. And these are just the beginning. Who knows what form data products will take in the years to come? As long as you have something worthwhile and interesting to say based on the data, when it comes to ways of promoting this to a user, the sky is the limit.
11.7 Insight, Deliverance and Visualization
Other aspects of the data science process that make the results more comprehensible to everyone and more applicable to the company include insight, deliverance and visualization. Apart from the creation of data products, described in the previous subchapter, data science involves research into the data, the goal of which is to determine and understand more of what’s happening below the surface and how the data products perform in terms of usefulness to the end users, maintainability, etc. This often leads to new iterations of data discovery, data learning, etc., making data science an ongoing, evolving activity, oftentimes employing the agile framework frequently used in software development today.
In this final stage of the data science process, the data scientist delivers the data product he has created and observes how it is received. The user’s feedback is crucial as it will provide the information he needs to refine the analysis, upgrade it and even redo it from scratch if necessary. Also in this stage, the data scientist may get ideas on how he can generate similar data products (or completely new ones) based on the users’ newest requirements. This is a very creative part of the data science process and one that provides very useful experience since the learnings from these activities are what distinguish an experienced professional from the data science amateur (who may be equally skilled and be a very promising professional, nevertheless, but lack the intuition of the experienced professional). So pay close attention to this stage.
Visualization involves the graphical representation of data so that interesting and meaningful information can be obtained by the viewer (who is oftentimes the end user). Visualization is usually part of data product creation, but it also comes about afterwards. It is a way of summarizing the essence of the analyzed data graphically in a way that is intuitive, intelligent and oftentimes interactive. It is intuitive because it keeps the terminology and the overwhelming quantity of numbers at bay, allowing the data scientist to think differently about the data by employing a more holistic perspective. This is similar to data exploration, in a way, but also quite different. When in the data exploration stage you don’t know what you are going to find so you are broader in your search. When you are in the final stage of the data science process, you have a deeper understanding of what’s going on and know what is important in the data. For example, when exploring your data, you may find that for describing the health of oranges the features weight and softness are good, while length of stem is an irrelevant feature. When in the visualization stage of your analysis, you may be able to delineate the exact boundaries of the normal class of healthy oranges and pinpoint the structure of this class, as well as the characteristics of the unhealthy oranges, based on each one of these features and their combinations.
Through visualization, you become more aware of what you don’t know (there are more known unknowns than unknown unknowns in the puzzle) and are therefore able to handle the uncertainty of the data much better. This means that you are more aware of the limitations of your models as well as the value of the data at hand. Still, you have accomplished something and can show it to everyone through some appealing graphs. You may even be able to make these graphs interactive, providing more information about what is going on. In essence, visualization makes your models come to life and tell their own story, which may contain more information than what is reflected in the numbers you got from them and used in the data products. This is akin to what traditional (core) research is all about.
This stage of the data science process is also quite enjoyable as there is room for improvisation and making use of some attractive software designed specifically for this purpose. Still, it is not the graphs you generate that make this process interesting and useful; it is what you do with them. A good data scientist knows that there may still be something to discover, so these graphs can bring about insight, which is the most valuable part of the data science process. This translates into deeper understanding and usually to some new hypotheses about the data. You see the dataset anew, armed not only with the understanding that you have gained, but with an open mind as well. You question things again, even if you have a good idea of what’s happening, in order to get to the bottom of them based on the intuition that there is something more out there.
This insight urges you to start over without throwing away anything you’ve done so far. It brings about the improvements you see in data products all over the world, the clever upgrades of certain data applications and, most importantly, the various innovations in the big data world. So this final stage of the data science process is not the end but rather the last part of a cycle that starts again and again, spiraling to greater heights of understanding, usefulness and evolution. You can take advantage of this opportunity to write about what you have done and what you are planning to do, then share it with your supervisors to show them that you have done something worthwhile with the resources that you have been given and that you are eager to continue making good use of your time. Sounds like a win-win situation, doesn’t it?
11.8 Key Points
- The main parts of the process can be summarized in the following seven steps:
- Data Preparation. Data preparation involves getting the data ready for analysis through cleansing and normalization of the numeric variables. It also involves recognizing the format of the data and accessing it accordingly.
- Data Exploration. “Data exploration is an informative search used by data consumers to form true analysis from the information gathered” (www.Techopedia.com). This stage has to do with searching through the data for meaningful patterns, pinpointing useful aspects of it (features), creating provisional plots of it and generally obtaining an understanding of what’s going on and what information may be lurking within the dataset.
- Data Representation. This is “the manner in which data is expressed symbolically by binary digits in a computer” (McGraw-Hill Dictionary of Scientific & Technical Terms). It is related to assigning specific data structures to the variables involved, effectively transforming the (raw) data into a proper dataset. Also essential for good memory resource management.
- Data Discovery. This has to do with discovering patterns in the available dataset through hypothesis formulation and testing. It entails a lot of statistics, as well as common sense, to make sense of the data and find useful aspects of it to work with.
- Data Learning. This is related to an intelligent analysis of the discovered patterns through the (often creative) use of statistics and machine learning algorithms. It aims to make something practical and useful out of these patterns and forms the basis of the data product(s) to follow.
- Creating a Data Product. This involves the most important aspect of the process: creating something useful out of the data and sharing it with other people in the form of a product. A data product is defined as “a product that is based on the combination of data and algorithms” (Hilary Mason).
- Insight, Deliverance and Visualization. This has to do with delivering the data product to the end user (as well as receiving feedback and fine-tuning or making plans for upgrading the product), visualizing the processed data to highlight the findings and investigate other aspects of the dataset and deriving insight from all these in order to start a new cycle of data science in this or another dataset.