
|
|

Being a data scientist entails using certain software, some of which we discussed in previous chapters of this book. This software covers the basic technical know-how that you need in order to apply for a data scientist position. The actual position may go beyond the initial job description as is often the case in IT jobs. That’s good, in a way, because it provides opportunities for learning new things, which is an integral part of being in the fascinating field of data science.
In this chapter, we will explore the types of software that are commonly used in a data science setting. Not all of these programs will be used in the data scientist position you will get, but being aware of them may help you understand your options better. In particular, we will examine the Hadoop suite and a few of its most promising alternatives (such as Spark, Storm, etc.), the various object-oriented programming languages that come into play (Java, C++, C#, Ruby and Python), the data analysis software that is available (R, Matlab, SPSS, SAS or Stata), the visualization program that you may have installed and the integrated big data system (e.g., IBM’s BigInsights, Cloudera, etc.) that may be available for you to use. We’ll also see other programs that you may encounter such as GIT, Excel, Eclipse, Emcien and Oracle. Note that this list of software will give you an idea of what to expect although it may not reflect the actual programs you will be using; some companies may require specialized software for their industry, which you will be probably be asked to get acquainted with as soon as you are hired. Familiarity with most of the software in this list should make it a relatively easy and straightforward task for you.
8.1 Hadoop Suite and Friends
Hadoop has become synonymous with big data software over the past few years; it is the backbone of a data scientist’s arsenal. It is important to know that Hadoop is not just a program, but more like a suite of tools (similar to MS Office). This suite is designed to handle, store and process big data. It also includes a scheduler (Oozie) and a metadata and table management framework (HCatalog). All data processing jobs in Hadoop are distributed over the computer cluster on which you have Hadoop installed. These jobs can be object-oriented programming (OOP) code, data analysis programs, data visualization scripts, or anything else that has a finite process time and is useful for the data analysis task. Hadoop makes sure that whatever you want to do with your data is done efficiently and is monitored in a straightforward way.
Hadoop does not have a particularly user-friendly software environment, as you can see in Fig. 8.1 where a screenshot of a typical Hadoop job is shown.

Fig. 8.1 Screenshot of a Task Dashboard in Hadoop.
The Hadoop suite is comprised of the following modules, all of which are important:
- MapReduce – created by Google, this is the main component of Hadoop; as mentioned in a previous part of this book, it is the heart of any big data technology. Although it is inherently linked with Hadoop, it can also be found in other big data programs such as MPP and NoSQL databases (e.g., MongoDB). Although MapReduce was originally proprietary, after generous funding by Yahoo in 2006 it emerged as an open source implementation via Hadoop, reaching “Web scale” two years later. One of the most well-known algorithms for parallel computing, it makes use of a computer cluster to query a dataset, break it down into pieces and process it over the various nodes of the cluster.
- HDFS – short for Hadoop Distributed File System, this is the file system that Hadoop uses. For anything to be processed by Hadoop, it has to be imported to the HDFS, where it is backed up across the network of the computers the Hadoop installation runs on. Its data limit is approximately 30 PB.
- Pig – a high-level programming language for the various Hadoop computations. You can view it as the control module of the various operations of the Hadoop ecosystem. Its capabilities are extensible.
- Hive – a data warehouse program with SQL-like access, designed for data spread over the Hadoop computer cluster. Its capabilities are extensible.
- HBase, Sqoop and Flume – the database components of Hadoop. HBase is a column-oriented database that runs on a layer on top of the HDFS. It is based on BigTable by Google and has a data limit of about 1 PB. Also, it is somewhat slower than directly accessing the data on the HDFS. Not that great for processing data stored in it, HBase is good for archiving and counting time-series data. Sqoop is a program that enables importing data from relational databases into HDFS. Flume is similar although it focuses on collecting and importing log and event data from various sources.
- Mahout – a library of machine learning and data mining algorithms used for processing data stored in the HDFS.
- Zookeeper – Hadoop has a whole bestiary of components, so a configuration management and coordination program is imperative. Zookeeper ensures that the whole suite remains integrated and relatively easy to use.
There are also a few other components of the Hadoop suite that are supplementary to these core ones. The best way to familiarize yourself with them is to download Hadoop and play around with it. If you prefer, you can read a tutorial instead (or, even better, a manual) while trying to solve a benchmark problem.
Hadoop is not your only option when it comes to big data technology. An interesting alternative that is not as well known as it should be is Storm (used by Twitter, Alibaba, Groupon and several other companies). Storm is significantly faster than Hadoop, is also open source and is generally easy to use, making it a worthy alternative. Unlike Hadoop, Storm doesn’t run MapReduce jobs, running topologies instead. The key difference is that a MapReduce job ends eventually, while a topology runs forever or until it is killed by the user. (You can think of it as a background process that runs on your OS throughout its operation). The topology can be visualized as a graph of computation, processing data streams. The sources of these data streams are called “spouts” (symbolized as taps), and they are linked to “bolts” (symbolized by lightning bolts). A bolt consumes any number of input streams, does some processing and potentially emits new streams. You can see an example of a Storm topology in Fig. 8.2.

Fig. 8.2 Example of a Topology in the Storm Software, a worthwhile Hadoop alternative. Creating a topology like this one is somewhat easier and more intuitive than a MapReduce sequence.
A topological approach to data processing guarantees that it will produce the right results even in the case of failure (since topologies run continuously), meaning that if one of the computers in the clusters breaks down, this will not compromise the integrity of the job that has been undertaken by the cluster. It should be noted that Storm topologies are programs usually written in Java, Ruby, Python and Fancy. The Storm software is written in Java and Clojure (a functional language that works well with Java), and its source code is the most popular project on this type of technology.
The advantages of this software are its ability to process data in real-time; its simple API; the fact that it’s scalable, fault tolerant, easy to deploy and use, free and open source and able to guarantee data processing; and that it can be used with a variety of programming languages. It also has a growing user community, spanning over the West and East Coasts of the USA as well as London and several other places.
Although Storm is a very popular and promising Hadoop alternative, providing flexibility and ease of use, there are other players boasting of similar qualities that also challenge Hadoop’s dominance in the big data world. The most worthwhile ones (at the time of this writing) are:
- Spark – developed by the UC Berkeley AMP lab, Spark is one of the newest players in the MapReduce field. Its aim is making data analytics fast in both writing and running. Unlike many systems of the field, Spark allows in-memory querying of data instead of just using disk I/O. As a result, Spark performs better than Hadoop on many iterative algorithms. It is implemented in Scala (see next section) and, at the time of this writing, its main users are UC Berkeley researchers and Conviva.
- BashReduce – being just a script, BashReduce implements MapReduce for standard Unix commands (e.g., sort, awk, grep, join, etc.), making it a different alternative to Hadoop. It supports mapping/partitioning, reducing and merging. Although it doesn’t have a distributed file system at all, BashReduce distributes files to worker machines with an inevitable lack of fault-tolerance, among other things. It is less complex than Hadoop and allows for more rapid development. Apart from its lack of fault-tolerance, it also lacks flexibility because BashReduce only works with certain Unix commands. BashReduce was developed by Erik Frey (from the online radio station last.fm) and his associates.
- Disco Project – initially developed by Nokia Research, Disco has been around for several years without becoming well known. The MapReduce jobs are written in simple Python, while Disco’s backend is written in Erlang, a scalable functional language with built-in support for concurrency, fault tolerance and distribution, making it ideal for a MapReduce system. Similar to Hadoop, Disco distributes and replicates data, but it doesn’t have its own file system. The job scheduling aspect of this system is also good since it’s very efficient.
- GraphLab – developed at Carnegie Mellon and designed for machine learning applications, GraphLab aims to facilitate the design and implementation of efficient and correct parallel machine learning algorithms. GraphLab has its own version of the map stage, called the update phase. Unlike MapReduce, the update phase can both read and modify overlapping sets of data. Its graph-based approach makes machine learning on graphs more controllable and improves dynamic iterative algorithms.
- HPCC Systems – with its own framework for massive data analytics, HPCC makes an attempt to facilitate writing parallel-processing workflows through the use of Enterprise Control Language (ECL), a declarative, data-centric language (somewhat similar to SQL, Datalog and Pig). HPCC is written in C++, making in-memory querying much faster according to some people. HPCC is a promising alternative to Hadoop since it has its own distributed file system.
- Sector/Sphere – developed in C++, this system promises high performance 2-4 times faster than Hadoop. It is composed of two parts: Sector, a scalable and secure distributed file system, and Sphere, a parallel data processing engine that can process Sector data files on the storage nodes with very simple programming interfaces. It has good fault-tolerance, WAN support and is compatible with legacy systems (requiring few modifications). It is a worthy alternative to Hadoop that has been around since 2006.
Parallel to all these systems, there are several projects that can facilitate the work undertaken by Hadoop, working in a complimentary way, so if you are going to learn Hadoop, you may want to check them out once you’ve got all the basics down. The most well-known of these projects are the following:
- Drill – this is a Hadoop add-on that focuses on providing an interface for interactive analysis of the datasets stored in the Hadoop cluster. It often makes use of MapReduce to perform batch analysis on big data in Hadoop, and through Dremel it is capable of handling much larger datasets very fast. This is possible through its ability to scale to a very large number of servers (its design goal is at least 10000 of them), making it a good option if you plan to work with really big data. A good tool to look into, particularly if you plan to use Hadoop.
- D3.js – short for Data Driven Documents, D3.js is an open source JavaScript library that enables you to manipulate documents that display big data. This collection of programs can create dynamic graphics using Web technologies (e.g., HTML5, SVG and CSS). Also, it provides many visualization methods such as chord diagrams, bubble charts, dendrograms and node-link trees. Due to the fact that it is open source, this list is constantly expanding. D3.js was designed to be very fast and compatible with programs across various hardware platforms. Although it may not replace a full-blown data visualization program (see subchapter 8.4), it is a good add-on to have in mind. D3.js was developed by Michael Bostock, a New York Times graphics editor.
- Kafka – a messaging system originally developed at LinkedIn to serve as the basis for the social medium’s activity stream and operational data processing pipeline. Since then, its user base has expanded, encompassing a variety of different companies for various data pipeline and messaging uses. It is quite efficient and integrates well with the Hadoop ecosystem. It is run on Java across any operating system.
- Julia – this is actually more of a data analysis tool, but it is designed to be run in a distributed computing environment such as Hadoop. It is robust, easy to use, similar to Matlab and R (see subchapter 8.3), and very fast. It’s a worthy add-on to the Hadoop suite and, if you are inclined towards programming, a good language to add to your programming skill-set.
- Impala – a distributed query execution engine designed to run against data that is stored natively in Apache HDFS and Apache HBase. Developed by Cloudera, it focuses on databases and does not make use of MapReduce at all. This allows it to return results in real-time since it avoids the overhead of MapReduce jobs.
8.2 OOP Language
A data scientist needs to be able to handle an object-oriented programming (OOP) language and handle it well. Comparing the various OOP languages is beyond the scope of this book, so for the sake of example, Java will be discussed in this subchapter as it is well-known in the industry. Just like most OOP languages, Java doesn’t come with a graphical user interface (GUI), which is why many people prefer Python (which does come from its developers with a decent GUI). However, Java is very fast and elegant, and there is abundant educational material both online and offline. A typical Java program can be seen in Fig. 8.3.

Fig. 8.3 A Typical Java program for determining if a year is a leap year. The program is viewed in an editor that recognizes Java code.
Note that the highlighting of certain words and lines is done by the editor automatically (though this is not always the case, e.g., when using Notepad). Also, spacing is pretty much optional and is there to facilitate the user of this script. Note that most programs tend to be lengthier and more complicated than this simple example, yet they usually can be broken down to simple components like the one shown here.
Programming can be soul-crushing if you need to allocate a lot of your time to writing the scripts (usually on a text editor like Notepad++ or Textpad). To alleviate this, several integrated development environments (usually referred to as IDEs) have been developed over the years. These IDEs provide an additional layer to the programming language, integrating its engine, compiler and other components in a more user-friendly environment with a decent GUI. One such IDE, particularly popular among Java developers, is Eclipse (see Fig. 8.4), which also accommodates several other programming languages and even data analysis packages like R.
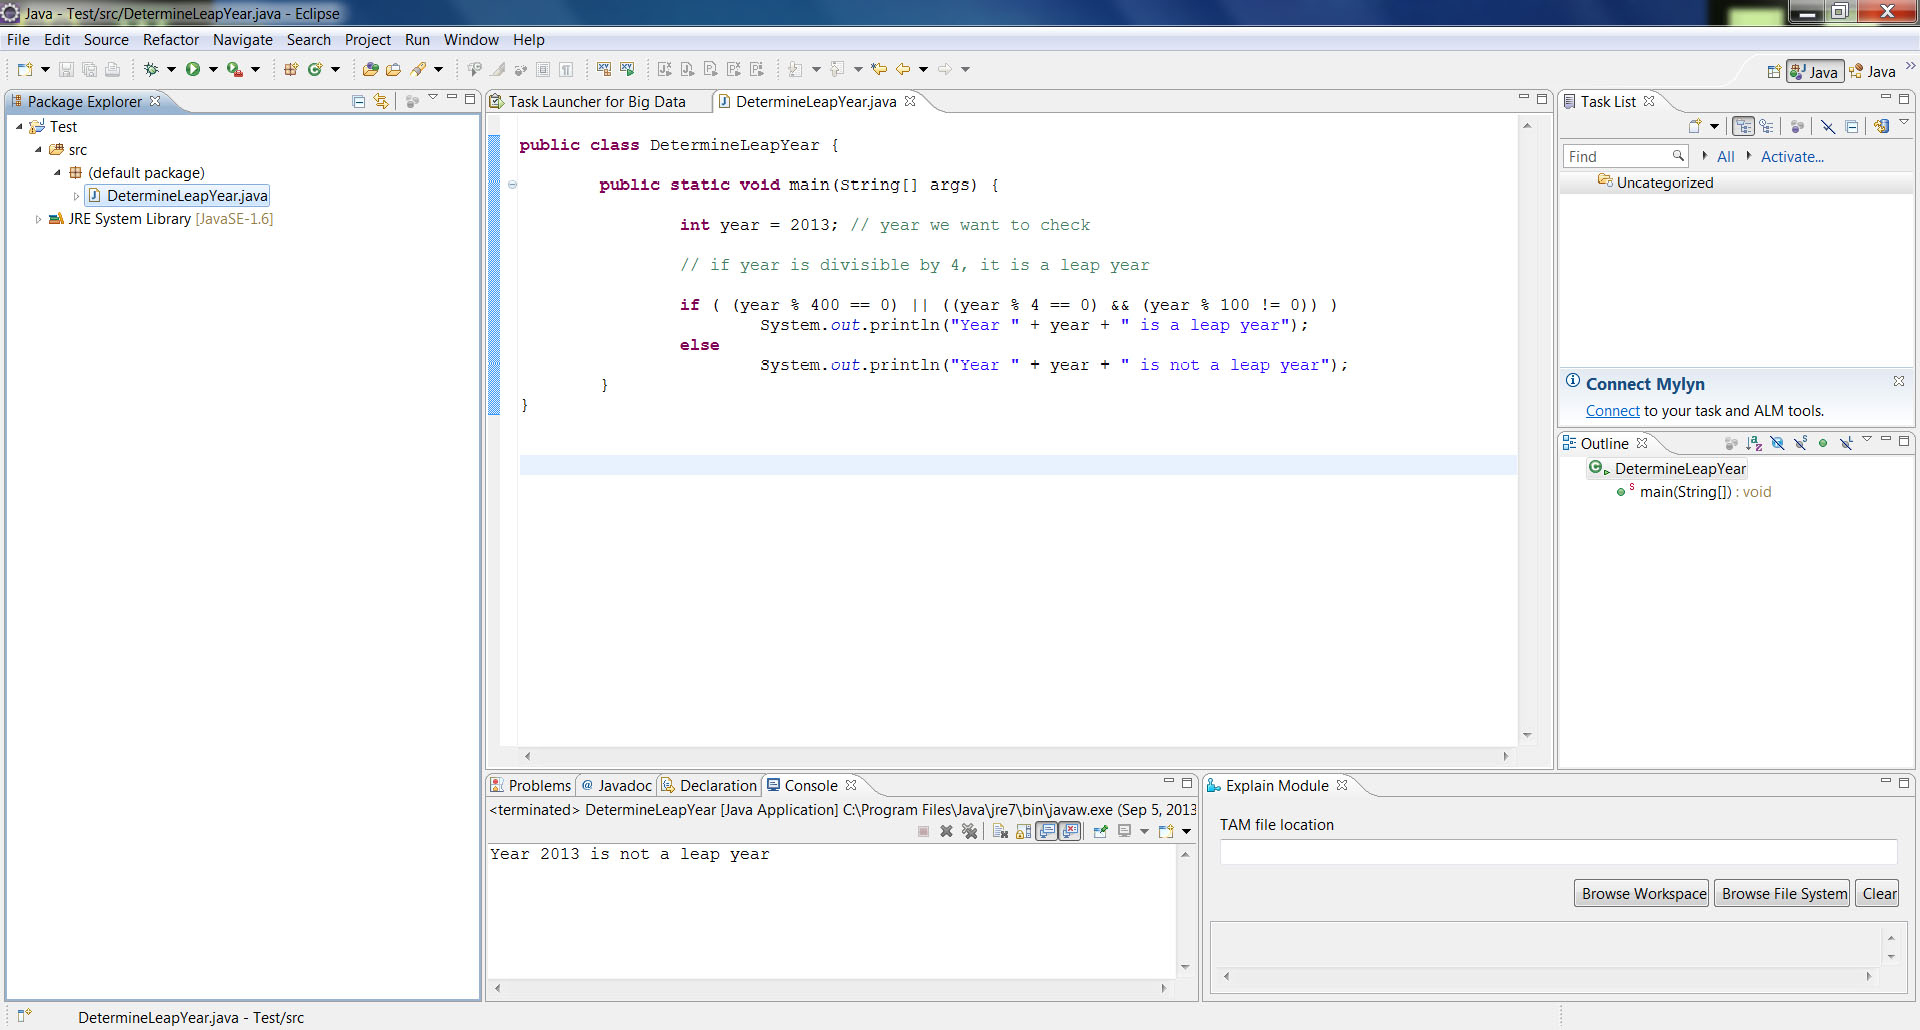
Fig. 8.4 Screenshot of Eclipse Running Java. Eclipse is an excellent Java IDE (suitable for other programming languages as well).
Other OOP languages you may want to consider are:
- C++ – an equally good language as Java, very popular and fast
- Ruby – a powerful OOP language alternative
- JavaScript – the web-based counterpart of Java
- Python – a good OOP language, especially for beginners
- C# – a popular language in the industry, developed by Microsoft
All of these are free and easy to learn via free tutorials (the IDE of the last one, Visual Studio, is proprietary software, however). Also, they all share some similarities, so if you are familiar with the basic OOP concepts, such as encapsulation, inheritance and polymorphism, you should be able to handle any one of them. Note that all of these programming languages are of the imperative paradigm (in contrast with the declarative/functional paradigm that is gradually becoming more popular). The statements that are used in this type of programming are basically commands to the computer for actions that it needs to take. Declarative/functional programming, on the other hand, focuses more on the end result without giving details about the actions that need to be taken.
Although at the time of this writing, OOP languages are the norm when it comes to professional programming, there is currently a trend towards functional languages (e.g., Haskell, Clojure, ML, Scala, Erlang, OCaml, Clean, etc.). These languages have a completely different philosophy and are focused on the evaluation of functional expressions rather than the use of variables or the execution of commands in achieving their tasks.
The big plus of functional languages is that they are easily scalable (which is great when it comes to big data) and much more error free since they don’t use a global workspace. Still, they are somewhat slower for most data science applications than their OOP counterparts although some of them (e.g., OCaml and Clean) can be as fast as C22 when it comes to numeric computations. If things take a turn for the better in the years to come, you may want to look into adding one of these languages in your skill-set as well, just to be safe. Note that there can be an overlap between functional languages and traditional OOP languages such as those described previously. For example, Scala is a functional OOP language, one that’s probably worth looking into.
8.3 Data Analysis Software
What good would all the programming be for a data scientist if there was nothing to compliment it and give meaning to it? That’s where all the data analysis software comes in. There are several options, the most powerful of which are Matlab and R. Though tempting, there will be no comparison between them as it is usually a matter of preference. Interestingly, they are so similar in their syntax and function that it shouldn’t take you more than two to three weeks to learn one if you know the other at a satisfactory level.
As R is somewhat more popular, mainly due to the fact that it is open source and has a huge community of users that contribute to it regularly, we will focus on it in this book. For those who are more inclined towards Matlab and are familiar with its advantages over R and other data analysis tools, keep an open mind. R also has an edge over other data analysis alternatives and is straightforward to write and run programs in, often without the need to include loops (a programming structure that generally slows down analysis done in a high-level programming language). Instead, it makes use of vector operations, which can also extend to matrices. This characteristic is known as vectorization and makes sense for data analysis scripts only (OOP languages are inherently fast, so loops are not an issue for them).
The R programming environment is very basic (similar to Python, in a way) but still user-friendly enough, especially for small programs. The screenshot in Fig. 8.5 gives you an idea of what the environment is like.

Fig. 8.5 The R Environment (vanilla flavor). As can be seen here, although the programming environment is quite user-friendly, it lacks many useful accessories like an IDE.
R is great as a data analysis tool and its GUI is quite well made. However, if you are serious about using this tool, you’ll need to invest some time in learning and customizing an IDE for it. There are several of them available (most of which are free), but the one that stands out is RStudio (see Fig. 8.6 for a screenshot).

Fig. 8.6 One of the many R IDEs, RStudio. You can see here that in addition to the console (bottom-left window), it also has a script editor (top-left), a workspace viewer (top-right) and a plot viewer (bottom-right) among several other useful features that facilitate writing and running R programs.
Other alternatives to R for data analysis applications are:
- Matlab/Octave – this was the king of data analysis long before R became well-known in the industry. Although Matlab is proprietary, it has a few open source counterparts, the best of which is Octave. Both Matlab and Octave are great for beginners, have a large variety of applications and employ vectorization, just like R. However, the toolboxes (libraries) of Matlab are somewhat expensive, while Octave doesn’t have any at all.
- SPSS – this is one of the best statistical programs available and is widely used in research. Quite easy to learn, it can do any data analysis, though not as efficiently as R. Also, it is proprietary, just like Matlab. It is preferred by academics and industry professionals alike.
- SAS – a very popular program for statistics, particularly in the corporate world. Relatively easy to learn, it also has a good scripting language that can be used to create more sophisticated data analyses. However, it too is proprietary.
- Stata – a good option for a statistical package, Stata is one of the favorite tools of statisticians. Also a proprietary piece of software, it has lost popularity since R became more widespread in the data analysis world.
Note that all of these are proprietary software, so they may not ever be as popular as R or attract as large user communities. If you are familiar with statistics and understand programming, they shouldn’t be very difficult for you to learn; with Matlab, you don’t need to be familiar with statistics at all in order to use it. We will revisit R in subchapter 10.5, where we will examine how this software is used in a machine learning framework.
8.4 Visualization Software
The importance of visualizing the results of a data analysis is hard to overstate. That is why there are some visualization software options available to refine your software arsenal. Although all data analysis programs provide some decent visualization tools, it often helps to have a more specialized alternative such as Tableau, which can make the whole process much more intuitive and efficient (see Fig. 8.7 for a screenshot of this software to get an idea of its usability and GUI).
Tableau is, unfortunately, proprietary software and is somewhat costly. However, it allows for fast data visualization, blending and exporting of plots. It is very user-friendly, easy to learn, has abundant material on the web, is fairly small in size (<100 MB) and its developers are very active in educating users via tutorials and workshops. It runs on Windows (any version from XP onwards) and has a two-week trial period. Interestingly, it is part of the syllabus of the “Introduction to Data Science” course of the University of Washington.

Fig. 8.7 Screenshot of Tableau, an excellent visualization program. As you can see, it’s quite intuitive and offers a variety of features.
In the industry, Tableau appears to have a leading role compared to other data visualization programs. Though more suitable for business intelligence applications, it can be used for all kinds of data visualization tasks, and it allows easy sharing of the visualizations it produces via email or online. It also offers interactive mapping and can handle data from different sources simultaneously.
If you are interested in alternatives to this software, you can familiarize yourself with one or more of the following programs:
- Spotfire – a great product by TIBCO, ideal for visual analytics. It can integrate well with geographic information systems and modeling and analytics software, and it has unlimited scalability. Its price is on the same level as Tableau.
- Qlikview – a very good alternative, ideal for data visualization and drilldown tasks. It is very fast and provides excellent interactive visualization and dashboard support. It has a great UI and set of visual controls, and it is excellent in handling large datasets in memory. However, it is limited by the RAM available (scalability issue) and is relatively expensive.
- Prism – an intuitive BI software that is easy to implement and learn. Focusing primarily on business data, it can create dashboards, scoreboards, query reports, etc., apart from the usual types of plots.
- inZite – an interesting alternative, offering both appealing visualization and dashboards features. Very fast and intuitive.
- Birst – a good option, offering a large collection of interactive visualizations and analytics tools. It can create pivot tables and drill into data with sophisticated, straightforward reporting functions.
- SAP Business Objects – this software offers point-and-click data visualization functionality in order to create interactive and shareable visualizations as well as interactive dashboards. Naturally, it integrates directly with other SAP enterprise products.
Generally, data visualization programs are relatively easy to learn, so this is not an issue when trying to add them in your software arsenal. Before dedicating a lot of time in mastering any one of them, make sure that it integrates well with the other programs you plan to use. Also, take a look at what visualization programs are included in most of the ads for the other programs in which you are interested.
8.5 Integrated Big Data Systems
Although not essential, it is good to be familiar with at least one integrated big data system. One such system, which is quite good despite the fact that it is still in its initial versions, is IBM’s BigInsights platform. The idea is to encapsulate most of the functions of Hadoop into a user-friendly package that has a decent GUI as well. As a bonus, it can also do some data visualization and scheduling, things that are useful to have in an all-in-one suite so that you can focus on other aspects of data science work. BigInsights runs on a cluster/server and is accessible via a web browser. A screenshot of the BigInsights platform can be seen in Fig. 8.8.

Fig. 8.8 IBM’s BigInsights platform running in the Mozilla Firefox browser. As you can see, it has a very good GUI and is quite user-friendly.
The big advantage of an integrated big data system is its GUI, which when combined with good documentation makes the whole system user-friendly, straightforward and relatively easy to learn. Also, as the GUI takes care of all the Hadoop operations, it allows you to focus on more high-level aspects of the data science process, freeing you from much of the low-level programming that’s needed.
An alternative to BigInsights is Cloudera, which is well known in the industry and more robust. Other worthy alternatives include Knime, Alpine Data Labs’ suite, the Pivotal suite, etc. It is quite likely that by the time you read these lines there will be other integrated big data systems available, so be sure to become familiar with what they are and what they offer.
8.6 Other Programs
The above list of programs would be incomplete if some auxiliary ones were not included. These programs may vary from company to company, but they are generally a good place to start when it comes to refining your software arsenal. For example, the GIT version control program is one that definitely deserves your attention since you are quite likely to need one such program, especially if you are going to work on a large project along with other people (usually programmers). You can see a screenshot of its interface and its most commonly used commands in Fig. 8.9.

Fig. 8.9 The GIT version control program. Not the most intuitive program available, but very rich in terms of functionality and quite efficient in its job.
Note that there are several GUI add-ons for GIT available for all major operating systems. One that is particularly good for the Windows OS is GIT Extensions (open source), although there are several GUIs for other OSs as well. This particular GUI add-on makes the use of GIT much more intuitive while preserving the option of using its command prompt (something that’s not always the case with GIT GUIs).
It would be sacrilege to omit the Oracle SQL Developer software since it is frequently used for accessing the structured data of a company whose DBMS is Oracle. Although this particular software is probably going to be less essential in the years to come due to big data technology spreading rapidly, it is still something useful to know when dealing with data science tasks. You can see a screenshot of this program in Fig. 8.10.

Fig. 8.10 The Oracle SQL Developer database software, a great program for working with structured data in company databases and data warehouses.
The key part of this software is SQL, so in order to use it to its full potential, you need to be familiar with this query language. As we saw in an earlier chapter, this is a useful language to know as a data scientist even if you don’t have to use it that much. This is because there are several variants of it that are often used in big data database programs.
Some other useful programs to be familiar with when in a data science position are:
- MS Excel – the well-known spreadsheet application of the MS Office suite. Though ridiculously simple compared to other data analysis programs, it is still used today and may come in handy for inspecting raw data in .csv files, for example, or when creating summaries of the results of your analyses. Just like the rest of the MS Office suite, it is proprietary though there are several freeware alternatives that have comparable functionality to MS Excel (e.g., Calc from Open Office).
- MS Outlook – an equally well-known MS Office suite application designed for handling emails, calendars, to-do lists and contact information. There are several freeware alternatives to it, but it is often encountered in workplaces. It will be very useful to know if you’ll be using it every day for handling internal and external communications, appointments, etc. It is also proprietary.
- Eclipse – as mentioned earlier, this is one of the most popular IDEs for OOP languages as well as other languages (even R). Very robust and straightforward, it makes programming more user-friendly and efficient. It is open source and cross platform.
- Emcien – a good graph analysis program for dealing with complicated datasets, particularly semi-structured and non-numeric ones. A good program to look into if you are interested in more advanced data analysis, particularly graph based. It is not a substitute for other data analysis programs, however, and it is proprietary.
- Filezilla (or any other FTP client program) – useful if you need to transfer large files or require a certain level of security in transferring your files to other locations over the internet. It is open source.
8.7 Key Points
- A data scientist makes use of a variety of programs in his everyday work, the most representative of which are described in this chapter and include: Hadoop/Spark, an OOP language (such as Java), a data analysis platform (such as R), visualization software, an integrated big data system (such as IBM’s BigInsights) and other auxiliary programs (such as GIT and Oracle). Additional programs may be required depending on the company and its industry.
- Hadoop is the Cadillac of big data software, and its suite is comprised of a variety of components, including a file system (HDFS), a method for distributing the data to a computer cluster (MapReduce), a machine learning program (Mahout), a programming language (Pig), database programs (Hive, HBase, etc.), a scheduler (Oozie), a metadata and table management framework (HCatalog) and a configuration management and coordination program (Zookeeper) among others.
- There are several alternatives to the Hadoop suite such as Storm, Spark, BashReduce, the Disco project, etc.
- There are a few programs that can facilitate the work undertaken by Hadoop, working in parallel to it: Drill, Julia, D3.js and Impala among others.
- As a data scientist, you need to be able to handle at least one OOP language such as Java, C++, Ruby, Python, C#, etc. OOP languages are currently the most widespread programming paradigm although lately there has been a trend towards functional languages.
- Functional programming languages (such as Clojure, OCaml, Clean, ML, Scala and Haskell) are good assets to have, particularly if you are good at programming and want to expand your programming skill-set.
- You must be intimately familiar with at least one of the data analysis tools that are used nowadays: R, Matlab/Octave, SPSS, SAS or Stata. Of these only R and Octave are open source, with the former being the most popular choice overall.
- Tableau is one of the best choices for data visualization software although there are several other worthy alternatives such as Spotfire, Qlikview, Brist, inZite, Prism and SAP Business Objects.
- Big data integrated systems, such as IBM’s BigInsights platform, are also worth looking into since they make the whole data science process more efficient and insulate you from much of the low-level programming required for MapReduce.
- Some other programs worth familiarizing yourself with are GIT (or any other version control program), Oracle, MS Excel, MS Outlook, Eclipse, Emcien and Filezilla (or any other FTP client program). Naturally, the more programs you know (even programs not included in this list), the better off you are, provided you know them well enough and they are useful in a business setting.