
8
Test Automation for Performance
Performance testing ensures the speed, stability, and scalability of a software application and helps to verify the behavior of an application in various possible user scenarios. Even with considerable technological advancements, many software applications fail to produce the desired performance for users during peak traffic. Therefore, it is imperative that performance testing is done early enough in the application life cycle to provide critical feedback to the stakeholders and to maintain usability at elevated levels.
There are various performance testing tools on the market to choose from, and each one has its own capabilities. Some examples are JMeter, LoadRunner, and Kobiton. In this chapter, we will be working hands-on to gain an understanding of setting up and running performance tests using JMeter. These are the main topics we will be looking at in this chapter:
- Getting started with JMeter
- Automating a performance test
- Java essentials for JMeter
- Considerations for performance testing
Technical requirements
To get functional with JMeter, we need Java installed on our machine. Currently, JMeter works with JDK 8 and JRE 8 or higher.
Getting started with JMeter
Let’s begin with a basic understanding of JMeter, what it does, and how to install it.
What is JMeter and how does it work?
JMeter is a performance-testing application built using Java. It is a completely free and open source tool created by Apache, and it can be used to performance test a wide variety of applications, including APIs and databases. JMeter’s capabilities can be extended by a range of plugins that it supports. JMeter simulates multiple user load on the test application and sends requests to the server. When the server responds to each of the incoming requests, JMeter collects the response and the associated stats and displays them in a report utilizing tables and graphs. The test plan is one of the primary components of JMeter, and it comprises a user-configured series of steps to be run as part of a load test. JMeter provides options to execute a test plan via a GUI or through the command line.
Let’s start by downloading and installing JMeter.
Installing JMeter
Let’s look at the steps involved in the installation of JMeter:
- The first step in the installation of JMeter is to check the Java version on your machine. This can be done using the java -version command. As shown in Figure 8.1, this command prints out the JDK version:
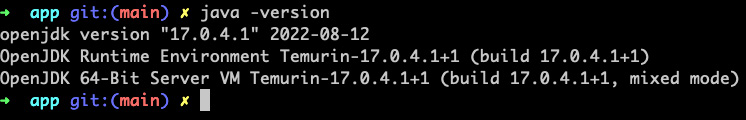
Figure 8.1 – Checking the Java version
- The next step is to download the JMeter binary. The file for download can be found on the JMeter website, https://jmeter.apache.org/download_jmeter.cgi. In this case, I am downloading the binaries zip file for version 5.5, as shown in Figure 8.2.
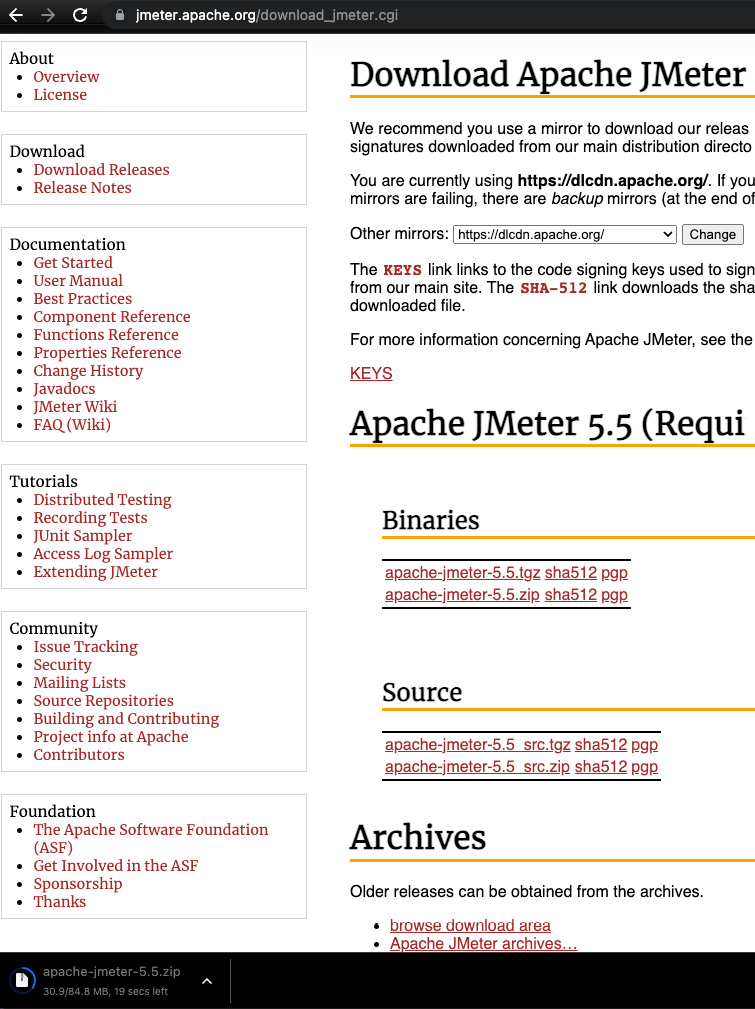
Figure 8.2 – JMeter downloads page
- Once the download is complete, move the zipped file to the desired local folder and unzip it. This should create a new folder in the same location within which all the contents are extracted.
JMeter can now be started with the sh jmeter.sh command from the bin folder of the application. This brings up the application in a separate window, as shown in Figure 8.3.
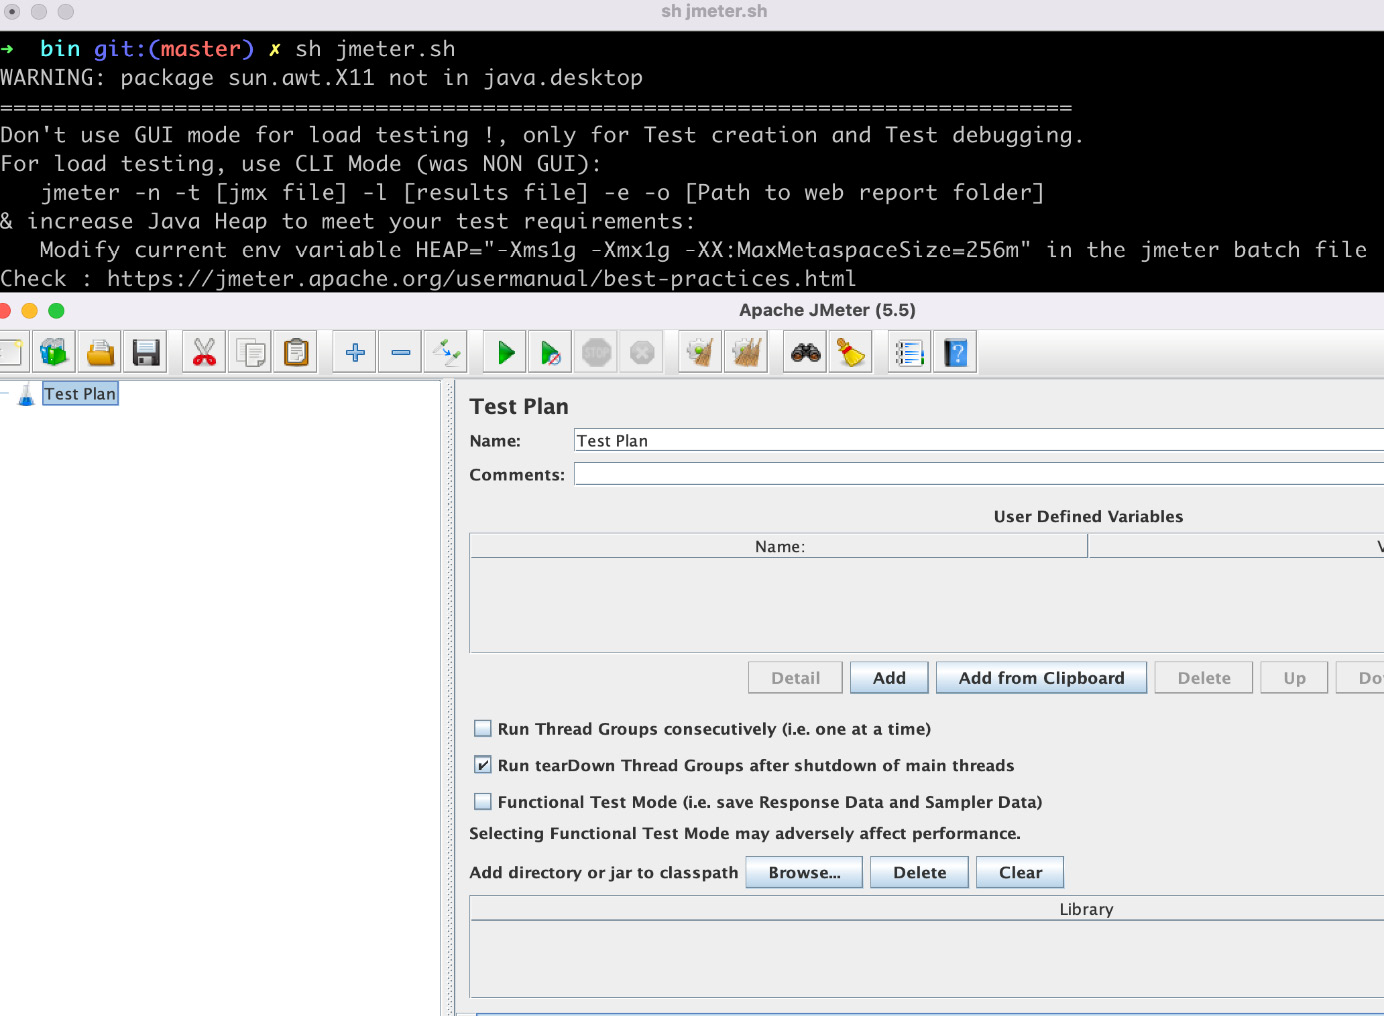
Figure 8.3 – Starting JMeter
JMeter comes with a simple GUI that contains the following components:
- Menu bar: Contains a collection of high-level options to set up and configure various aspects of the tool
- Tool bar: Contains frequently used tools
- Test plan tree view: Groups all components that are added within a test plan
- Editor section: Provides options to edit the selected component from the test plan view
In the next section, let’s look at how to create our first performance test in JMeter.
Automating a performance test
JMeter provides an intuitive GUI that we can use to create and configure performance tests. The test plan is at the core of a performance test, and we start by creating one. We can do this by either using the New option from the menu bar or the tool bar. We looked at the new Test Plan window in Figure 8.3 when launching the JMeter application.
Building and running our first performance test
One of the primary focuses of a performance testing tool is its ability to simulate multiple users. This is accomplished in JMeter by configuring a thread group. As shown in Figure 8.4, this is done via the Thread Group option under Test Plan.
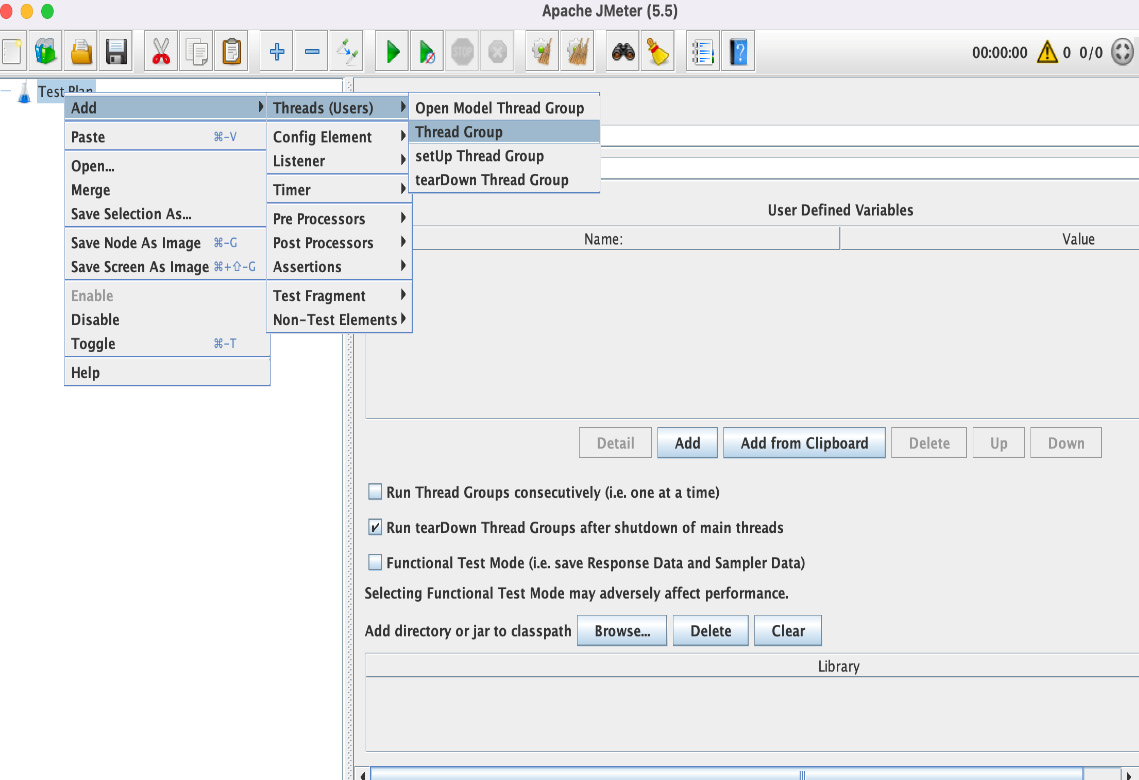
Figure 8.4 – New thread group
We use a combination of three parameters to achieve the required pacing for our performance test:
- Number of Threads: The number of parallel users to be simulated in this test
- Ramp-up period: The time taken to simulate the specified number of users
- Loop Count: The number of iterations to be executed as part of the current test
There are additional settings to configure and fine-tune the load on the test, as shown in Figure 8.5.
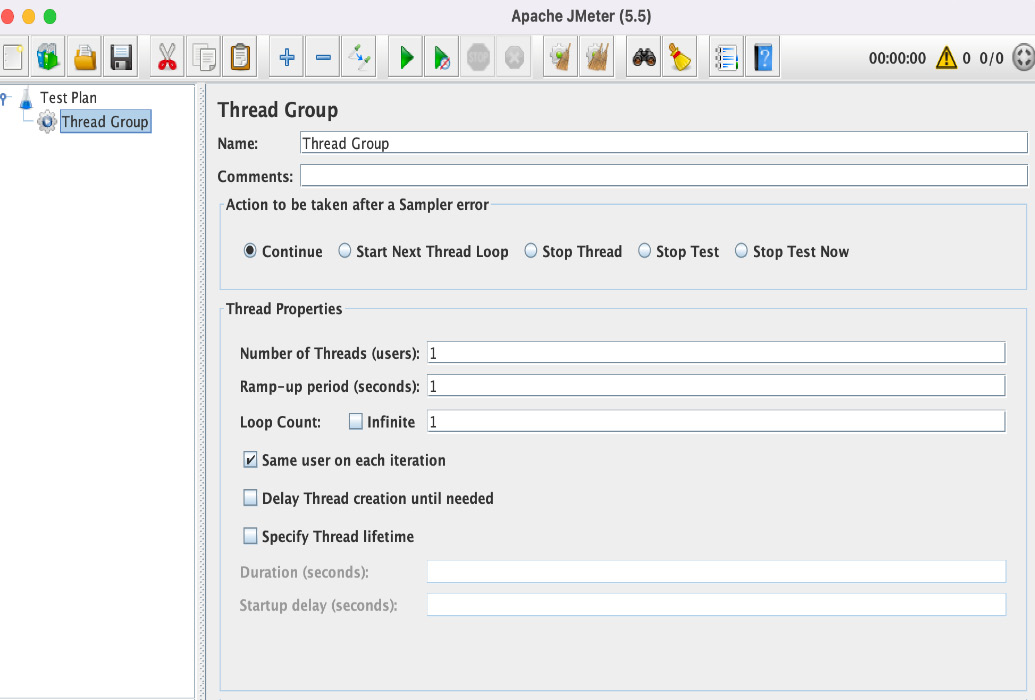
Figure 8.5 – Thread Group configuration
The next step is to add a sampler to the test plan. A sampler is nothing but a test added in JMeter. Figure 8.6 shows the list of the samplers supported by JMeter. Let’s now add a simple HTTP sampler for our test. We can then use the HTTP editor to configure our test.
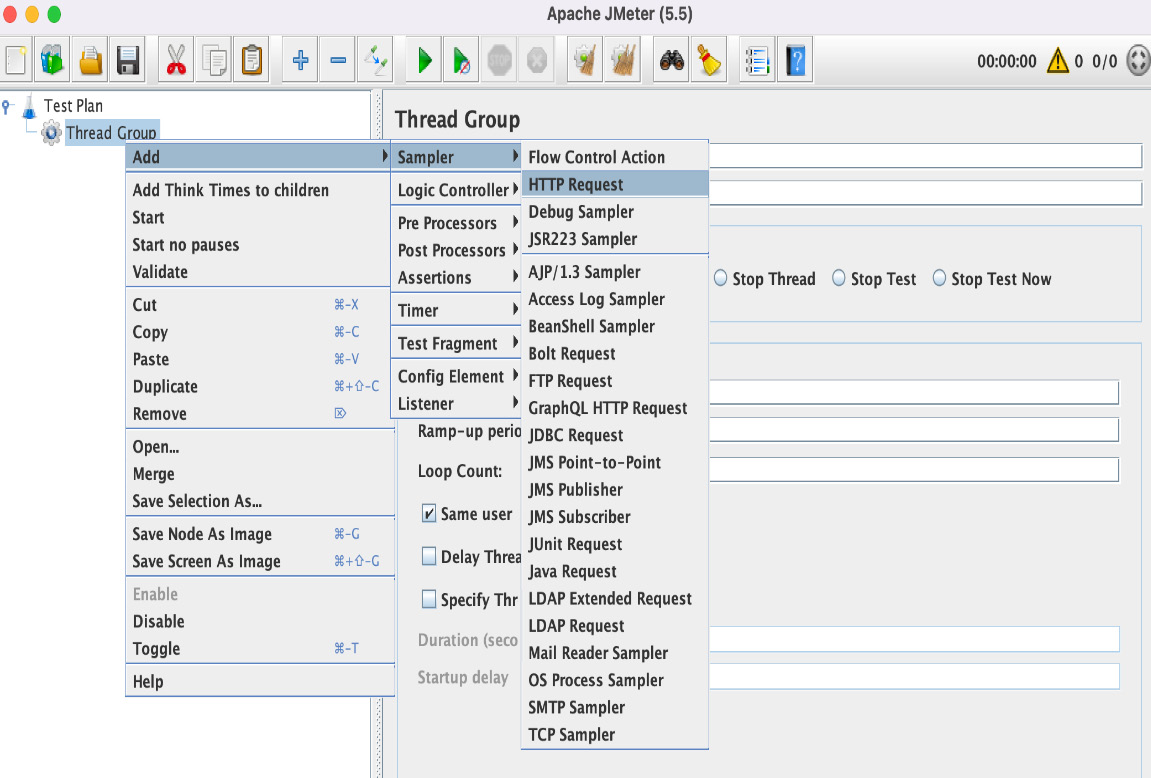
Figure 8.6 – Adding an HTTP sampler
In our example, we will be load-testing the Packt Publishing website at https://packtpub.com. The URL is split between the fields, protocol, and server name in the editor. Then we specify the path, /terms-conditions, in the Path field. We will be testing the GET request, but there are in-built options to support other types of requests, along with request body and file uploads, as shown in Figure 8.7.
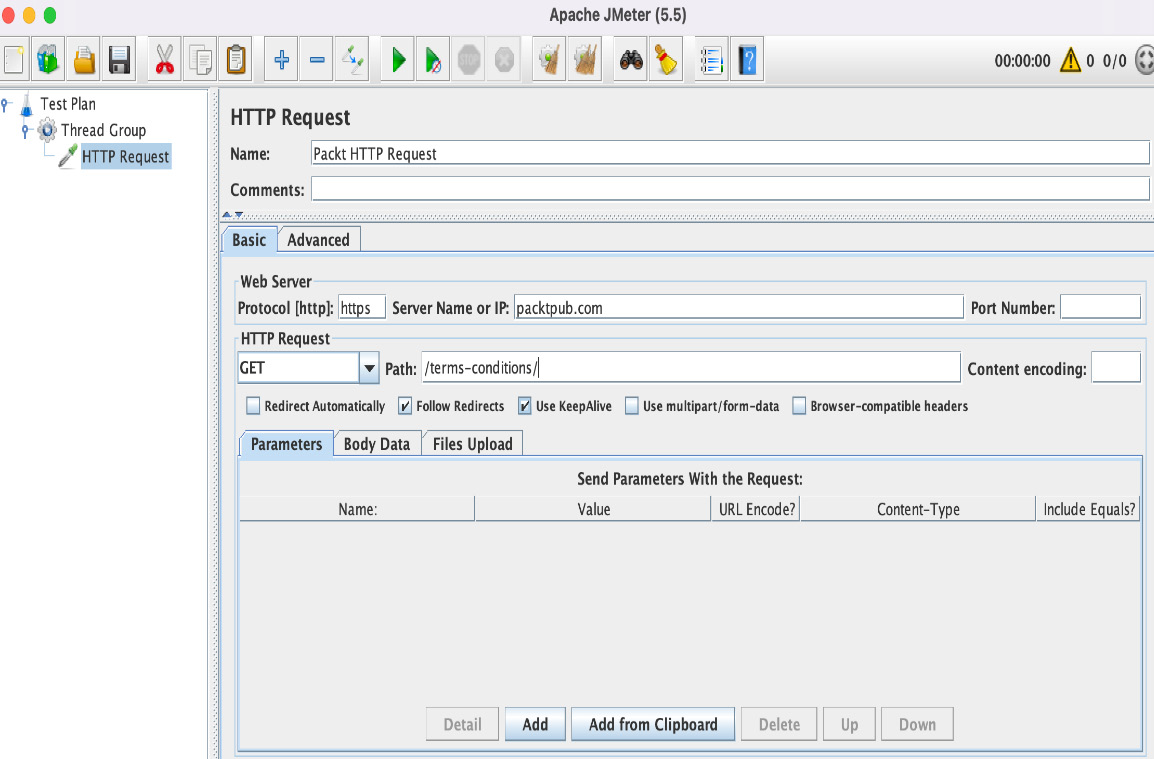
Figure 8.7 – Configuring an HTTP sampler
The test plan can now be saved to a local directory using the Save option from the menu bar. The next step is to add a listener, which helps us view the test results. A listener is a component within a test plan that stores and allows us to views results. Let’s add the View Results Tree and View Results in Table listeners to our test plan. JMeter provides a variety of listener options in the Add | Listener menu. Figure 8.8 shows our test plan with the listeners added.
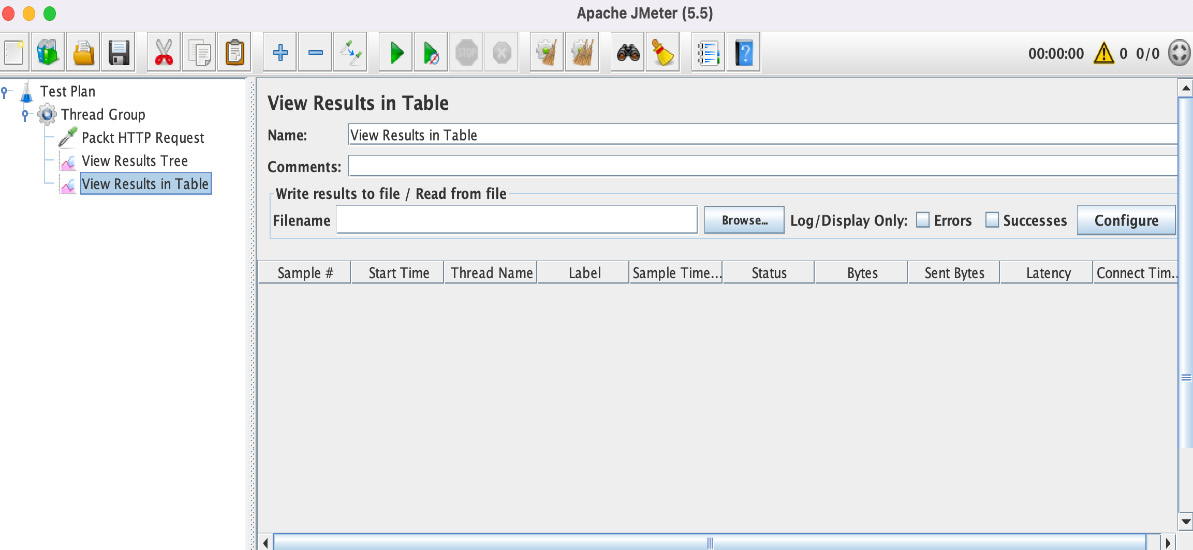
Figure 8.8 – Listeners in a test plan
After saving the test plan, we are ready to execute our first test. This is done using the Start button on the menu bar. We can see the results being populated in the listeners as soon as the test begins. Figure 8.9 shows a breakdown of the test run stats by the thread group within the View Results in Table listener.
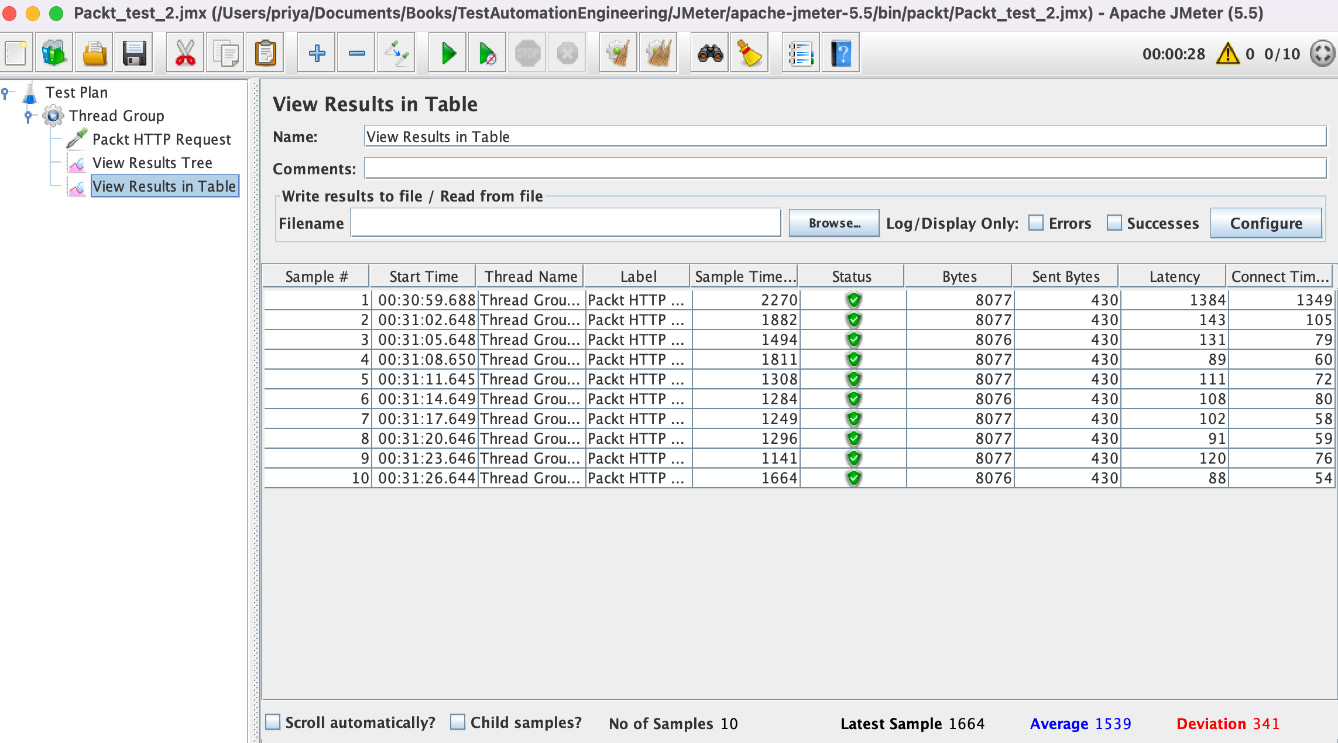
Figure 8.9 – Test run results
JMeter provides options to configure the fields in the results. Some important fields to look out for in the results are Sample Time(ms), Latency, and Status, as they specify the status of the test and the time taken to get a response from the server. JMeter offers a convenient option to save and view the test results in CSV or XML format.
Sample time versus latency
Latency is the time taken by the server to return the first byte of the response, whereas sample time is the total time taken by the server to return the complete response. Sample time is always greater than or equal to latency.
Working with assertions
Assertions, as we have seen in previous chapters, are the checks performed on the request and response. JMeter provides options to perform checks on an array of options, such as response size, response time, the structure of the response, and so on. An important thing to note about assertions is that they can be added at all levels. For example, an assertion added at the test plan level will apply to every sampler within it. For our example, let’s add response and duration assertions for the HTTP sampler, as shown in Figure 8.10.
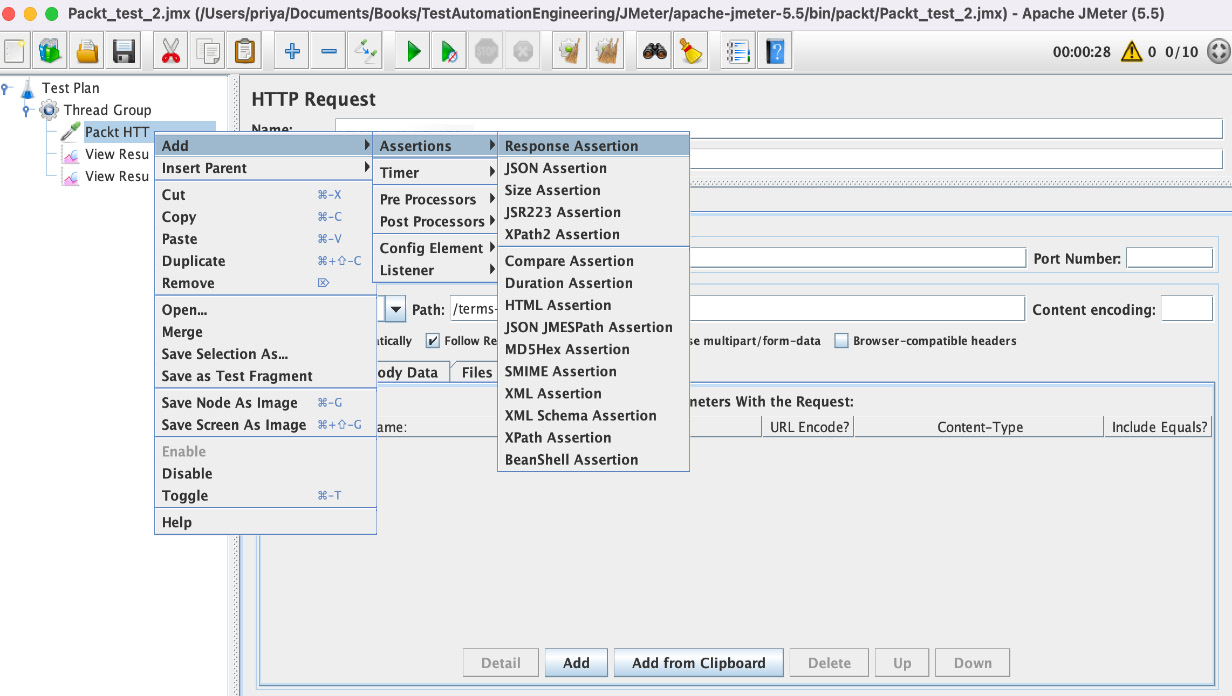
Figure 8.10 – Adding assertions
Let’s update the Response Assertion to look for the response code 200 and the Duration Assertion to flag responses over 1,000 ms. These conditions are checked after every iteration of the HTTP sampler, and the results are flagged accordingly. Figure 8.11 demonstrates the execution of the Duration Assertion where some of the responses took over a second to complete.
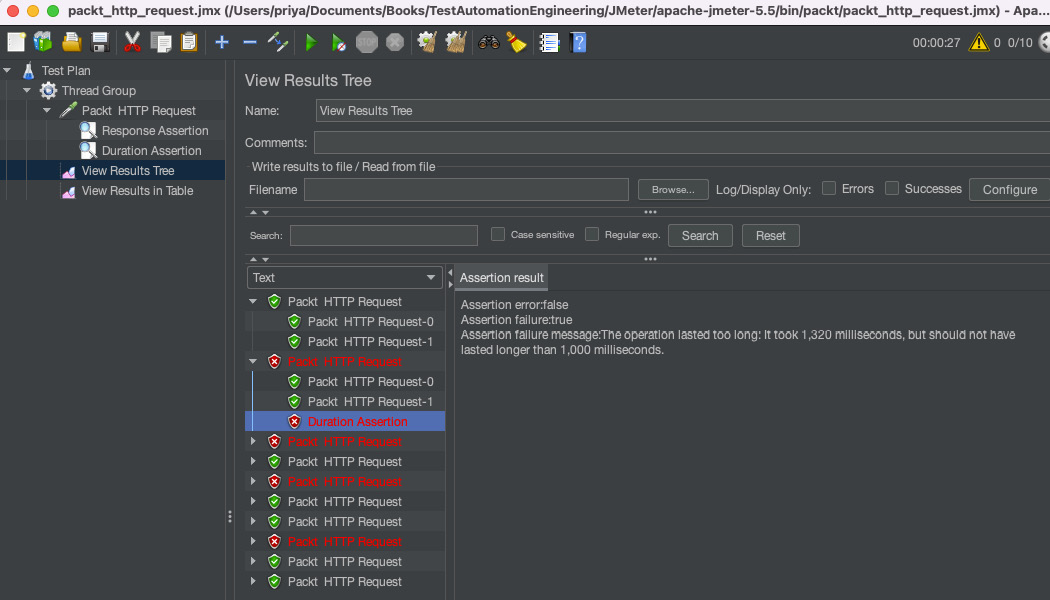
Figure 8.11 – Assertion results
The Assertion Results listener is an effective component that collates the responses from all the assertions so you can view them in one place. This listener can be added at the test plan level, as illustrated in Figure 8.12. It combines the results from the Response Assertion and the Duration Assertion.
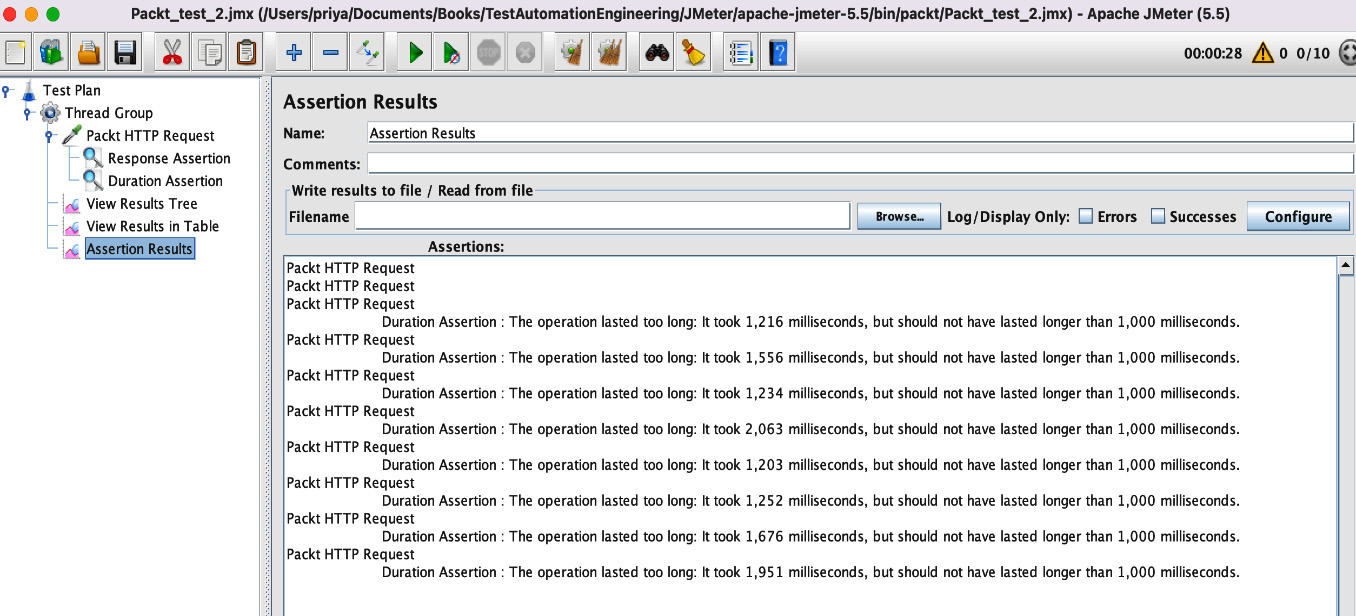
Figure 8.12 – Assertion results listener
Let’s now look at how to use the command line to handle JMeter’s tests.
Working with tests via the command line
Performance tests are often long-running and tend to be heavy on system resource consumption. GUI mode consumes a lot of memory, especially when running pre-recorded scripts, and execution via the command line alleviates this pain by reducing the memory footprint of the tool. Another significant benefit is the ability of the command line to integrate easily with external processes, such as continuous integration systems. In this section, we will learn how to configure and run a JMeter test from the command line.
Let’s reuse the test plan from the previous section for execution via the command line. Navigate to JMeter’s bin folder in your command line and run the following command:
sh jmeter –n –t "<location of the .jmx test plan>"-l "<location to log the results>"
Here, -n stands for non-GUI mode, -t specifies the location of the test plan, and –l is the location of the result logs. The command line supports various other parameters, but these are the minimum required parameters to trigger the execution. Figure 8.13 shows the execution of a command line run.
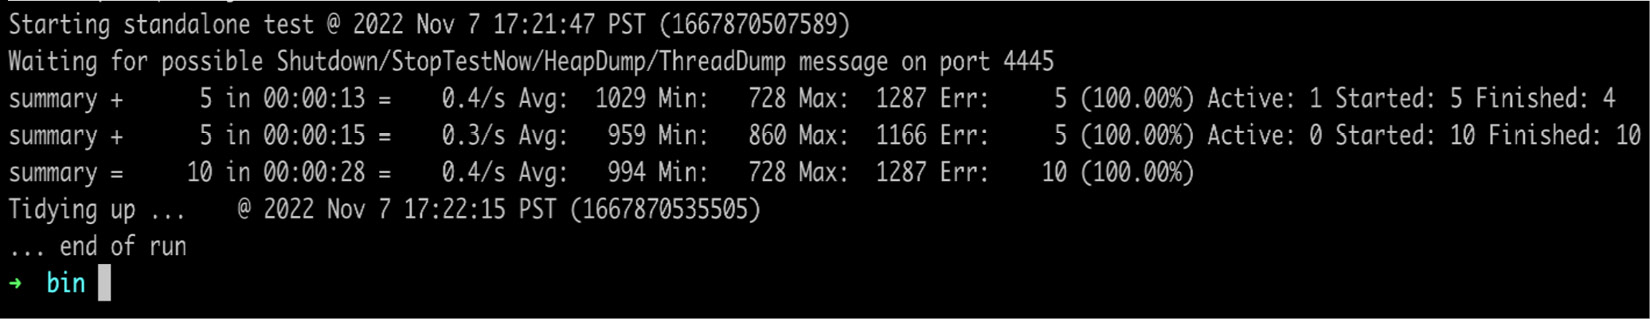
Figure 8.13 – JMeter command line run
Additionally, the sh jmeter –h command can be used to review all the available command-line options.
Performance test results can get voluminous, and it is always necessary to produce a clear and concise report. It will be hard to understand the test results with just the results shown on the command line and it necessitates a better report. This is achieved by using the –e option, which generates a dashboard report, and the –o option to specify the location of the results folder. Figure 8.14 shows a part of the HTML report generated when using these parameters. By default, this is produced as an index.html file within the results folder specified as part of the command-line option. The full command to achieve this is as follows:
sh jmeter -n -t "./packt/packt_http_request.jmx" -l "./packt/report.csv" -e -o "./packt/dashboard_report"
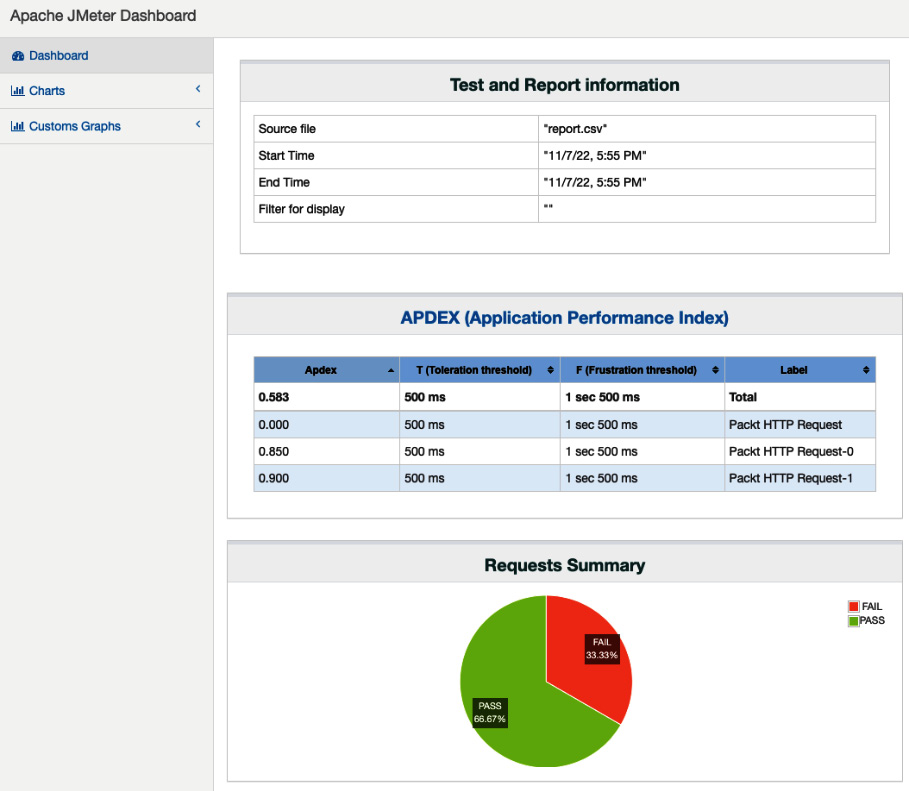
Figure 8.14 – JMeter Dashboard report
Another powerful feature that the JMeter command line provides is the use of built-in functions to send dynamic parameters when running a test plan. For example, in our test plan, we have hardcoded the path as /terms-conditions. In real time, we would be testing different paths from the command line and would not have to update the test plan for every run. The test plan can be updated with a function in this field to be able to receive this parameter via the command line using the format ${__P(VariableName)}. The path can now be sent through the command line by prefixing J to the variable name:
sh jmeter -n -t "./packt/packt_http_request.jmx" -Jpath=/terms-conditions
In the next section, let’s look at how to use the HTTP(S) Test Script Recorder component in JMeter.
Using the HTTP(S) Test Script Recorder
The HTTP(S) Test Script Recorder is a component that records requests from the browser. Previously, we manually added the HTTP request, but this component adds them automatically by recording the transactions. This option can be added directly under the test plan, as shown in Figure 8.15.
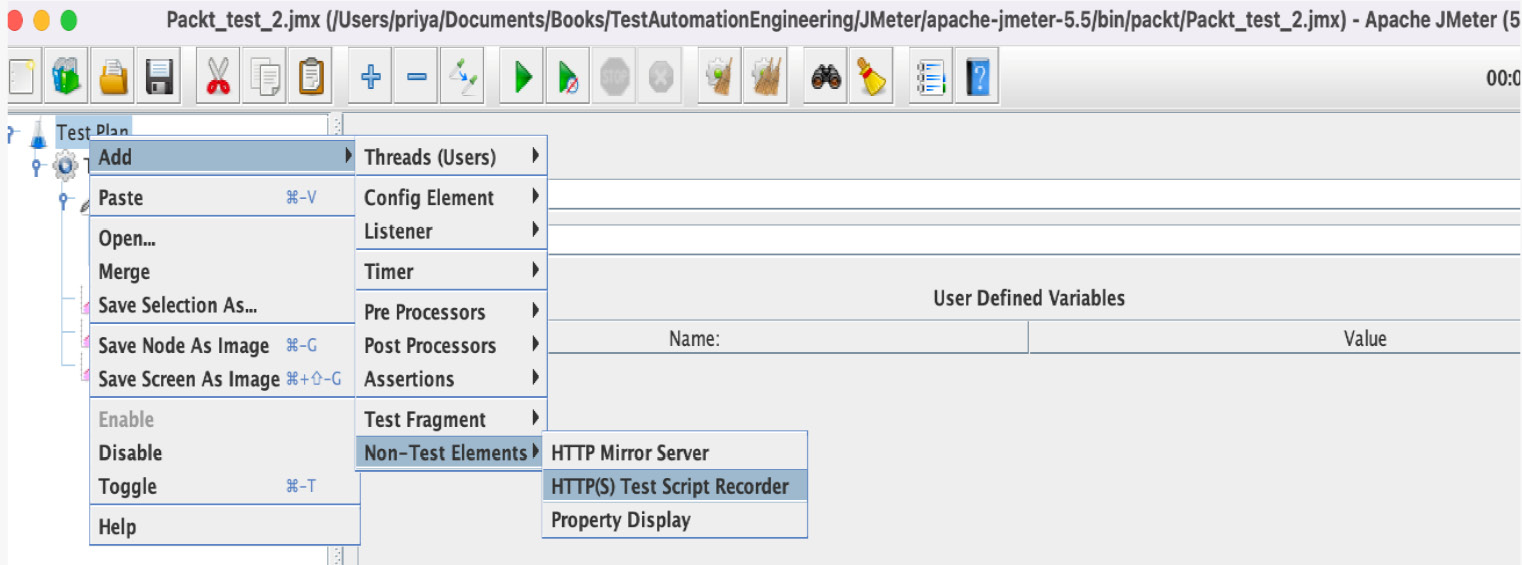
Figure 8.15 – Adding the HTTP Test Script Recorder component
We will also need a recording controller to be added to the test plan to categorize the recording by the traffic or per page. For simplicity, let’s use a single controller here, but in real-world scenarios where the user flows involve multiple pages, we might need a separate controller per page. The Target Controller property should be set to point to the right controller within the HTTP Test Script recorder. Another notable feature within the HTTP Test Recorder component is Request Filtering. A lot of resources are exchanged when recording HTTP requests, and not all of them will be applicable for load testing. URL patterns that need to be included or excluded can be specified using the Request Filtering option.
The next step is to configure the proxy on our browser so that only the desired traffic flows through the port. This is done by specifying the default JMeter port 8888 within the browser’s proxy configuration. Figure 8.16 shows this configuration on the Chrome browser.
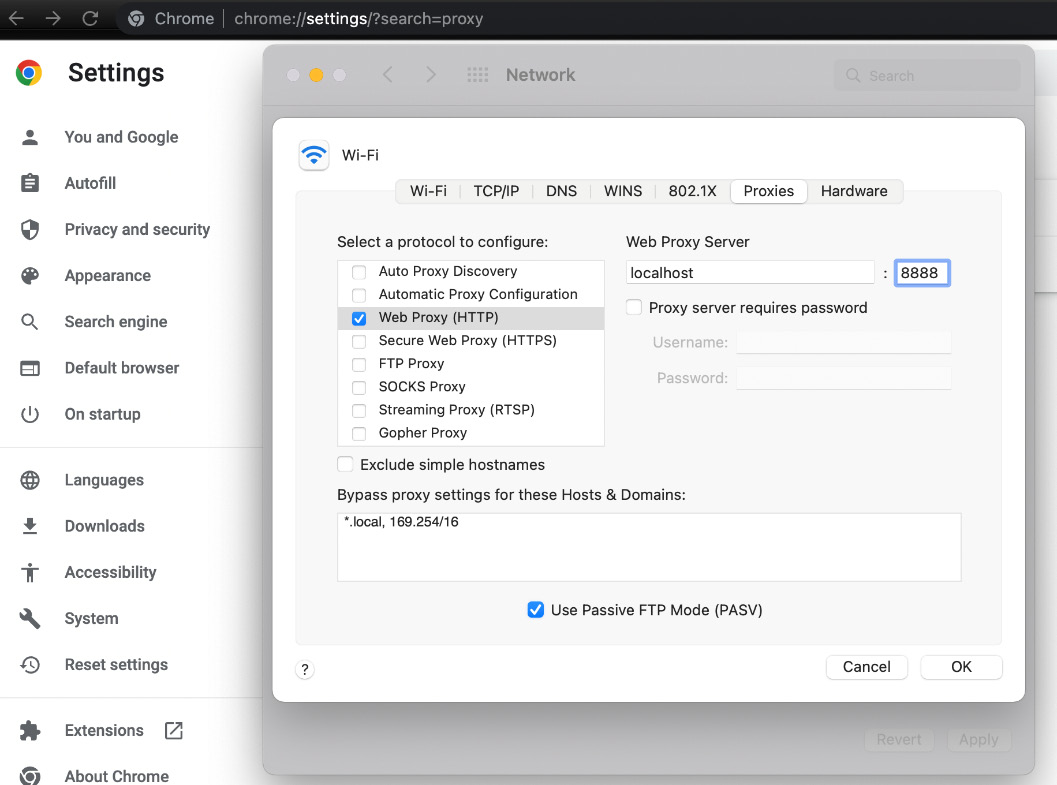
Figure 8.16 – Chrome proxy configuration
There is one more step before we can start recording, and that is to add the JMeter certificate to the browser. This file (ApacheJMeterTemporaryRootCA.crt) can be found in JMeter’s bin folder, and it needs to be added to the browser certificates via settings. Once this is done, we can use the Start button on the recorder component to commence the recording. When the recording is complete, the HTTP requests are stored under the corresponding controller. These requests can then be played back with the simulated load.
We have gained foundational knowledge on how JMeter operates, and we recommend you to further explore the tool using the user manual at https://jmeter.apache.org/usermanual/index.html. Let’s move on to the next section to gain a basic understanding of the Java programming language and how to use it to write custom code within JMeter.
Java essentials for JMeter
There may be instances where the features that come out of the box with JMeter are not sufficient and custom scripts are needed to perform specific tasks. JSR233 and Beanshell assertions/samplers can be utilized in cases such as these to get the job done. Both these components support Java code, and hence it is important to acquire basic Java knowledge. In this section, let’s go through a quick introduction to the Java programming language.
A quick introduction to Java
Java is a platform-independent compiled programming language. Java code gets compiled into bytecode, which can then be executed on any OS. The Java Virtual Machine (JVM) is the OS-specific architectural component that sits between the compiled bytecode and the OS to make it work on any platform. Let’s now create our first Java program, compile it, and run it. Any Java program comes with a boilerplate code, as follows:
package ch8;
public class first_java_program { public static void main(String[] args) {}
}
Let’s familiarize ourselves with these keywords, to begin with. Whenever a new class is created in Java, the very first line is usually the package name, followed by the class definition. The public keyword is an access modifier that denotes the access level of this class. This is followed by the class keyword and the name of the class. Within the class, there is always a main method with a public access modifier.
This is followed by another keyword, static, which signifies that this method can be invoked directly without the need to create an instance of the class. The main method is always called by the JVM at the beginning of program execution, and that is why we do not need an instance of the class to call this method. Next is void, which represents the return type of this method. In this case, we do not return anything and hence leave it as void. We could return a string or an integer depending on what is being done within the method. The values within the parentheses after the method name mark the arguments accepted by the method.
Let’s add a simple print statement, System.out.println("My first java program") within the main method and run it via the IDE. This should print the text specified within the println method. This completes our first program in Java. Java is a strong object-oriented language, so let’s learn how to create classes and objects in Java.
Object-oriented programming primarily helps us model real-world information in our programs. Let’s take an example of a bank account and see how it can be modeled in Java using object-oriented techniques. To start with, let’s create an Account class, as follows:
package ch8;
public class Account {String account_holder_name;
int age;
float account_balance;
boolean direct_deposit_enabled;
Boolean maintains_minimum_balance;
public void test_minimum_balance(){if (account_balance > 5000) {maintains_minimum_balance = true;
}
}
}
This class would act as a template for all the accounts that are created. Each account created from this template would be an object, or an instance, of this class. We have used different variable types to model real-world information. We have also used the test_minimum_balance method to derive and set the value of a variable called maintains_minimum_balance within the class.
Let’s now go ahead and create another class that holds these objects:
package ch8;
public class AccountObjects {public static void main(String[] args) {Account johns_account = new Account();
Account davids_account = new Account();
johns_account.account_holder_name = "John Doe";
johns_account.age = 32;
johns_account.account_balance = 10000;
johns_account.direct_deposit_enabled = true;
johns_account.test_minimum_balance();
tims_account.account_holder_name = "Tim Sim";
tims_account.age = 35;
tims_account.account_balance = 1000;
tims_account.direct_deposit_enabled = true;
tims_account.test_minimum_balance();
}
}
We have created two objects in our second class, which represent two different people’s bank accounts. This example demonstrates how we can use classes to model information.
JDK versus JRE versus JVM
JDK: The Java Development Kit is an environment for developing, compiling, and running Java applications.
JRE: The Java Runtime Environment is an environment for running Java applications. Users of Java applications just need the JRE.
JVM: The Java Virtual Machine is an interpreter for executing Java programs.
This section was meant to quickly inform you what the Java programming language is and how to write a basic program. You are encouraged to refer to the official Java documentation at https://docs.oracle.com/javase/tutorial/getStarted/index.html to further your knowledge. Let’s now get back to writing custom scripts in JMeter.
Using the JSR233 assertion
JMeter comes with a JSR233 assertion/sampler that can interpret and execute Java code. JSR233 is a scripting API for languages that can work on the JVM. Apache Groovy, Python, and Ruby are some of the supported languages, and we will be using Groovy for our example as it provides better performance.
Another advantage of using Groovy is that it is an extension of the JDK and accepts Java code. In fact, it supports all the features of Java and provides additional dynamic features, whereas Java is a strongly typed language. Groovy’s official documentation can be found at https://groovy-lang.org/documentation.html. Since the Groovy engine is part of JMeter, no additional installation is required to get it working. Let’s now look at how to employ a Groovy script within a JMeter test plan using the JSR233 sampler/assertion.
To start, let’s add the JSR233 assertion to the HTTP request in our existing test plan. By default, Groovy is selected as the language for this assertion, but there are other options, as shown in Figure 8.17.

Figure 8.17 – Adding a JSR233 sampler
One of the top uses of employing custom scripting within JMeter is to enhance the logging capabilities wherever needed. This helps tremendously in reducing debugging effort. For example, the statement log.info("Output from the log message") can be used to print additional logging messages. Now consider the following code block, which can be run as part of the JSR233 assertion:
int thread_run_time = SampleResult.getTime();
int thread_latency = SampleResult.getLatency();
int response_threshold = 1000;
if ((thread_run_time+thread_latency)>response_threshold){AssertionResult.setFailure(true);
AssertionResult.setFailureMessage("Threshold exceeded");}
SampleResult is a built-in JMeter object through which various properties of the test result can be accessed. Here, we are getting the run time and latency of the HTTP response and using an if statement to perform an assertion. Custom scripting thus extends JMeter’s ability to perform specific validations.
Another area where custom scripting can be used is with getting and setting values of variables and properties. It might be necessary to dynamically change the value of a variable based on the test result. This can be performed with the following statements:
failure_count = vars.get("failure_count");
Failure_count++;
vars.put("failure_count", String.valueOf(failure_count));
We are getting the value of the failure_count variable and incrementing it before writing it out. As you can see, custom scripting opens up various ways to extend our tests to address project-specific needs. This is as far as we can go here; it’s up to you to explore it further.
In the next section, let’s explore some considerations for performance testing.
Considerations for performance testing
Let us quicky look at some of the major considerations required for effective performance testing:
- Distributed load testing: Load testing should mimic the real-world user load, and it is vital to distribute the load across multiple machines/servers to uncover critical bugs or memory leaks during the testing phase. This can be done in JMeter by employing a local JMeter master machine with remote slave machines.
- Managing resource requirements: The memory and resources of the load testing tool have to be managed effectively to prevent false negatives in the test results. Running through the command line, disabling memory-consuming parts of the testing ecosystem, and optimizing test data are some first areas to look into.
- Performance testing metrics: It is critical to review and agree upon a standard set of metrics for all the applications in your organization. This helps you standardize your test results.
- Gradual performance degradation: Software applications may experience a gradual decrease in throughput due to a certain code block or a faulty configuration. These issues are usually not exposed by a single load or stress test. Therefore, it is critical to run regular and prolonged load tests based on the application’s needs.
- Performance test environment: The environment where the load tests are run should be analyzed and set up to mimic the production environment as closely as possible. Hardware, software, and network configurations should be taken into account when you are coming up with a performance test plan.
- Constant feedback loop: Performance testing should lead to a constant loop of performance engineering to remove bottlenecks and improve user experience. Any time a major code change is introduced, selected performance tests have to be executed and the results have to be reviewed with stakeholders.
This brings us to the end of this chapter, and it should help you quickly get up and running with your performance tests. In the next section, let’s summarize what we have learned in this chapter.
Summary
We commenced this chapter by discussing what JMeter is and how it works, and then proceeded to download it. We ventured on to write our first performance test by utilizing various components within JMeter’s test plan, such as thread groups and HTTP requests. We then learned how to use assertions to perform validations on the response. Subsequently, we looked at how to run the same test plan via the command line and explored using the command line to generate detailed HTML reports. We glanced through the HTTP recording capabilities of JMeter, and in the next section we dived into custom scripting by going through a quick introduction to Java and how to use a JSR233 assertion. We concluded the chapter by looking at performance testing considerations.
Questions
- What is JMeter and what is its primary use?
- How do you simulate user load in JMeter?
- Why is the command line preferred over JMeter’s GUI for test execution?
- Why is custom scripting needed in JMeter?
- What is distributed load testing?