
Kibana Query Language (KQL) is a query language specifically built for Kibana that is built to simplify query usage with easy-to-use syntax, support for querying on scripted fields, and ease of migration of queries as the product evolves. The query syntax is similar to the Lucene query syntax that was explained in the previous sections. For example, in a Lucene query, response:404 geoip.city_name:Diedorf would search for any documents having a response of 404 or any documents having geoip.city_name with Diedorf.
KQL doesn't allow spaces between expressions and the same thing would have to be written as response:200 or geoip.city_name:Diedorf, as shown in the following screenshot:

Similarly, you can have and not expressions too and group expressions as shown in the following screenshot:

Histogram: This section is only visible if a time field is configured for the selected index pattern. This section displays the distribution of documents over time in a histogram. By default, the best time interval for generating the histogram is automatically inferred based on the time set in the time filter. However, the histogram interval can be changed by selecting the interval from the dropdown, as shown in the following screenshot:

During data exploration, the user can slice and dice through the histogram and filter the search results. Hovering over the histogram converts the mouse pointer to a + symbol. When left-clicking, the user can draw a rectangle to inspect/filter the documents that fall in those selected intervals.
Toolbar: User-entered search queries and applied filters can be saved so that they can be reused or used to build visualizations on top of the filtered search results. The toolbar provides options for clearing the search (New), and saving (Save), viewing (Open), sharing (Share), and inspecting (Inspect) search queries.
The user can refer to existing stored searches later and modify the query, and they can either overwrite the existing search or save it as a new search (by toggling the Save as new search option in the Save Search window), as follows:

Clicking the Open button displays the saved searches, as shown in the following screenshot:

In Kibana, the state of the current page/UI is stored in the URL itself, thus allowing it to be easily shareable. Clicking the Share button allows you to share the Saved Search, as shown in the following screenshot:

The Inspect button allows to view query statistics such as total hits, query time, the actual query fired against ES, and the actual response returned by ES. This would be useful to understand how the Lucene/KQL query we entered in the query bar translates to an actual ES query, as shown in the following screenshot:

Time Picker: This section is only visible if a time field is configured for the selected index pattern. The Time Filter restricts the search results to a specific time period, thus assisting in analyzing the data belonging to the period of interest. When the Discover page is opened, by default, the Time Filter is set to Last 15 minutes.
Time Filter provides the following options to select time periods. Click on Time Filter (calendar icon)/ Date fields to access the following options:
- Quick time filter: This helps you to filter quickly based on some already available time ranges:

- Relative time filter: This helps you to filter based on the relative time with respect to the current time. Relative times can be in the past or the future. A checkbox is provided to round the time:

- Absolute time filter: This helps you to filter based on input start and end times:

- Auto Refresh: During the analysis of real-time data or data that is continuously generated, a feature to automatically fetch the latest data would be very useful. Auto Refresh provides such a functionality. By default, the refresh interval is turned off. The user can choose the appropriate refresh interval that assists their analysis and click the Start button, as shown in the following screenshot:

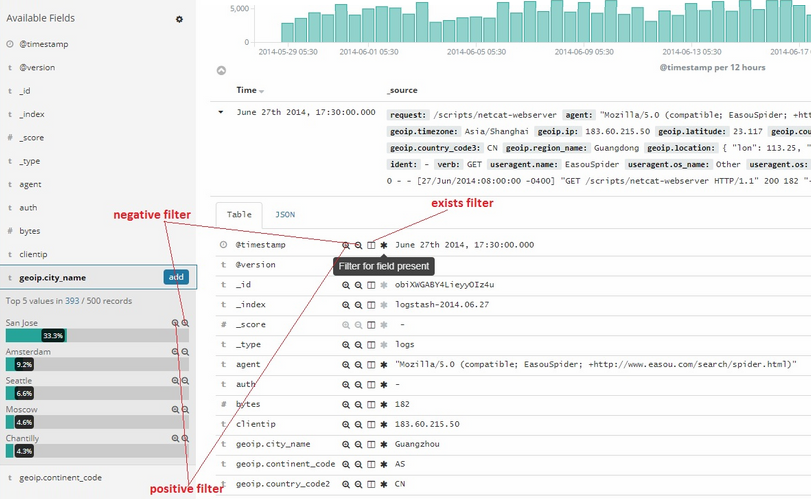
Filters: By using positive filters, you can refine the search results to display only those documents that contain a particular value in a field. You can also create negative filters that exclude documents that contain the specified field value.
You can add field filters from Fields list or Documents table, and even manually add a filter. In addition to creating positive and negative filters, Documents table enables you to determine whether a field is present.
To add a positive or negative filter, in Fields List or Documents Table, click on the positive icon or negative icon respectively. Similarly, to filter a search according to whether a field is present, click on the * icon (the exists filter), as follows:
You can also add filters manually by clicking the Add a Filter button found below the query bar. Clicking on the button will launch a popup in which filters can be specified and applied by clicking the Save button, as follows:

The applied filters are shown below the query bar. You can add multiple filters, and the following actions can be applied to the applied filters:
- Enable/Disable Filter: This icon allows the enabling/disabling of the filter without removing it. Diagonal stripes indicate that a filter is disabled.
- Pin Filter: Pin the filter. Pinned filters persist when you switch contexts in Kibana. For example, you can pin a filter in Discover and it remains in place when you switch to the Visualize/Dashboard page.
- Toggle Filter (Include/Exclude results): Allows you to switch from a positive filter to a negative filter and vice versa.
- Delete Filter: Allows you to remove the applied filter.
- Edit Filter: Allows you to edit the applied filter.
- Expand/Collapse: Clicking this icon will show the labels next to the icons on the left-hand-side menu.
The following screenshot displays the preceding actions that can be applied:

You can perform the preceding actions across multiple filters at once rather than one at a time by clicking on the filter settings icon, as follows:
