
ML is not very exciting without data in Elasticsearch to analyze. So, let's get some using Metricbeat! Metricbeat is easy to install and configure. It serves as a great source of raw telemetry data that is perfect for ML. Follow along—we'll assume you haven't yet installed Metricbeat, so we can do this together now.
Start by downloading Metricbeat from this page: https://www.elastic.co/downloads/beats/metricbeat. We will run through the installation on macOS X, but if you want to install on a different platform, please refer to the installation documentation at https://www.elastic.co/guide/en/beats/metricbeat/current/metricbeat-installation.html.
After extracting Metricbeat to the directory of your choice, you will notice the following folder structure:
%> ls -lF
total 102296
-rw-r--r--@ 1  yourusername staff 13675 Nov 15 20:24 LICENSE.txt
-rw-r--r--@ 1  yourusername staff 163067 Nov 15 20:24 NOTICE.txt
-rw-r--r--@ 1  yourusername staff 808 Nov 15 20:39 README.md
-rw-r--r--@ 1  yourusername staff 373373 Nov 15 20:35 fields.yml
drwxr-xr-x@ 4  yourusername staff 128 Nov 15 20:35 kibana/
-rwxr-xr-x@ 1  yourusername staff 51739288 Nov 15 20:39 metricbeat*
-rw-r--r--@ 1  yourusername staff 61538 Nov 15 20:35 metricbeat.reference.yml
-rw-------@ 1  yourusername staff 5549 Nov 15 20:35 metricbeat.yml
drwxr-xr-x@ 37 yourusername staff 1184 Nov 15 20:35 modules.d/
Metricbeat uses modules to collect metrics. Each module defines the basic logic for collecting data from a specific service, such as Redis or MySQL. A module consists of metricsets that fetch and structure the data. The definitions of these modules are in the modules.d subdirectory. By default, only the system module is enabled—and this is enough for us to use as example data for ML. However, all kinds of data that Metricbeat collects can be analyzed with ML.
Because Metricbeat's default configuration is everything that we need to get started (and because we haven't fully enabled other Platinum features such as security, which would require Metricbeat to know how to authenticate with Elasticsearch, we can simply just start Metricbeat using this default configuration:
%> ./metricbeat
After starting Metricbeat, go to the Kibana DevTools console (http://localhost:5601/app/kibana#/d ev_tools/console) in order to check whether newly indexed data can be found in the expected metricbeat index. In the console, execute the following command:
GET _cat/indices/metricbeat*
This leverages the _cat/indices API to display the summary information about any metricbeat index that may exist in your Elasticsearch cluster. If, like me, you've executed this command relatively recently after starting Metricbeat, you will only have a small number of documents in a single index whose name is appended with the date of the index's creation. In our example setup, the return from the preceding call is the following:
yellow open metricbeat-6.5.1-2018.11.25 k4tKS42hSJCER9kV8wkP4g 1 1 930 0 532.9kb 532.9kb
We can see here that our newly created metricbeat index contains 930 documents.
One last thing before we go any further, we need to create a Kibana index pattern in order to visualize and use our Metricbeat data in Kibana. In the Management section of Kibana, click on the Index Patterns link.
Again, if you’re following this installation sequence as we've documented, starting completely from scratch, you won't have any Kibana index patterns yet. As such, you will immediately get the following screenshot:

Create an index pattern for the current metricbeat-* index (and those that will be created in the future) by defining a pattern that uses a wildcard for the mutable part of the index names:

After clicking Next step, enter @timestamp for the Time Filter field name:
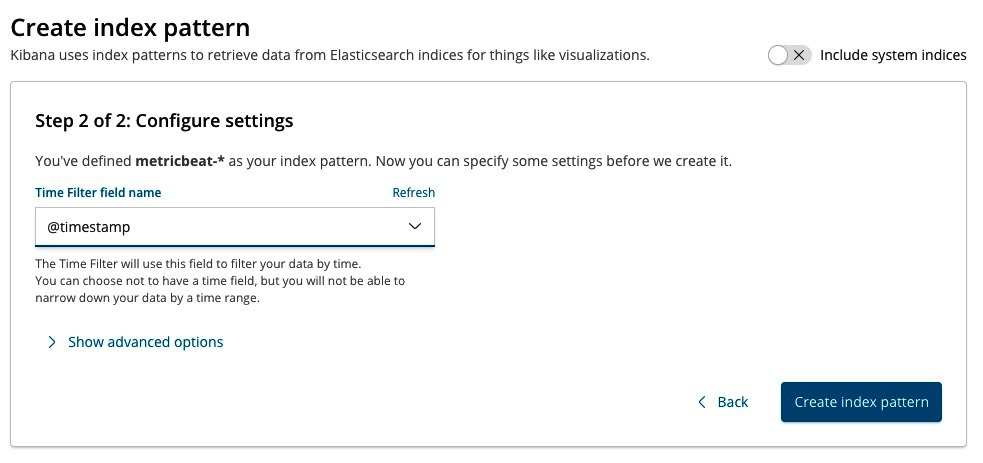
Then click Create index pattern to see the completed index pattern definition:

Notice that the creation of the index pattern includes the definition of over 1,800 fields—most of which are not being collected, since we only have the system module enabled. This fact will not affect the ML ability to analyze data that is populated in some of the fields, however.
With Metricbeat running in the background, we now have a process that continuously pushes data to our cluster. This lays the groundwork on which we will rely for the ML walk-through in this chapter. It should be noted that you should let Metricbeat run for at least a few hours, if not longer, before proceeding so that there’s a good amount of data for ML to work with.