
In the last section, we looked at how you can use the API built into Docker to gain an insight to what resources your containers are running by running the docker container stats and docker container top commands. Now, we are to see how we can take it to the next level by using cAdvisor from Google.
Google describes cAdvisor as follows:
cAdvisor (Container Advisor) provides container users an understanding of the resource usage and performance characteristics of their running containers. It is a running daemon that collects, aggregates, processes, and exports information about running containers. Specifically, for each container, it keeps resource isolation parameters, historical resource usage, histograms of complete historical resource usage, and network statistics. This data is exported by a container and is machine-wide.
The project started off life as an internal tool at Google for gaining an insight into containers that had been launched using their own container stack.
Note
Google's own container stack was called "Let Me Contain That For You" or lmctfy for short. The work on lmctfy has been installed as a Google port functionality over to libcontainer that is part of the Open Container Initiative. Further details on lmctfy can be found at https://github.com/google/lmctfy/
cAdvisor is written in Go (https://golang.org); you can either compile your own binary or you can use the pre-compiled binary that are supplied via a container, which is available from Google's own Docker Hub account. You can find this at http://hub.docker.com/u/google/.
Once installed, cAdvisor will sit in the background and capture metrics that are like that of the dockercontainer
stats command. We will go through these stats and understand what they mean later in this chapter.
cAdvisor takes these metrics along with those for the host machine and exposes them via a simple and easy-to-use built-in web interface.
There are several ways to install cAdvisor; the easiest way to get started is to download and run the container image that contains a copy of a precompiled cAdvisor binary:
docker network create monitoring
docker container run -d
  --volume=/:/rootfs:ro
  --volume=/var/run:/var/run:rw
  --volume=/sys:/sys:ro
  --volume=/var/lib/docker/:/var/lib/docker:ro
  --publish=8080:8080
  --name=cadvisor
  google/cadvisor:latest
You should now have a cAdvisor container up and running on your host machine.
Before we start looking at stats, let's look at cAdvisor in more detail by discussing why we have passed all the options to the container.
The cAdvisor binary is designed to run on the host machine alongside the Docker binary, so by launching cAdvisor in a container, we are isolating the binary in its own environment. To give cAdvisor access to the resources it requires on the host machine, we have to mount several partitions and also give the container privileged access to let the cAdvisor binary think it is being executed on the host machine.
So now, we have cAdvisor running; what do we need to do to configure the service in order to start collecting metrics?
The short answer is, nothing at all. When you started the cAdvisor process, it instantly started polling your host machine to find out what containers are running and gathered information on both the running containers and your host machine.
cAdvisor should be running on the 8080 port; if you open http://localhost:8080/, you should be greeted with the cAdvisor logo and an overview of your host machine:

This initial page streams live stats about the host machine, though each section is repeated when you start to drill down and view the containers. To start with, let's look at each section using the host information.
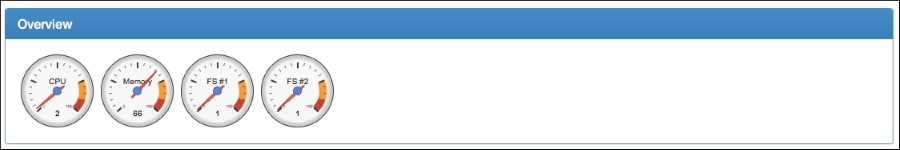
The overview section gives you a bird's-eye view of your system; it uses gauges so you can quickly get an idea of which resources are reaching their limits. In the following screenshot, there is very little in the way of CPU utilization and the file system usage is relatively low; however, we are using 66% of the available RAM:
Next up is the graph which shows the CPU utilization over the last minute:

- Total Usage: This shows an aggregate usage across all cores
- Usage per Core: This graph breaks down the usage per core
- Usage Breakdown: This shows aggregate usage across all cores, but breaks it down to what is being used by the kernel and what is being used by the user-owned processes
The Memory section is split into two parts. The graph tells you the total amount of memory used by all the processes for the host or container; this is the total of the hot and cold memory. The Hot memory is the current working set; pages that have been touched by the kernel recently. The Cold memory is the page that hasn't been touched for a while and could be reclaimed if needed.
The Usage Breakdown gives a visual representation of the total memory in the host machine, or allowance in the container, alongside the total and hot usage.
The network section shows the incoming and outgoing traffic over the last minute. You can change the interface using the drop-down box on the top-left.
There is also a graph that shows any networking errors. Typically, this graph should be flat. If it isn't, then you will be seeing performance issues with your host machine or container.
The final section, filesystem, gives a breakdown of the filesystem usage. In the following screenshot, /dev/vda1 is the boot partition, overlay is the main filesystem running your running containers.
Now we can look at our containers. At the top of the page, there is a link of your running containers, it says Docker Containers; you can either click on the link or go directly to http://localhost:8080/docker/.
Once the page loads, you should see a list of all your running containers, and also a detailed overview of your Docker process, and finally a list of the images you have downloaded.
Subcontainers shows a list of your containers; each entry is a clickable link that will take you to a page that will give you the following details:
- Isolation:
- CPU: This shows you the CPU allowances of the container; if you have not set any resource limits, you will see the host's CPU information
- Memory: This shows you the memory allowances of the container; if you have not set any resource limits, your container will show an unlimited allowance
- Usage:
- Overview: This shows gauges so you can quickly see how close to any resource limits you are
- Processes: This shows the processes for just your selected container
- CPU: This shows the CPU utilization graphs isolated to just your container
- Memory: This shows the memory utilization of your container
The Driver status section gives the basic stats on your main Docker process, along with the information on the host machine's kernel, host name, and also the underlying operating system.
It also gives information on the total number of containers and images. You may notice that the total number of images is a much larger figure than you expected to see; this is because it is counting each file system as an individual image.
Finally, you get a list of the Docker images which are available on the host machine. It lists the Repository, Tag, Size, and when the image was created, along with the images' unique ID. This lets you know where the image originated from (Repository), which version of the image you have downloaded (Tag) and how big the image is (Size).
This is all great, what's the catch?
So, you are maybe thinking to yourself that all this information available in your browser is really useful; being able to see real-time performance metrics in an easily readable format is a real plus.
The biggest drawback of using the web interface for cAdvisor, as you may have noticed, is that it only shows you one minute's worth of metrics; you can quite literally see the information disappearing in real time.
As a pane of glass gives a real-time view into your containers, cAdvisor is a brilliant tool; if you want to review any metrics that are older than one minute, you are out of luck.
That is, unless you configure somewhere to store all your data; this is where Prometheus comes in.So what's Prometheus? Its developers describe it as follows:
Prometheus is an open-source system's monitoring and alerting toolkit built at SoundCloud. Since its inception in 2012, it has become the standard for instrumenting new services at SoundCloud and is seeing growing external usage and contributions.
OK, but what does that have to do with cAdvisor? Well, Prometheus has quite a powerful database backend that stores the data it imports as a time series of events.
One of the things cAdvisor does, by default, is expose all the metrics it is capturing on a single page at /metrics; you can see this at http://localhost:8080/metricson our cAdvisor installation. The metrics are updated each time the page is loaded, you should see something like:

As you can see in the preceding screenshot, this is just a single long page of raw text. The way Prometheus works is that you configure it to scrape the /metrics URL at a user-defined interval, let's say every five seconds; the text is in a format that Prometheus understands and it is ingested into the Prometheus's time series database.
What this means is that, using Prometheus's powerful built-in query language, you can start to drill down into your data. Let's look at getting Prometheus up and running.
First of all, there is a work configuration file in the repo at /bootcamp/chapter06/prometheus/you will need to make sure you are in this folder as we are going to mounting the configuration file from within there:
docker container run -d
  --volume=$PWD/prometheus.yml:/etc/prometheus/prometheus.yml
  --publish=9090:9090
  --network=monitoring
  --name=prometheus
  prom/prometheus:latest

The configuration file we have launched Prometheus with looks like the following:
global:
scrape_interval: 15s # By default, scrape targets every 15 seconds.
external_labels:
    monitor: 'Docker Bootcamp'
scrape_configs:
  - job_name: 'cadvisor'
scrape_interval: 5s
static_configs:
      - targets: ['cadvisor:8080']
As we have launched our Prometheus container within the monitoring network our installation will be able scrape the metrics from http://cadvisor:8080/, also note that we haven't added /metrics to the URL as this added automatically by Prometheus.
Opening http://localhost:9090/targets in your browser should show you something like the following:

Also, the status menu has links to the following information pages:
- Runtime information&Build information: This displays how long Prometheus has been up and polling data, if you have configured an end point and details of the version of Prometheus that you have been running
- Command-Line Flags: This shows all the runtime variables and their values
- Configuration: This is a copy of the configuration file we injected into the container when it was launched
- Rules: This is a copy of any rules we injected; these will be used for alerting
As we only have a few containers up and running at the moment, let's launch one that runs Redis so we can start to look at the query language built into Prometheus.
We will use the official Redis image for this and as we are only going to use this as an example we won't need to pass it any user variables:
docker container run -d --name my-redis-server redis
We now have a container called my-redis-server running. cAdvisor should already be exposing metrics about the container to Prometheus; let's go ahead and see.
In the Prometheus web interface, go to the Graph link in the menu at the top of the page. Here, you will be presented with a text box into which you can enter your query. To start with, let's look at the CPU usage of the Redis container.
In the box, enter the following:
container_cpu_usage_seconds_total{job="cadvisor",name="my-redis-server"}Then, after clicking on Execute, you should have two results returned, listed in the Console tab of the page. If you remember, cAdvisor records the CPU usage of each of the CPU cores that the container has access to, which is why we have two values returned, one for cpu00 and one for cpu01. Clicking on the Graph link will show you results over a period of time:

As you can see in the preceding screenshot, we now have access to the usage graphs for the last 5 minutes, which is about how long ago I launched the Redis instance before generating the graph.
Graphing, as you may have noticed, isn't Prometheus's strong point. Luckily Grafana has been able to use Prometheus as a data source for a while, let's now launch a Grafana container:
docker container run -d
  --publish=3000:3000
  --network=monitoring
  --name=grafana
grafan
a/grafana:latest

Once the container has launched, go to http://localhost:3000/ in your browser and you will be prompted to login, the default username and password is admin / admin.
Now you are logged in you should see something like the following page:

As you may have guessed, we need to click Add data sourceand the add then enter the following information:
- Name: prometheus
- Type: <Select Prometheus from the drop down list>
- Url:
http://prometheus:9090 - Access: <Select proxy from the drop down list>
Leave everything else as is and then click on Add, after a second or two your data source should have successfully been added and the connection test passed.
Now that we have our data source added we can add a dashboard. There are plenty of dashboards available, we are going to use the one published by Brian Christner which can be found at https://grafana.net/dashboards/179/.
To import the dashboard,click on the Grafana logo in the top left, in the menu which opens go to Dashboards and then select Import. In the pop-up dialog which opens enter the URL for the dashboard, which is https://grafana.net/dashboards/179/, into the Grafana.net Dashboard box and then click on the Load button.
That will load the dashboard configuration, on the next page you given two options, the Name is already filled in so just select prometheus from the dropdown Prometheus list and click the Import button.
Once imported you should be greeted by a dashboard which looks similar (I have tweaked it for the screenshot) to the following:
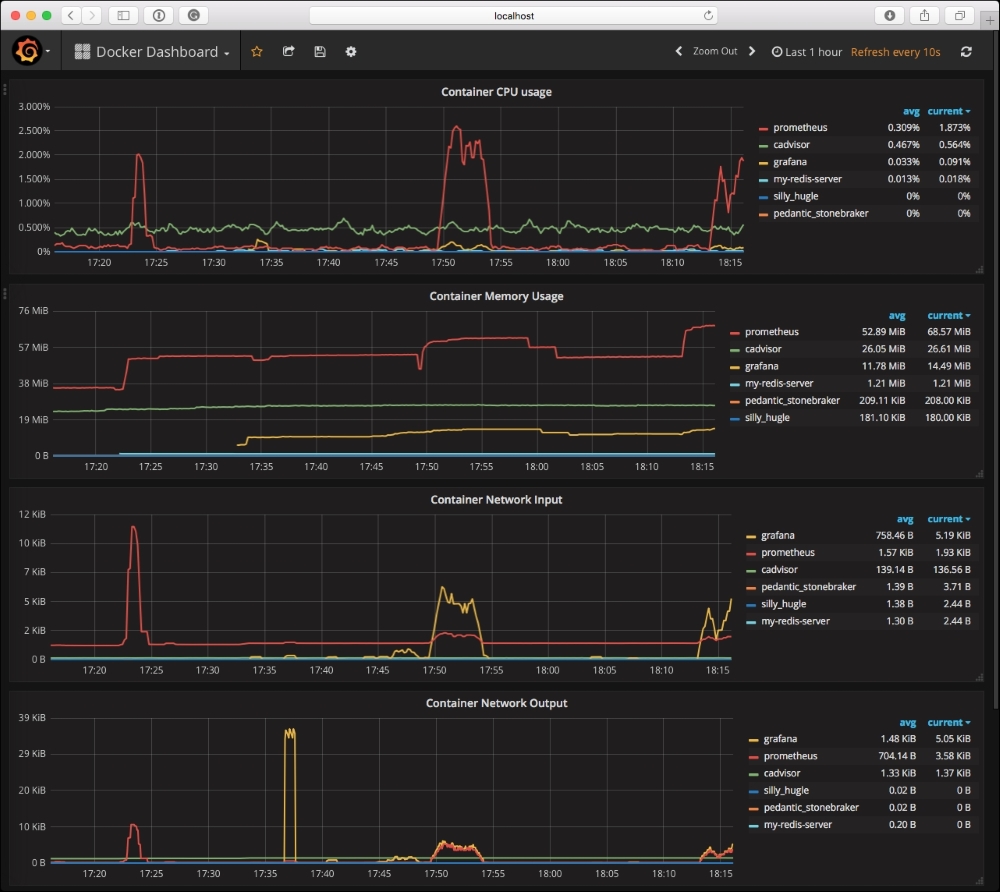
You may notice from the screen above that we now have over an hour's worth of data from cAdvisor stored in Prometheus.
It's worth pointing that the current experimental build of Docker has a built-in Prometheus endpoint much in the same way that cAdvisor has. Once this hits the stable release I expect to see this be a great out of the box solution for monitoring your Docker hosts.
However, this is just one way you monitor your containers as there are numerous other tools both of which are self-hosted or run as a software as a service in the cloud such as:
- Sysdig - http://www.sysdig.org/
- Sysdig Cloud - https://sysdig.com/
- Datadog - http://docs.datadoghq.com/integrations/docker/
- New Relic - https://newrelic.com/partner/docker
- Coscale - http://www.coscale.com/docker-monitoring
- Elastic Metric Beat - https://www.elastic.co/products/beats/metricbeat