
6
Metrics, KPI and Measurements
Reporting and monitoring progress means that the test manager must measure their project. This means simultaneously measuring the effectiveness and efficiency of testing activities, as well as the level of quality of the product, application, system or system-of-system being tested. So we will have two types of metrics:
– “project” metrics to measure the effectiveness and efficiency of activities against defined criteria;
– “product” metrics to determine the level of quality in relation to desired quality objectives, for example, defined on the basis of a risk analysis or contractual criteria.
Any evaluation must be objective; without objective measures, our management will be based on opinions or wishes, not on facts. By reusing metrics that we have previously defined, we are able to determine trends by comparing current measurements with the same measurements taken previously. The first measurement can constitute the baseline, that is, the reference measurement.
Metrics allow us to measure attributes and understand them. This will facilitate decision-making and will enable their relevance to be checked (by comparing objectives and reality). It is therefore necessary to select metrics and measures that allow stakeholders to make relevant decisions in a timely manner. Each project stakeholder will have different objectives from other stakeholders:
– customers are concerned by the availability of the application and its level of quality;
– hierarchy is often focused on costs and deadlines;
– the production teams are focused on correcting defects and delivering code;
– test teams are focused on covering risks, requirements and test cases;
– the test manager must focus simultaneously on the project (effectiveness and efficiency) and on the product (remaining risks, features available or not, etc.).
This means the test manager must select metrics and measures to cover each of the objectives of each of its stakeholders.
6.1. Selecting metrics
Choosing the right metrics for a project is complicated: we have to provide information to evaluate a process and make decisions, and at the same time, the measurements must not be too heavy or complex.
If, for convenience, we limit ourselves to the metrics proposed by the testing tools (e.g. test cases and the number of cases passed with success or failure), we will not take into account the objectives of the stakeholders (measurement of the load used vs. expected load, fulfillment of requirements, etc.). Moreover, these metrics often only measure the test cases designed and performed, not those to be designed to properly cover the requirements or the necessary quality characteristics.
Often the proposed metrics are the measurement of test cases passed, failed or blocked. Who is interested in test cases (apart from testers)? Nobody!
– customers are interested in features and there is no direct link between a feature and the number of test cases to be executed to validate it;
– the production teams are interested in the anomalies to be corrected and the functionalities to be developed, which is not measurable in the event of a test;
– the hierarchy is interested in costs and deadlines and the number of test cases – which can be manual or automated – is not useful to measure this.
We can therefore wonder why many test managers continue to shower their stakeholders with useless information.
To choose the metrics to follow, we can use the GQM (Goal Question Metric) technique, which consists of three steps, to be repeated with each of the stakeholders:
1) identify the objectives (Goals) of each stakeholder;
2) for each objective, define the questions that need to be answered to ensure that the objective is achieved;
3) for each question, determine the metrics and measures to analyze to answer the question.
We will obtain the metrics to report to each of our stakeholders.
6.2. Metrics precision
The level of precision of the metrics is often problematic in their choice. No metric provides an exact and 100% reproducible certified value: we are in a fuzzy and constantly changing world. Now, let us not throw the baby out with the bathwater: even a partially incorrect metric is better than no metric at all. Indeed, the metrics will give us an order of magnitude, an indication of the state of things, and we can improve it.
The measurements reported periodically should allow decisions to be made on the project or the product. These measurements should be as correct as possible. In a constantly evolving project, the level of precision of the measurements can be questionable. The data evolves every moment (e.g. anomalies discovered or corrected), so the measurements will be associated with a level of inaccuracy.
Another level of inaccuracy relates to the size of the sample from which the statistics will be deduced. Mathematical formulas exist for determining sample size, and the number of measurements needed is often significantly larger than the number of measurements we have. It will therefore be necessary to take the measures by considering a margin – significant? – of error.
It is necessary to accept this level of uncertainty and to focus on trends representing evolutions over several periods. These trends will allow us to make anticipations and forecasts, all other things being equal.
If during the project, it is possible that the measurements are not exact, at the end of the project, the level of accuracy of the measurements should be significantly better. The test manager can therefore use these measures to propose improvements to the test processes during the finalization phases of the level or iteration test activities.
6.2.1. Special case of the cost of defaults
A common metric is measuring the “cost of defects” by dividing testing expenses (design, execution, fix, retest, etc.) by the number of defects identified. Note that such a measurement is not linear. As soon as we have a reduced number of defects, the unit default cost becomes very high while the quality is in fact very good. We do not recommend using this metric.
6.2.2. Special case of defects
The defect sheets or reports are sources of important metrics: it is by measuring the number of defects per component that we will identify the aggregates of defects and that we will evaluate the level of efficiency of the activities. It is therefore important that all defects, even the most benign, are entered into the defects management tool, and that the data is filled in correctly.
It is obvious that nobody will introduce in the defects management tool a defect corrected immediately (e.g. a developer who corrects their code); however, this will not make it possible to identify the components having undergone difficulties of realization or design.
Completion of defect report fields – for example, quality characteristic, root cause, introduction phases, type of code (legacy or new), etc. – often leaves something to be desired. When statistics are performed on defects, this poor quality of data limits the lessons that could be drawn from these defects reports, whether in terms of root causes, quality characteristics to promote, design process to improve or technical debt in the code.
6.2.3. Accuracy or order of magnitude?
A project is always in constant evolution, so the measurements that are taken and reported always represent a past vision and not a current vision to the nearest second. When we measure the number of test cases run to show progress at the project meeting this afternoon, we will have – at best – a difference of a few hours of work. The same will apply for identified anomalies and corrected anomalies.
If past information is provided, it may be necessary to define when the measurement took place. If we want to provide predictions about the future, it will be necessary to weight the calculated value with a plus or minus uncertainty factor (e.g. +/- 10%). This solution will allow us to protect ourselves from future uncertainties.
The uncertainty rate should be based on an analysis of the differences identified in the past between predictions and realizations. We can consider that “all other things being equal” there is no reason that velocity, effectiveness, efficiency or quality level would show a very significant improvement. An order of magnitude should therefore be able to meet the need. To understand the difficulties of accurate forecasts, refer to Taleb (2008).
To use a quote from Tom Gilb, “a metric is better than no metric at all, because it can always be improved”.
6.2.4. Measurement frequency
Trends are calculated by taking several measurements over time. The periodic reporting and analysis of measurements are important elements allowing the test manager to measure the quality of the product, the level of progress of the tests and the efficiency of the processes.
However, for testers, taking measurements and reporting them daily (or according to another frequency) to the test manager is a significant burden. Similarly, the recovery, merging and analysis of the reported measurements are also heavy activities for the test manager. It is therefore recommended to try to automate as much as possible the activities of reporting measurements and analyzing metrics. Take care that the measurements taken are not distorted by other unmeasured elements (e.g. drop in the number of anomalies detected over a period of time, when the tests could not be carried out on this period).
Depending on the phases of the project, a weekly or daily frequency may be necessary. For some aspects, monthly reporting may be sufficient. The frequency of measurement must adapt to the frequencies of reporting on the project.
6.2.5. Using metrics
Regardless of the metrics used, it is essential that this data is used to improve processes and/or the product, and is never used to punish people or teams. In addition, it is important to use several metrics so as not to be misled by the use of a single metric.
There are also different levels of metrics: some will be used to refine the understanding of other metrics and will be kept at the test team level; others will relate to the project as a whole and will be escalated to higher levels.
A measurement without a reference is useless: a value can be close to or far from the desired target. It is therefore necessary to associate each metric with a range or target, which will make it possible to compare the measured values with the predicted values. We will then be able to define whether the current state is above or below the planned target and therefore what decisions to take if necessary.
The metrics will therefore be able to measure the progress of the processes (design and test of the system-of-systems) as well as the progress of the product (the system-of-systems itself and its various functionalities).
It is possible to use metrics on:
– components and their design processes regardless of the methodology;
– systems and component integration, as well as integration processes;
– functionalities of the system-of-systems, with a detail by criticality;
– evaluation of the deliverables and the processes that are at their origin.
As mentioned before, we need to set target values for each metric, before we even start measuring.
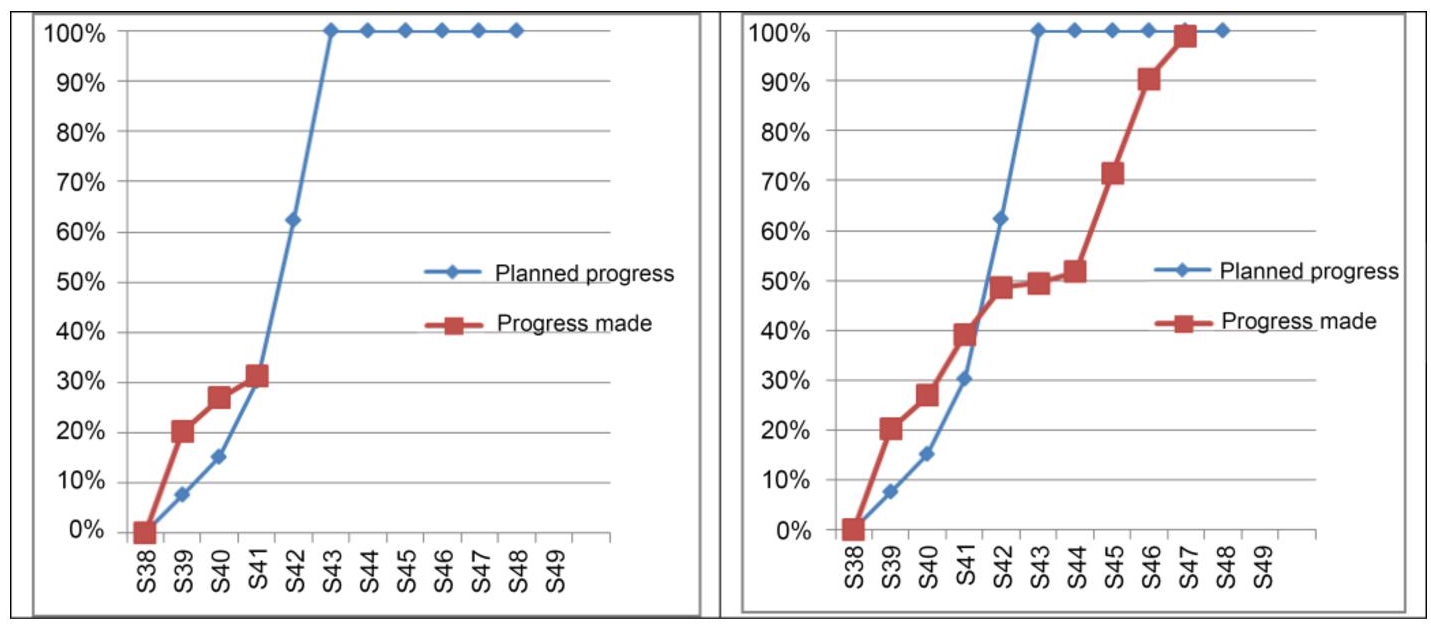
Figure 6.1 Progress chart
Above we can see the progress chart of an activity at two points in time. The forecasts are fixed, while the actual evolves over time.
6.2.6. Continuous improvement of metrics
The initial estimate – the target – may have been incorrectly estimated initially. So the forecasts will be wrong and it will be necessary to reassess them. This re-estimate is necessary to ensure that the data reported is correct and reflects reality.
The initial estimate may need to be modified, for example, to reflect variations in workload, performance, resources, scope or timelines. An image taken before the reassessment can serve as a reference and be compared – during the feedback meeting at the end of the project – with subsequent data.
6.3. Product metrics
Product quality metrics measure a definition of product quality. By “a definition” we mean what the project considers to be the quality attributes of the product. Some projects will consider the completeness of the requirements – functional or technical – of the product (all the requirements or features or user stories – of a defined level of criticality – planned for the product have been developed), others will consider the fact that the product is without faults or without critical faults, etc., and others will relate to the measurement of the risks.
If we consider that the quality of the product focuses on the availability – and the functioning without failures – of the specifications, functional and non-functional, as well as on their reliability, then it will probably be necessary to refine the measures according to the criticality in order to define an MVP (Minimum Viable Product). The MVP will then be the subset of critical features that will be evaluated.
Another way to measure the functional quality of the product is to rely on the quality characteristics defined by the standard (ISO25010 2011) or to identify the critical functionalities of the product, system or system-of-systems and their quality levels.
We have metrics based on:
– requirements, allowing, for example, users to identify the percentage of requirements satisfied without defect, or requirements with at least one defect or requirements not yet satisfied or processed;
– quality characteristics, which make it possible to measure the level of satisfaction that can be associated with each quality characteristic or sub-characteristic (according to the quality reference system used on the project);
– components (or the functionalities) in order to identify the level of quality of each of the components and the aggregates of defects that may exist.
6.3.1. FTR: first time right
Derived from first time fix right, which ensured that a correction did not generate other anomalies, first time right focuses on the ability to provide a good quality component that does not need to be reworked. This metric measures the efficiency of the development–test couple, by identifying the number of round trips (correction iterations) between the development teams and the test teams before the component is considered good enough to be put into production.
Among the criteria to include, we have:
– traceability from/to requirements;
– presence and completeness of the documentation;
– results of test case executions available and correct;
– external interfaces with correct and functional components.

FTR is measured, during system tests or acceptance tests, by identifying per component the number of times it is re-tested following the identification of an anomaly. The “components” can be software bricks or functionalities. The objective (the target to be reached) is 1, that is, each component is tested once and only once before being considered correct.
In an Agile world, this implies respecting all the criteria for defining DONE and that the component must no longer be modified or retested.
6.3.2. Coverage rate
To correctly evaluate a product, it is necessary to ensure that the product has been completely tested. This involves several simultaneous levels of coverage, including:
– coverage of risks by test cases, with an increase in number of test cases (and/or number of test techniques to be used) if the risks are high;
– coverage of requirements, use cases and user stories, by a sufficient number of tests to ensure that the requirements, use cases and user stories do what they are supposed to do, and do not do what that they are not supposed to do. This often involves the use of multiple test techniques and many test cases per requirement;
– feature coverage, where we will ensure that all features are properly tested and validated, often in decreasing order of priority and criticality;
– coverage of quality characteristics (see ISO25010) according to the level of risk associated with each characteristic or sub-characteristic. Here too we will have the use of multiple test techniques and a large number of test cases;
– coverage of environments insofar as the real environments may be different from the environments used during the tests;
– code coverage, where we will ensure the quality of the code and compliance with coding rules, the absence of dead code, etc.;
– component coverage where we will ensure that all components – in their latest version – have been correctly and exhaustively tested. By component we will have, for example, screens, functions, reports or interfaces;
– the coverage of test techniques, where we will ensure that all the various test techniques provided are correctly applied in order to find as many defects as possible.
To measure the coverage rate, we will need to measure the percentage of tests passing – for a category – compared to the total number of tests for that category. This involves ensuring the presence of a link – traceability – between the criteria to be covered and the test cases covering these criteria. These links are easy to set up when they are defined at the start of the test design; on the other hand, they involve a significant workload if it is a question of adding these indicators after the start of the test design. Some tools allow traceability – often tree-like – from requirements to test cases.
The information provided during the reporting must include the coverage rates, to link the information collected to all the requirements initially requested.
6.3.3. Code churn
Code change over time is calculated as the sum of lines of code added, removed or changed. Although this can help measure code rewrites – fixes, refactoring, etc. – it is necessary to relate these measures to the additions, modifications or corrections, of functionalities. Agility suggests scheduling consolidation sprints, where code is refactored and simplified, so these sprints will have higher code churn rates than others where new features are designed. A “code churn” ratio that is not associated with corrections or evolutions can be synonymous with the desire for perfectionism by the design teams.
However, care must be taken when calculating the “code churn”, insofar as:
– the number of lines of code varies according to the languages and is not synonymous with functionalities unlike function points;
– the calculation does not take into account the size of the design team, therefore the volume of modified code;
– the calculation is done using configuration management tools, so everything that is not managed in configuration is not taken into account;
– the calculation does not take into account the evolutions or the complexity of the functionalities.
The measurement of “churn” in the business (customer abandonment rate, for example, in percentage of abandonment of subscriptions) is important to measure if it is linked to new versions or deliveries of the product. It can indeed indicate a lack of quality in the product.
6.4. Process metrics
The test manager must ensure that the test processes implemented are effective, efficient and constantly improving. This involves iterative activities of measuring the effectiveness and efficiency of processes, analyzing deviations and defining quantified improvement actions.
6.4.1. Effectiveness metrics
6.4.1.1. DDE: defect detection efficiency
The DDE metric measures the defect detection efficiency of the various processes used.
The principle is that our testing activities must find the maximum number of defects and only allow a very small number of defects to pass to later phases. This metric can be evaluated at various stages and at the full system-of-systems level. We can also use this metric to assess the effectiveness of subsequent testing activities.
It is possible to weight this metric according to the level of criticality of the defects. This will identify whether the “faults found during testing” correspond to higher levels of criticality than the “faults found subsequently”.
6.4.1.2. DRE: defect removal efficiency
Once faults have been found, it is important to remove them. This is where the defect removal efficiency (DRE) metric comes in; DRE is the sum of the defects corrected before delivery divided by the sum of the defects corrected before delivery and the defects reported by customers or users during the first three months of use.
It is important to note that applications that have a DRE greater than 95% tend to have shorter cycles and lower costs (including maintenance costs) than applications with a lower DRE.
It is not mandatory to correct all identified defects; it is a business decision, so the DDP will be superior to the DRE. However, the business decision not to correct anomalies will have a negative impact on the perceived level of quality.
The DRE target value should be close to 99.5%, while it is often around 85% according to Jones (2018).
6.4.1.3. CRI: coverage of risks
The risks identified should be covered – depending on their level of criticality – by one or more tests. The risks the stakeholders have decided to ignore should not be counted.

It is also necessary here to weight this CRI metric by the level of criticality of the risks. We note that we can have several tests for the same risk. The target for risk coverage should be 100% for all critical, major and significant risks.
6.4.1.4. ART: automated regression testing
A criterion of confidence for the systems is the percentage of automated regression tests (ART). It is calculated as follows:
Warning: this metric does not consider the total number of test cases to be considered, nor the level of coverage of the requirements, risks or structure of the component under test. Similarly, we have no information on the size of automated tests compared to the size of non-automated tests.
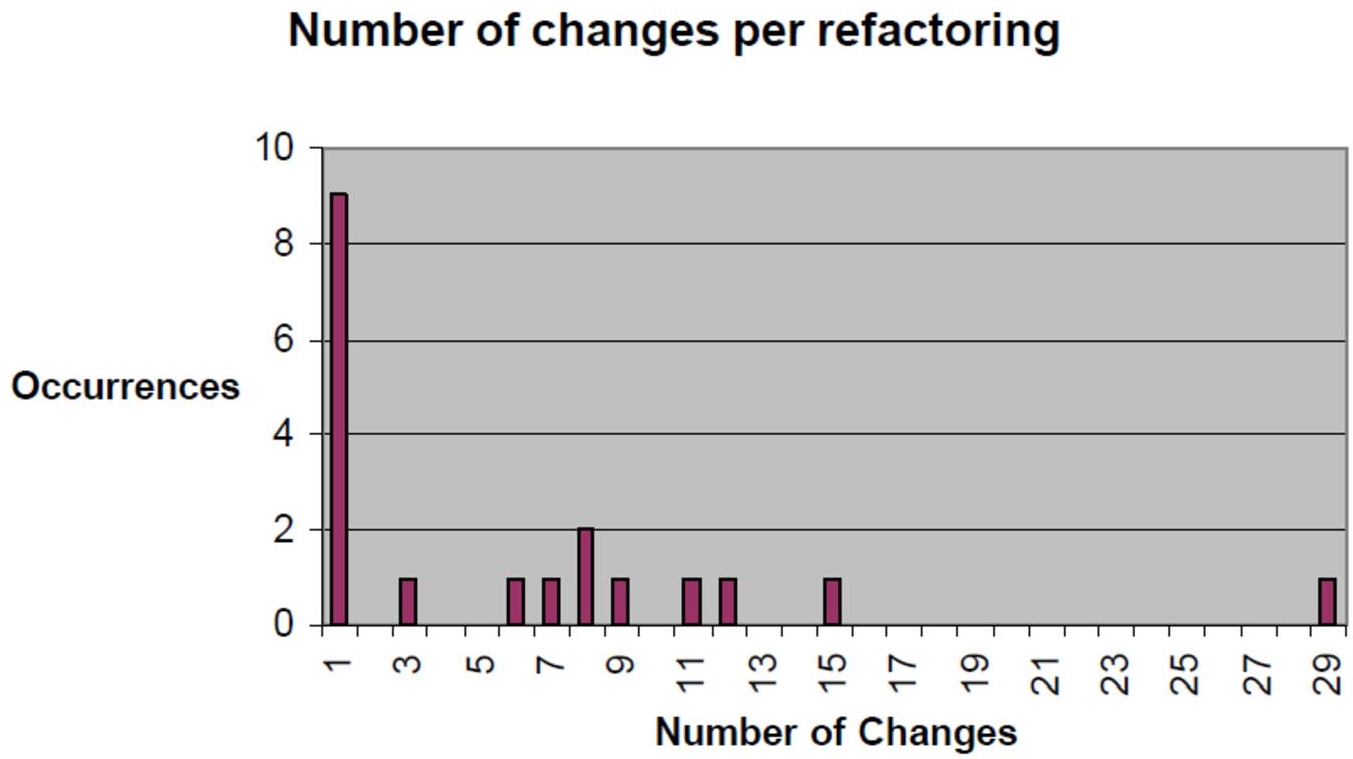
Figure 6.2 Graph of changes during refactoring
The target for the ART number will vary by criticality and development model. In the case of DevOps, the ART should be close to 100%.
6.4.1.5. TDD and design effectiveness
Agile design using TDD (or ATDD or BDD) provides useful information for the test manager, including:
MBR: modifications before refactoring, which allows us to see whether the basic principle of TDD (small tests followed by small pieces of code) has been respected.
RFT: ratio between functional and test lines of code should be close to 1.
It is important to note that this efficiency rate (RFT) can also be calculated for programs where the size is calculated in function points. Estimations based on function points (FPs) are generally much more accurate than those based on lines of code (LOC).
6.4.2. Efficiency metrics
Efficiency is the ability of a process to perform well at a given type of work. For a test process, it is the ability to find the most defects and information with the least test effort. As with efficiency metrics, the importance of defects – their criticality and impact – will have to be considered.
6.4.2.1. Defects per FP
The objective is to measure the number of defects introduced into the product by the development teams per function point. According to Jones (2008), the average number of faults per function point for a program with 1,000 function points is 5 faults per function point. This evolves according to the size and complexity of the software and is influenced by many other parameters (e.g. size and skills of the development and test teams, development cycle, type of software developed, duration of the project, etc.).
Table 6.1 Average defects per function points
| FP | Defects/FP |
| 10 | 2.45 |
| 100 | 3.68 |
| 1,000 | 5 |
| 10,000 | 7.6 |
| 100,000 | 9.55 |
The interest of the analysis of the number of defects introduced is to have a realistic defect objective for the test activities. This will give a quantified objective to the test activities. It is obvious that the development teams will identify a certain number of faults (e.g. 2 faults per function point), which will influence the number of residual faults to be found by the testing activities. If the design processes are directly followed by verification activities – which corresponds to phased containment – the impact of defects identified downstream will be less.
On a system-of-system, the test manager in charge of a level should identify the defects introduced and detected by each of the processes of their level. This will make it possible to identify, for each level, the processes that generate defects – to improve them – as well as the effectiveness and efficiency of detecting defects. This implies that the origin of each anomaly will be sought and identified for each defect.
6.4.2.2. Other metrics
Other metrics may be needed to assess the efficiency and effectiveness of testing processes. Some metrics, which will be useful for monitoring progress in production, will require testing before delivery. We could, for example, have:
– MTBF (Mean Time Between Failures): the average time (duration) between two failures. This duration should be as long as possible.
– MTTR (Mean Time To Recovery): average time (duration) between the detection of a failure and the return of the system to a nominal state. This duration should be as short as possible and include both DEV (correction of the defect) and TEST (verification of the quality of the correction and the absence of regression) activities as well as the activities of putting the correction. MTTR can include automated switchover to an alternate system to ensure continued service.
As test teams contribute to the overall quality of the project, other metrics may be useful or even necessary:
– the backlog of anomalies, that is, the average number of anomalies in the open state. This gives an idea of the technical debt;
– the average duration of correction of anomalies – optionally according to the level of severity/priority (RPN) – in order to anticipate the moment when the anomalies will be corrected;
– development team velocity for fixing bugs, to measure the number of bugs that can be fixed during a sprint, whether it is a development sprint (percentage of effort assigned to bug fixing) or a consolidation sprint where all effort is focused on bug fixing.
In all cases and for all KPIs, it will be necessary to define targets for these metrics (e.g. MTBF: 6 months and MTTR: 1 hour). These targets should be consistent with system-of-systems usage in production: obviously, a 1-hour MTTR is not consistent for an aircraft or satellite (it should be significantly shorter) but may be correct for an insurance company software system. In any case, the provision of these metrics should be considered in the same way as the other requirements (or user stories) for the product.
6.5. Definition of metrics
Metrics are mainly defined at the beginning of the project. They must make it possible to measure the achievement of the objectives defined in the test policy, in the test strategy and in the master and level test plans.
In general, metrics are considered to measure the efficiency of processes – development and testing – or to assess costs. It is necessary to consider how the metrics can influence and/or can be influenced by the behavior of the actors of the project. With regard to the cost aspects, it is also necessary to ensure that the calculation is not biased at the extremes (e.g. cost of quality becoming astronomical when there is only one defect over the period). Another common failing is wanting to measure too many things, which generates too much measurement burden for a result that will – probably – be misinterpreted. A balance is needed between, on the one hand, the number of metrics to be collected to have a good view of the quality of the project, the product and the processes, and, on the other hand, the number of KPIs to be published, which must be restricted to be correctly understood.
It is not easy to define all the metrics from the start of the project; it may be better to define a limited number of KPIs and then increase the number of metrics as needed. It is then possible to define these metrics according to the GQM technique.
6.5.1. Quality model metrics
We have seen previously the various aspects covered by the quality standards. Each can be measured and KPIs can be defined. Many KPIs are present in ISO25010 (2011) and ISO9126-4 (2004), as well as in Kan (2003). We can also find many statistical values to have points of comparison in Jones (2000, 2008) and Jones and Bonsignour (2012).
6.5.1.1. Effectiveness
Task effectiveness (proportion by which tasks are performed correctly) is based – for testing – on the ability of tasks to identify defects. Elements influencing this metric are:
– quality and volume of the input deliverables;
– skills of the people performing the task;
– number of corrections and changes in the input deliverables;
– duration assigned to the task;
– tools, checklists and processes used for the task.
6.5.1.2. Completeness
Task completeness (proportion of task completeness) can be assessed in several ways:
– If the task is completed, the value will be 100%. The task is considered complete if all the task exit criteria (see also DOD, Definition of Done) are satisfied and there is no need to return to this task later.
– If the task is not completed, or if the task has not started, the proposed value is 0% because the deliverable is not available or usable. We might want to measure the difference between planned and done, in order to identify a percentage of progress, but if the task takes longer than expected, we will have skewed results.
6.5.1.3. Defect introduction
Number of faults (number of faults per period, if the faults have the same importance) introduced by a task and detected in all subsequent tasks. This metric is influenced by:
– the skills of the people performing the task;
– the quality, volume and complexity of the input deliverables;
– the duration assigned to the task;
– the quality assurance or testing activities implemented to verify the task.
6.6. Validation of metrics and measures
How much confidence can we have in the measurements we take or the metrics we put in place? We must make sure that the data is reliable and is not influenced by factors that we do not measure. For example, if we rely on the number of defects found over a period, we are skipping over the testing effort during that period (if our testers are not testing, they will not find defects) and the impact of defects (a critical and blocking defect will have the same weight as a minor defect).
We will therefore need to consider several simultaneous metrics and measures to have a clear and coherent view of our tests. Similarly, we will want to check that our teams are improving, which implies starting from a starting point, a benchmark that we will consider as a reference (a baseline).
6.6.1. Baseline
We can take data available in the industry as a baseline and compare our teams to those that served as a source of this data. However, this comparison does not reflect the skills of our teams, nor the specificities of our organization or our projects. We can therefore decide to measure for a certain time (a week, a sprint or a month) in order to consider the measurement taken as the reference level, the baseline.
From this point on, all subsequent measurements will be compared to this initial measurement. Of course, this initial measurement may be incorrect and not reflect the tasks to be performed; this will lead us to correct our baseline. We will need to ensure that our baseline is consistent. If our baseline is too above or too below industry standard values, we will need to ensure its validity.
6.6.2. Historical data
We could assume that historical data is correct by default since it represents what really happened. Unfortunately, this is not the case because often these projects do not measure all the necessary information. For example, fault measurements frequently only start from system test levels. So anomalies in the design phases – anomalies in requirements, specifications or architecture – and detected by reviews are not reported. Anomalies in the code, detected by static testing or code review, are often corrected without being noted and anomalies in the context of the use of TDD cannot be used because the principle is to create anomalies and then the minimum code for these anomalies is corrected.
So we have significant gaps in the historical measurements we have taken on our previous systems-of-systems. To this, we must add the lack of measurements of related activities – administration, users, maintenance, operations, etc. – related to the use of these systems over time. All these measures are often distributed in other cost centers and are not aggregated with the development costs and the costs of ownership (TCO, Total Cost of Ownership).
As Jones (2017) demonstrates, and based on several thousand projects analyzed over the past 40 years, historical data does not consider a lot of data from load associated with software development. Among the data not measured and to be associated with the developments as well as the maintenance of systems, we have:
– unpaid overtime (up to 25% of the effort);
– allocation of expenses to another project (up to 20% of the effort);
– user workloads to be assigned to the project, such as acceptance testing, requirements elicitation interviews, etc. (up to 50% of effort);
– specialists (testers, architects, database managers, technical writers, etc.) temporarily assigned to the project and not taken into account in the measures (up to 45% of the effort);
– costs of monitoring and reporting metrics (up to 10% of the effort);
– supervision costs (up to 15% of the effort);
– meetings, training and other travel (up to 25% of the effort).
We understand that the lack of measurement of these expenses in past projects can make it difficult to compare them with forecasts for future projects, which would include these factors. However, this consideration is necessary in order to be able to correctly anticipate the size, duration and effort of projects, especially systems-of-systems, which are often very large.
6.6.3. Periodic improvements
Whether in the context of agile projects or for sequential projects, it is necessary to continuously improve the effectiveness and efficiency of our processes. This involves – periodically – comparing the reported metrics of our tasks and processes to the values defined as the baseline for these tasks and processes.
One way to identify if it is necessary to improve processes is to identify whether the defects found during a phase could have been found before this phase. If so, the earlier phases should be improved. Another thing that can be improved is the effort required to identify a type of defect, with the goal of reducing that effort without reducing the ability to identify anomalies.
Improvements can therefore relate to:
– effectiveness: finding more defects;
– efficiency: finding defects with less effort.
6.7. Measurement reporting
All available measurements and information will be useless if they do not inform stakeholders in their decision-making. By “stakeholder” we mean management, development and test teams, and also teams in charge of deployment and operations, as well as teams of co-contractors and subcontractors. On the other hand, it is important to limit the manual effort of recovery and reporting of measures to limit the impact of these activities.
In test strategies and improvement processes, it is important to define how measurements will be used to identify areas for improvement.
The measurement reporting should – as far as possible – compare the planned data with the data – measurements – currently collected. This will allow comparison and identification of differences.
6.7.1. Internal test reporting
The information that the test manager will need is more detailed and comprehensive than that provided to stakeholders. Indeed, the test manager must have a detailed vision of the progress of the tests and be able to synthesize this information for the other stakeholders.
Among the information to follow, the test manager should include:
– the workload planned and carried out on the test project, or even on each of the tasks of the test project;
– the progress in terms of test design (test cases, scenarios and test procedure, etc.) because these elements will have an impact on the tests that can be executed later;
– progress on the provision of test environments, interfaces with other applications for integration tests;
– the provision or generation of the test data necessary for the tests to be executed; this includes setting up the accounts and users that will be used during testing;
– monitoring of risk coverage and requirements according to the level of RPN identified; the objective here is to ensure that the testing effort is consistent with the level of priority;
– the progress of requirements coverage by the designed tests, then – during the test execution phase – by the executed tests;
– the monitoring of defect detection rates, their distribution by software component, product or system and their impact and severity levels; this information will allow us to measure the density of defects (according to the volume of the components) and to identify components concentrating many defects;
– monitoring of the correction times for identified anomalies, to check whether the SLAs (Service Level Agreement) are respected and to identify both the backlog of anomalies and the average correction time. It may be necessary to split this according to the criticalities of the defects;
– analysis of anomalies to identify the main root causes and propose improvement actions in advance of the phase such as static analysis or reviews.
6.7.2. Reporting to the development team
Reporting by the test manager to the development team should include:
– information on the components, software, products or systems that are affected by anomalies;
– a measurement of the number of anomalies found by component and by version in order to define the technical debt associated with each component;
– information on the quality level of each version or release of the software components submitted for testing;
– an indication of the level of quality of the test inputs and the root causes of the anomalies identified.
The reporting expected by the test manager from the development team concerns the planned delivery dates of software components, versions and releases, and the supply of corrections to identified anomalies.
Other information such as the location of anomalies, the average duration of correction of anomalies or the level of quality of the deliverables provided may be part of the information provided by the test manager.
6.7.3. Reporting to the management
The reporting intended for management and the hierarchy mainly concerns:
– compliance with commitments, milestones, charges and deadlines;
– identification of risks, hazards and problems;
– impacts on other systems, environments and domains (if applicable).
Compliance with deadlines can be done by time-on-time diagrams (see Figure 6.3), which allow us to view the milestone reports.
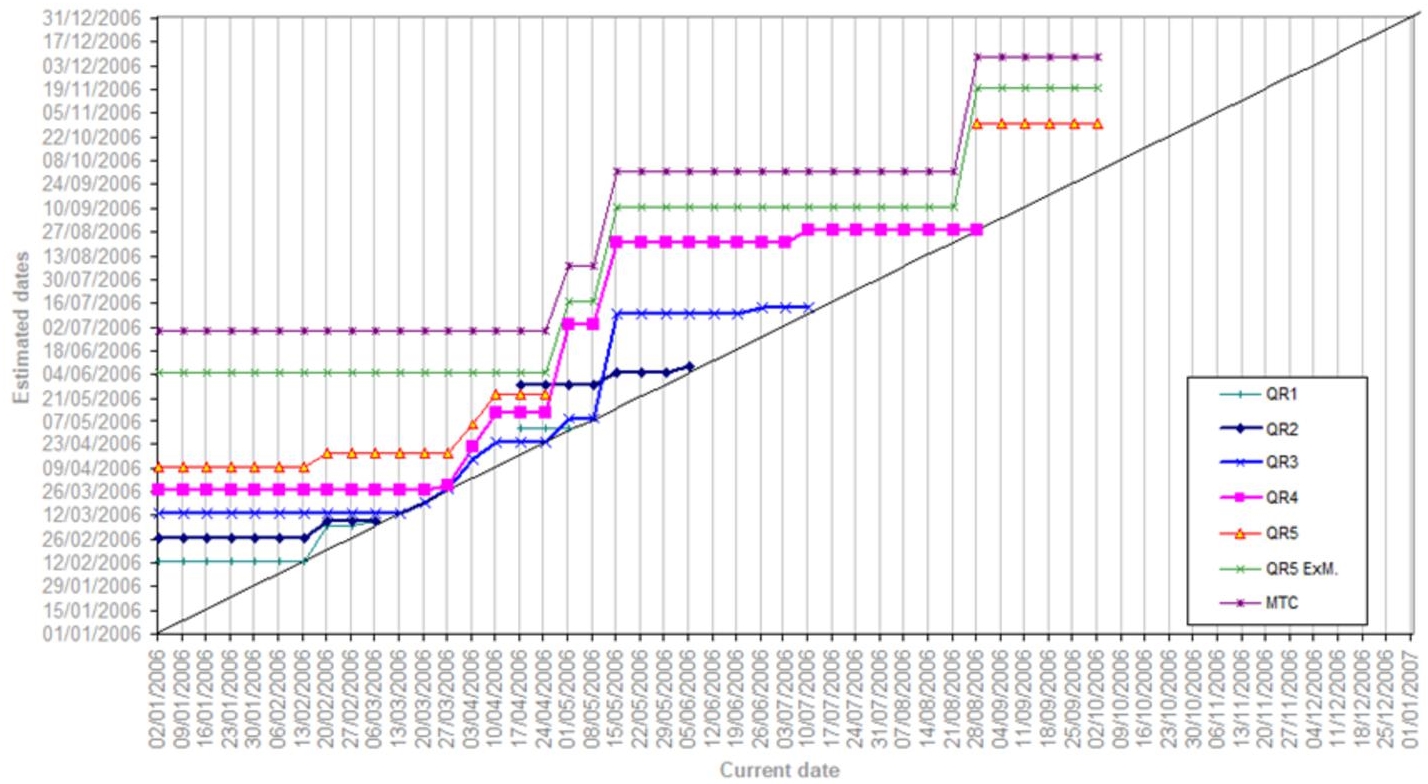
Figure 6.3 Time-on-time diagram
The identification of risks and their states of mitigation is also to be reported to management because certain risks are to be dealt with at hierarchical levels higher than that of the project, and because provisions must probably be anticipated. Risk reporting can be carried out as defined in section 5.6 of Homès (2012).
The identification of impacts on other systems, environments and domains makes it possible to identify potential coordination problems between actors and/or services. The reporting of these elements can be done via shared schedules associated with each of the environments.
6.7.4. Reporting to the clients or product owners
In general, customers and their representatives (e.g. product owners in Agile environments) are focused on:
– obtaining requirements or user stories or features in the production environment in order to obtain the expected benefits;
– identification of applicable limitations or constraints;
– firm delivery dates to manage production milestones (e.g. training, deployment, marketing campaigns, etc.).
It is therefore important to ensure that:
– Traceability, from the contractual requirements and references to the test cases executed on a given version, is correctly established, so that this information reflects the proofs provided and complete. In the context of systems-of-systems subject to regulation, these proofs of design, testing and qualification are necessary to obtain the contractual and regulatory agreement prior to marketing.
– Defects or limitations are identified, as well as the actions that will or will not be implemented to mitigate them. This information must be seen both at the level of the impacts on each of the components, subsystems or systems, and at the level of the end-to-end functionalities of the system-of-systems.
– Milestones and deadlines are realistic rather than reflecting a commercial or marketing wish.
Other more detailed elements may need to be identified, such as:
– detailed percentage of coverage of the requirements, allowing us to visualize the progress;
– quality of deliverables (e.g. the number and type of defects identified in the deliverables entering a task and which should have been identified by previous tasks), making it possible to direct continuous improvement efforts;
– progress of the tests in the phases of analysis, design, implementation of the tests, to ensure that the test activities progress correctly in parallel with the design activities of the components to be tested and that the execution of the testing can begin upon delivery in test environments;
– degree of progress based on the criticality or priority of the requirements or user stories;
– volume of defects as well as their type and location, in order to identify the clusters of defects in the components as well as the components that deserve to be rewritten;
– impacts on the other components, subsystems, systems and on the system-of-systems, both from a functional point of view and from the points of view of exchanged flows, performance, security, volume and capacity.
6.7.5. Reporting to the direction and upper management
Reporting for management and hierarchy is similar to that for customers, but must also identify:
– the risks and their evolution (increase or reduction) on the project;
– the evolution of the use of resources in relation to the progress of activities;
– resource needs – hardware, software, products, tools and personnel – and team training, etc. in order to anticipate the periods of the project when these elements will be necessary.