Calculating Return on Investment
Imagine that Amalgamated Hat Rack is considering two investment options: buying a new piece of machinery and creating a new product line. The new machine is a plastic extruder with a price tag of $100,000. Amalgamated hopes it will save time and money over the long term, and that it will be safer than the current equipment. The second possibility, launching a line of coatracks, will require a $250,000 investment in design, production equipment, and marketing.
How will Amalgamated decide whether these options make economic sense? And if it can afford only one of them, how will it decide which to choose?
By figuring out the return on investment, or ROI. This means evaluating how much money the investment will generate compared with its cost.
Before you begin any ROI analysis, it’s important to understand the costs and benefits of the status quo. You want to weigh the relative merits of each investment against the consequences, if any, of not proceeding with it. Don’t assume that the costs of doing nothing are always high. Even if the new investment promises a significant benefit, it still carries risk. The short-term cost—and the short-term risk—of doing nothing is usually close to zero. Of course, the benefits, too, are close to zero.
Costs and benefits
ROI calculations always involve the following steps:
1. Identify all the costs of the new purchase or business opportunity.
2. Estimate the savings to be realized.
3. Estimate how much cash the proposed investment will generate.
4. Map out a time line for expected costs, savings, and cash flows, and use sensitivity analysis to challenge your assumptions.
5. Evaluate the unquantifiable costs and benefits.
The first three steps are fairly straightforward in theory, though they may be complicated in practice. When calculating the costs of an investment, you include up-front costs (the purchase price of a machine, say) and also costs to be incurred in subsequent years (maintenance and upgrades for the new machine). Savings may come from a variety of sources, such as greater throughput per hour, higher quality (and thus less rework), or a decrease in labor requirements. The cash generated typically comes from new sales. If you are calculating the ROI of a marketing campaign, for instance, you will need to estimate the campaign’s effect on the company’s revenue.
It can be tricky to create a time line for your costs, savings, and increased cash flow, so you may want to turn to your finance department for help with this. Step five is really just a check on the other four: Which costs or benefits can’t you quantify, and how will they affect your decision? For example, would a particular investment help or harm your company’s reputation in the community or with prospective employees?
Once you have completed these steps, you are ready to use one or more of the analytical tools described in this chapter: payback period, net present value, internal rate of return, break-even analysis, or sensitivity analysis. We’ll look at the strengths and weaknesses of each tool to give you a basic understanding. But you may want a colleague from the finance department to assist with the calculations.
Payback period
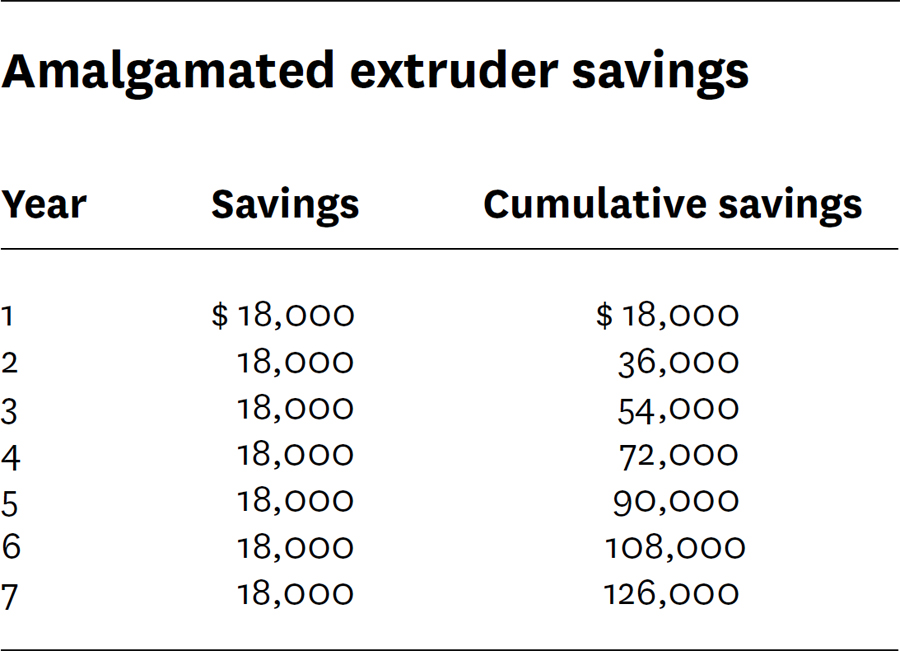
The payback period tells you how long until you recoup your investment. To calculate it, divide the initial investment by the average anticipated cash flow or cost savings per year. For instance, if a new plastic extruder will cost $100,000 and save Amalgamated $18,000 a year, then the payback period is 5.56 years. (See table 1, “Amalgamated extruder savings.”)
Payback analysis is the simplest method for evaluating a prospective investment. It’s useful mainly for ruling out options. If the extruder is likely to last only five years, for instance, it’s obviously a bad investment, because the payback period is longer than that. But payback analysis does not tell you the rate of return on the investment. It also doesn’t take into account the time value of money, because it compares outlays today with cash coming in down the road. (We’ll discuss this further in the following section.)
TABLE 1
Net present value and internal rate of return
Net present value (NPV) and internal rate of return (IRR) are highly valuable analytical tools, but they can be fairly complex. Because most calculators and spreadsheet programs can do the calculations for you, we’ll describe these tools in broad terms only.
Consider the principle that underlies both methods: the time value of money. This principle states that a dollar you receive today is worth more than a dollar you expect to receive in the future. The reason: Even forgetting about inflation, you can spend or invest today’s dollar right away. You can’t do that with a future dollar. And every dollar you expect in the future comes with some degree of risk. For example, the person or institution that promised it to you may be unable to pay when the time comes.
But you can’t evaluate a new business opportunity without figuring out the value of the money you expect it to generate. So you need a method for expressing future dollars in terms of current dollars. That’s what NPV and IRR calculations allow you to do.
Suppose that Amalgamated expects a new line of coatracks to generate $60,000 in cash annually, beginning one year from now and continuing for five years. Here are the key questions to consider: Given this anticipated cash flow and the $250,000 in upfront costs, is a new line of coatracks the most productive way to invest that $250,000? Or would Amalgamated be better off investing its money in the extruder or something else?
Net present value
A net present value calculation discounts the anticipated $300,000 in cash flow to accurately express its value in today’s dollars. How much should it be discounted? Companies usually establish a minimum rate of return, or hurdle rate, that they can reasonably expect to earn on their investments. (The rate is always well above whatever they would earn on relatively low-risk investments such as government bonds.) Let’s say that Amalgamated’s chief financial officer has set the hurdle rate at 6%.
So your initial outlay is $250,000, the expected return is $60,000 a year for five years, and the discount rate is 6%. If you punch these numbers into the NPV function on your calculator or spreadsheet, the program will give you the NPV. If it’s a positive number— and if no other investments are under consideration— the company should pursue the investment. The NPV for a line of Amalgamated coatracks is $2,742, which suggests that it would be an attractive investment.
But what about the other investment Amalgamated is considering—the $100,000 plastic extruder? At a discount rate of 6% and a savings of $18,000 a year for seven years, its NPV is about $483, which is just barely positive. When we compare NPVs for the two investments, we see that both are positive, but the one for the coatracks is larger. If Amalgamated can afford only one of these investments, it should go with the new line of coatracks.
The discount rate you use makes a big difference in NPV calculations. Suppose the rate were 10% instead of 6%. The NPV for the extruder would then be –$12,368, turning a modestly attractive investment into a very poor one.
Internal rate of return
IRR is based on the same formula as NPV, with one difference: When calculating NPV, you know the desired rate of return—that’s the discount rate—and you use it to determine how much money your future cash flows are worth today. With IRR, you essentially set the net present value at zero and solve the equation for the actual rate of return. Your spreadsheet program or calculator will also perform IRR calculations for you. If the IRR is greater than the company’s hurdle rate, the investment is probably a good bet, though you still need to compare it with other options.
What, then, is a reasonable rate of return for Amalgamated Hat Rack to expect on the new line of coatracks? According to the IRR calculation, it’s 6.4%, which is slightly above the discount rate. So this is a good investment. But again, it wouldn’t be if the hurdle rate were 10%.
Break-even analysis is useful when an investment you’re considering will enable you to sell something new or sell more of something you already offer. It tells you how much (or how much more) you need to sell in order to pay for the fixed investment—in other words, at what point you will break even. With that information in hand, you can look at market demand and competitors’ market shares to determine whether selling that much is realistic.
First let’s put the goal in more precise terms. We’re trying to determine the volume at which the incremental contribution from a product line equals the total cost of your investment. “Contribution” in this context means the revenue you get from each unit sold minus that unit’s variable costs. Variable costs include the cost of materials and any direct labor involved in producing the unit.
Here are the steps:
• Subtract the variable cost per unit from the unit revenue. This is the unit contribution.
• Divide your total investment by the unit contribution.
The quotient is the break-even volume, expressed as the number of units (or additional units) that must be sold to cover the cost of the investment.
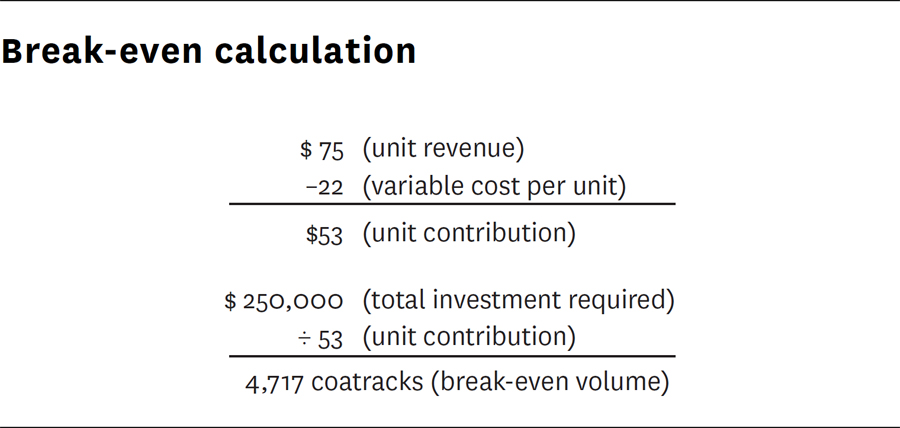
Suppose the new coatracks sell for $75 each, and the variable cost per unit is $22. The figure “Break-even calculation” shows how to determine the break-even volume for the coatracks.
At this point, Amalgamated must decide whether the break-even volume is achievable. Can it reasonably expect to sell more than 4,717 units? If so, how quickly? What will it take to make that happen?
To calculate the break-even volume for the extruder, you would define the unit contribution as the savings per unit. If the new extruder will save $10 per unit, then your break-even volume is $100,000 divided by $10, or 10,000 units.
FIGURE 5
Sensitivity analysis
As noted, Amalgamated expects its new line of coatracks to begin generating $60,000 in annual cash flow a year from now. But what if some variable in the scenario changed? How would it affect your evaluation of the investment opportunity? Sensitivity analysis enables you to see what changes in your assumptions might mean.
Imagine that people within Amalgamated disagree about the prospects for the new line of coatracks. Sherman Peabody is the vice president of Amalgamated’s Moose Head Division. He would exercise day-to-day oversight of the new product line, and he is the one projecting $60,000 in annual cash flow for five years. Natasha Rubskaya, the company’s CFO, is more doubtful about the investment, primarily because she believes that Peabody has drastically underestimated the marketing costs necessary to support the new line. She predicts an annual cash flow of only $45,000. Then there’s Theodore Bullmoose, Amalgamated’s senior vice president for new business development. Ever the optimist, he is convinced that the coatracks will practically sell themselves, generating an annual cash flow of $75,000 a year.
So Amalgamated conducts a sensitivity analysis using the three scenarios. The NPV for Peabody’s is $2,742. For Rubskaya’s, it’s –$60,444. For Bullmoose’s, it’s $65,927.
If Rubskaya is right, the coatracks won’t be worth the investment. If either of the other two is right, the investment will pay off, with a reasonable amount according to Peabody’s profit projections and a generous amount according to Bullmoose’s. Here is where judgment comes into play. If Rubskaya has shown herself to be the most reliable estimator of the three, Amalgamated’s CEO might accept her projection of the new line’s potential. But whichever route the CEO takes, the sensitivity analysis provides a more nuanced view of the investment and how it would be affected by various changes in assumptions. Changes in other variables can be mapped out just as easily.
Evaluating unquantifiable costs and benefits
The numbers never tell the whole story, so your ROI analysis should acknowledge qualitative factors as well. Does the new opportunity fit with the company’s mission? Can the management team take on a new product line without losing focus? At times, seemingly unquantifiable factors can at least be estimated numerically. Suppose you’re evaluating an investment in a new database, and you are trying to assess the value of the information it will provide. You might come up with a ballpark dollar figure representing the value of employees’ time saved. You might also estimate the value of increased customer retention due to better understanding of purchase patterns. You may or may not decide to incorporate such estimates into your ROI calculations, but they can be helpful when you make the case for the investment.